. 2024 Jul 23;19(1):55.
doi: 10.1186/s13024-024-00740-w.

Astrocytic autophagy plasticity modulates Aβ clearance and cognitive function in Alzheimer's disease

Affiliations

Astrocytic autophagy plasticity modulates Aβ clearance and cognitive function in Alzheimer's disease

Suhyun Kim et al. Mol Neurodegener. .

Abstract

Background: Astrocytes, one of the most resilient cells in the brain, transform into reactive astrocytes in response to toxic proteins such as amyloid beta (Aβ) in Alzheimer's disease (AD). However, reactive astrocyte-mediated non-cell autonomous neuropathological mechanism is not fully understood yet. We aimed our study to find out whether Aβ-induced proteotoxic stress affects the expression of autophagy genes and the modulation of autophagic flux in astrocytes, and if yes, how Aβ-induced autophagy-associated genes are involved Aβ clearance in astrocytes of animal model of AD.

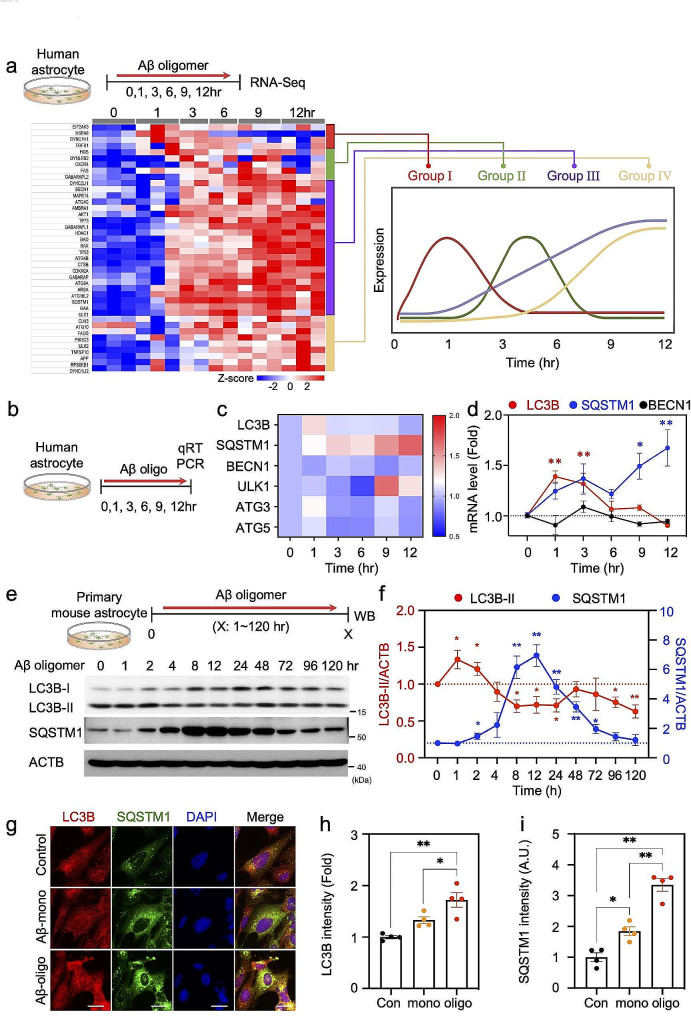
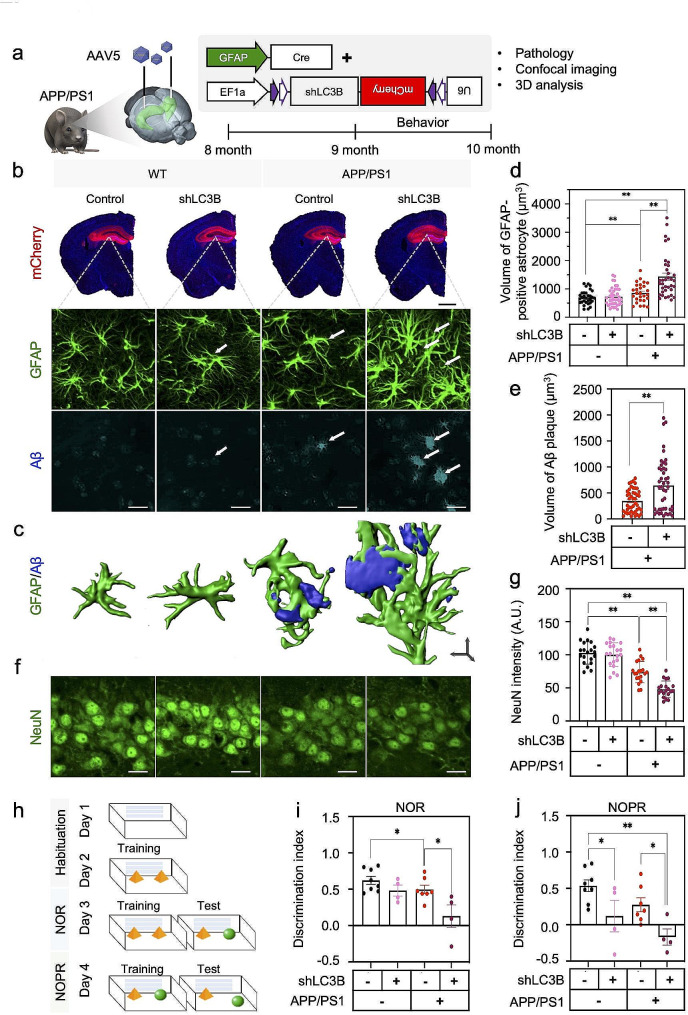
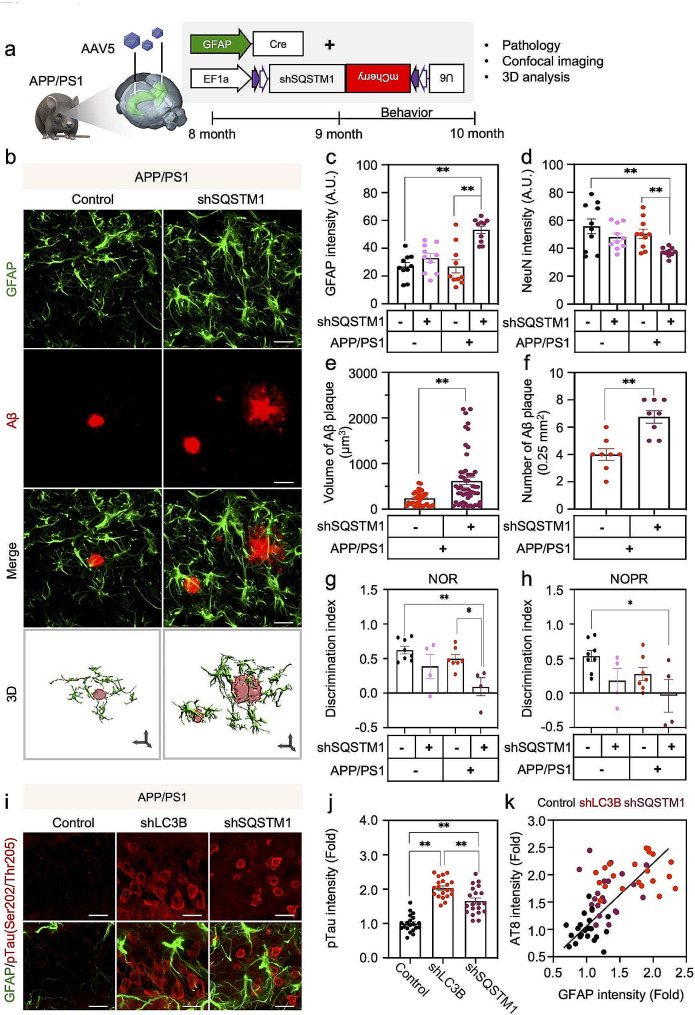
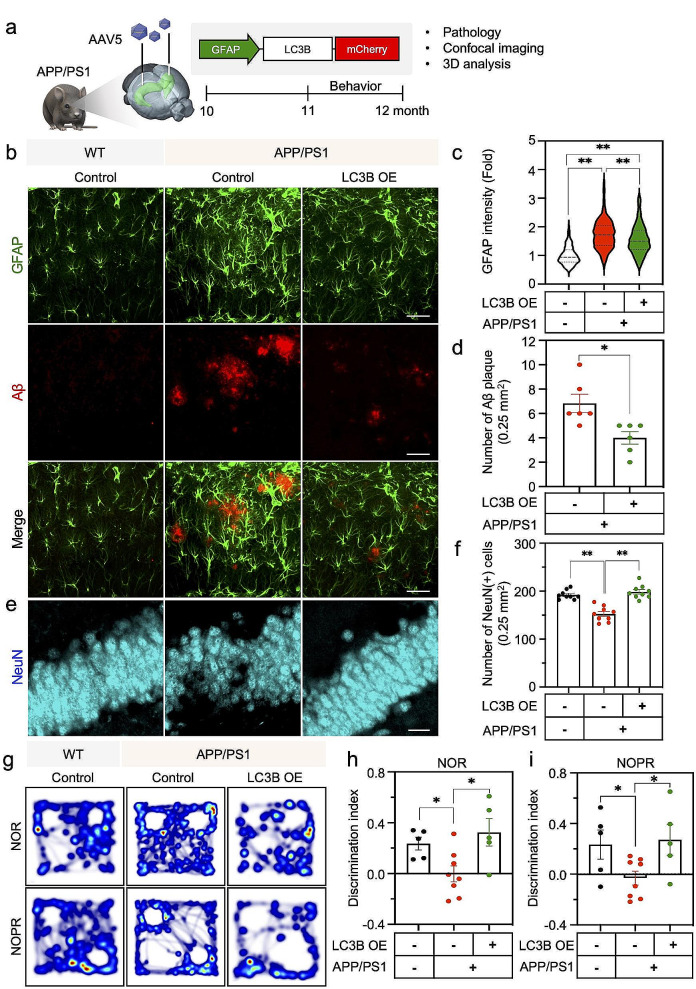
Methods: Whole RNA sequencing (RNA-seq) was performed to detect gene expression patterns in Aβ-treated human astrocytes in a time-dependent manner. To verify the role of astrocytic autophagy in an AD mouse model, we developed AAVs expressing shRNAs for MAP1LC3B/LC3B (LC3B) and Sequestosome1 (SQSTM1) based on AAV-R-CREon vector, which is a Cre recombinase-dependent gene-silencing system. Also, the effect of astrocyte-specific overexpression of LC3B on the neuropathology in AD (APP/PS1) mice was determined. Neuropathological alterations of AD mice with astrocytic autophagy dysfunction were observed by confocal microscopy and transmission electron microscope (TEM). Behavioral changes of mice were examined through novel object recognition test (NOR) and novel object place recognition test (NOPR).

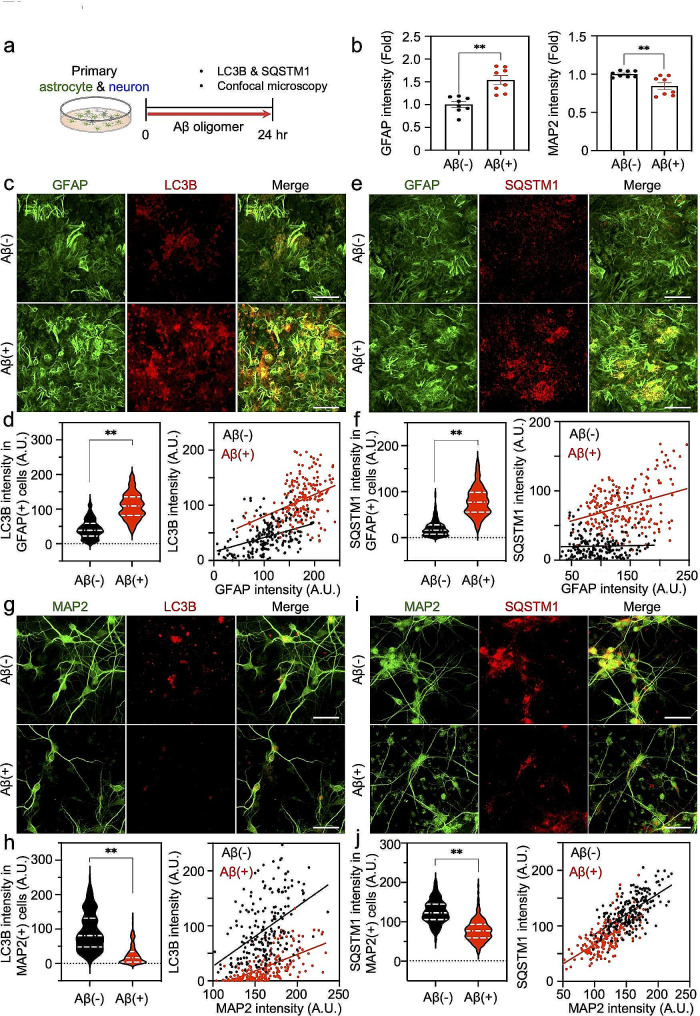
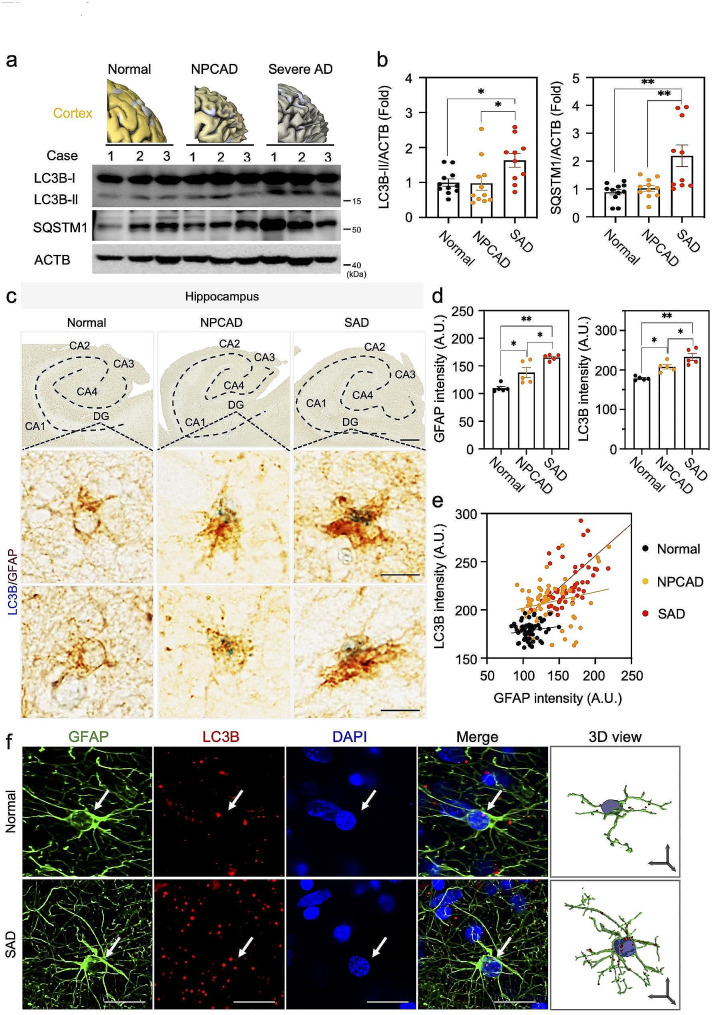
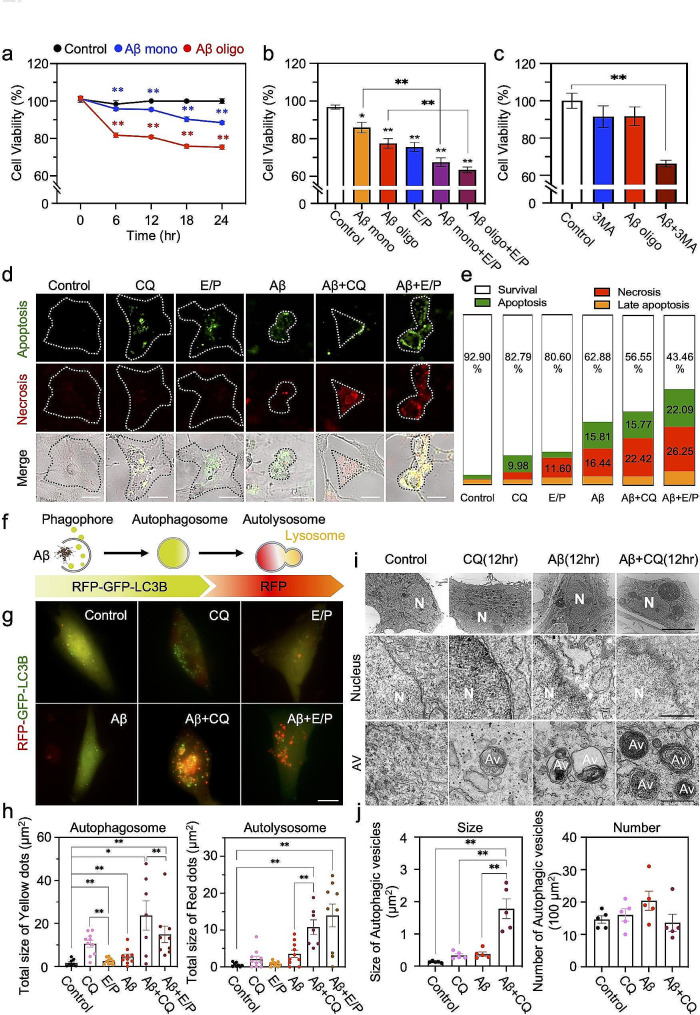
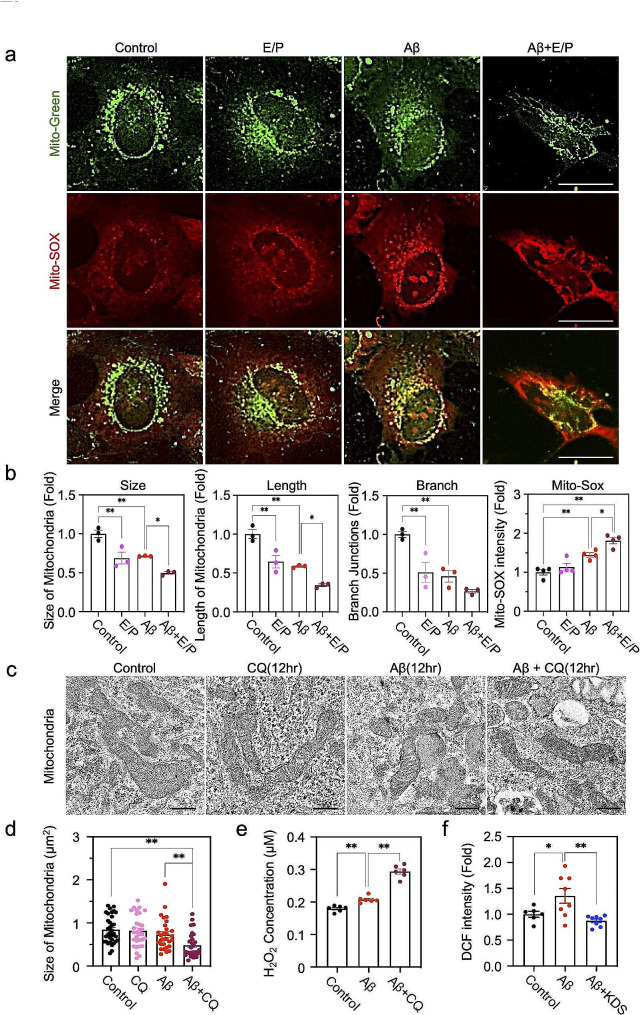
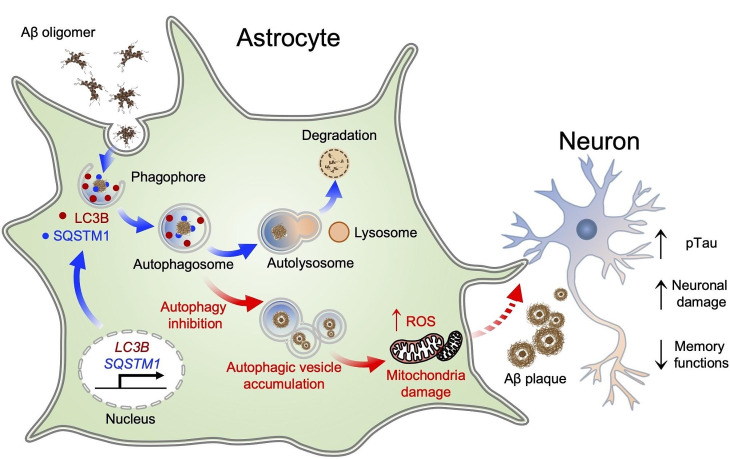
Results: Here, we show that astrocytes, unlike neurons, undergo plastic changes in autophagic processes to remove Aβ. Aβ transiently induces expression of LC3B gene and turns on a prolonged transcription of SQSTM1 gene. The Aβ-induced astrocytic autophagy accelerates urea cycle and putrescine degradation pathway. Pharmacological inhibition of autophagy exacerbates mitochondrial dysfunction and oxidative stress in astrocytes. Astrocyte-specific knockdown of LC3B and SQSTM1 significantly increases Aβ plaque formation and GFAP-positive astrocytes in APP/PS1 mice, along with a significant reduction of neuronal marker and cognitive function. In contrast, astrocyte-specific overexpression of LC3B reduced Aβ aggregates in the brain of APP/PS1 mice. An increase of LC3B and SQSTM1 protein is found in astrocytes of the hippocampus in AD patients.

Conclusions: Taken together, our data indicates that Aβ-induced astrocytic autophagic plasticity is an important cellular event to modulate Aβ clearance and maintain cognitive function in AD mice.

Keywords: Alzheimer’s disease; Amyloid beta (Aβ); Astrocytes; Autophagy; Aβ clearance; Mitochondria.


Conflict of interest statement

The authors declare that there is no competing financial interests.

Figures

Fig. 1
Fig. 1
Astrocytes induce autophagy components (LC3B and SQSTM1) in response to Aβ oligomer but neurons do not. a, Experimental scheme for detecting autophagy components in primary mouse astrocyte and neuron culture. b, Quantification of GFAP or MAP2 immunoreactivity in the primary mouse astrocyte and neuron coculture system with or without Aβ oligomer. A total of 400 cell count, 50 cells/well, n = 8 wells. c, Double immunostaining with GFAP and LC3B antibodies in the primary culture system. Scale bar (white): 50 μm d, Quantification of LC3B immunoreactivity in GFAP-positive astrocytes and their correlation graphs with GFAP intensity. A total of 200 cell count, 50 cells/well, n = 4 wells. e, Double immunostaining with GFAP and SQSTM1 antibodies in the primary culture system. Scale bars (white): 50 μm. f, Quantification of SQSTM1 immunoreactivity in GFAP-positive astrocytes and their correlation graphs with GFAP intensity. A total of 200 cell count, 50 cells/well, n = 4 wells. g, Double immunostaining with MAP2 and LC3B antibodies in the primary culture system. Scale bar (white): 50 μm. h, Quantification of LC3B immunoreactivity in MAP2-positive regions and their correlation graphs with MAP2 intensity. A total of 200 cell count, 50 cells/well, n = 4 wells. i, Double immunostaining with MAP2 and SQSTM1 antibodies in the culture system. Scale bar: 50 μm. j, Quantification of SQSTM1 immunoreactivity in MAP2-positive regions and their correlation graphs with MAP2 intensity. A total of 200 cell count, 50 cells/well, n = 4 wells. A.U.: arbitrary unit, pixel. Significantly different at **, p < 0.01
Fig. 2
Fig. 2
Astrocytes exhibit temporal expression of autophagy-related genes and autophagy flux in response to Aβ oligomer in a timely manner. a, RNA-seq analysis in human astrocyte culture at 1, 3, 6, 9 and 12 h after Aβ oligomer treatment. The altered gene expression was categorized into four groups: Group I, II, III and IV depending on the time point of peak expression. b, Experimental design for a time course of qRT-PCR in Aβ oligomer-treated human astrocytes. c, Heatmap of the expression pattern for autophagy-associated genes. d, qRT-PCR analysis for LC3B, SQSTM1 and BECN1 mRNA levels in response to Aβ oligomer. Line graphs present the mean ± SEM of three separate experiments. e, Western blot analysis data showing that levels of endogenous LC3B-II and SQSTM1 are time-dependently changed in Aβ oligomer-treated primary mouse astrocytes. f, Quantification of the band intensities of LC3B-II and SQSTM1 normalized by β-actin (ACTB). Line graphs present the mean ± SEM of three separate experiments. g, Double immunostaining with LC3B and SQSTM1 antibodies in monomeric or oligomeric Aβ-treated human astrocyte culture. Scale bars (white): 20 μm. h & i, Bar graphs showing the average intensity of LC3B (h) and SQSTM1 signals (i). A total of 20 cell count, 5 cells/well, n = 4 wells. Data are presented as mean ± SEM. Significantly different at *, p < 0.05; **, p < 0.01
Fig. 3
Fig. 3
Astrocytic LC3B and SQSTM1 levels are increased in the hippocampus of AD patients. a, Western blot analysis for detecting the protein level of LC3B-II and SQSTM1 from the postmortem cortex of normal subject, NPCAD-MCI, and severe AD (SAD) patients. b, Densitometry analysis of LC3B-II and SQSTM1 protein levels form panel a. Normal, N = 11 cases; NPCAD, N = 11 cases; SAD, N = 10 cases. c, Double chromogenic immunostaining images for LC3B (blue) and GFAP (brown) in the hippocampus of normal, NPCAD, and severe AD patients. Bottom panels exhibit LC3B (blue) immunoreactivity in GFAP-positive astrocyte (brown) in the dentate gyrus (DG). Scale bars (black): top, 2 mm; middle and bottom, 10 μm. d, Quantification of GFAP and LC3B immunoreactivity. One dot represents an average of 12 cells (a total of 60 cells), 12 cells/case, each N = 5 cases for normal, NPCAD, and SAD. e, A correlation analysis between GFAP and LC3B intensities in the DG of normal, NPCAD, and SAD patients (derived from panel d). f, Representative confocal images of LC3B and GFAP immunoreactivity in the cortex of normal subject and severe AD patients. Arrow (white) indicates LC3B signal in GFAP-positive astrocyte. Scale bars: white, 20 μm; black arrows (x, y, & z in 3D view), 10 μm. Data are presented as mean ± SEM. Significantly different at *, p < 0.05; **, p < 0.01
Fig. 4
Fig. 4
Blockage of autophagy pathway decreases survival of astrocytes in response to Aβ oligomer. a, Aβ monomer or oligomer induces astrocytic cell death. Treatment conditions in human astrocytes: Aβ monomer, 1 µM; Aβ oligomer, 1 µM. Cell viability was measured by MTT assay. b, Inhibition of autophagy function exacerbates cell death in Aβ monomer or oligomer-treated human astrocytes. Treatment conditions: Aβ monomer or oligomer, 1 µM; E64D/Pepstatin A (E/P), acidic protease inhibitors, 10 µg/ml; time, 24 h. Bar graphs represent mean ± SEM from three separate experiments. c, 3MA, a PI3-kinase and autophagosome formation inhibitor, exacerbates cell death of Aβ oligomer-treated primary mouse astrocytes. Treatment conditions: Aβ oligomer, 1 µM; 3MA, 1 mM; time, 24 h. d, Representative images of astrocyte morphology, apoptotic cell death signals (green), and necrosis cell death signals (red) with or without autophagy inhibitors [E/P or chloroquine (CQ)] in human astrocytes under Aβ oligomer treatment. Treatment conditions: Aβ oligomer, 1 µM; E64D, 10 µg/ml; Pepstatin A, 10 µg/ml; CQ, 20 µM; time, 24 h. Scale bars (white): 10 μm. e, Ratio change of cell death patterns (apoptosis, necrosis, and late apoptosis) in astrocytes with or without autophagy inhibitors. f, Working mechanism of autophagy sensor, RFP-GFP-LC3B. Green dots indicate autophagosomes and red dots indicate autolysosomes. g, Representative images of RFP-GFP-LC3B-expressing astrocytes in the presence or absence of autophagy inhibitors (CQ or E/P) in Aβ oligomer-treated human astrocytes. Scale bars: 10 μm. h, Quantification of the size of autophagosome (green dots) and autolysosome (red dots). Cell count: control, n = 8, CQ, n = 10; E/P, n = 10; Aβ, n = 10; Aβ + CQ, n = 7; Aβ + E/P, n = 9. i, Representative transmission electron microscopy (TEM) images representing autophagosome (double membrane vesicles) and autolysosome (dark and dense vesicles) in Aβ oligomer-treated cultured astrocytes. Scale bars (black): upper, 5 μm; middle and bottom, 0.5 μm. Av, autophagy vesicles; N, nucleus. j, Quantification of size and number of autophagic vesicles. Data are presented as mean ± SEM. Measurement and count of ROI (100 µm2)/cell. Significantly different at *, p < 0.05; **, p < 0.01
Fig. 5
Fig. 5
Inhibition of astrocytic autophagy function dysregulates mitochondrial membrane potential and elevates ROS in response to Aβ oligomer. a, Representative images of mitochondrial membrane potential (by MitoTracker staining) and mitochondrial reactive oxygen species (ROS) (by MitoSOX staining) in Aβ oligomer-treated human astrocyte culture with or without E/P. Scale bars (white): 10 μm. b, Quantification of MitoTracker and MitoSOX signals in Aβ oligomer-treated human astrocytes with or without E/P. A total of 20 cell counts, 5 cells/well, n = 4 wells. c, Representative TEM images presenting ultrastructural changes of mitochondria in Aβ oligomer- and/or CQ-treated astrocytes. Scale bars (black): 0.5 μm. d. Quantification of the mitochondria size from EM images among four groups: control, 34 mitochondria counts; CQ, 26 mitochondria counts; Aβ, 29 mitochondria counts; Aβ + CQ, 29 mitochondria counts. Measurement of mitochondria size in 100 µm2 of ROI. e, Amplex UltraRed assay for detecting H2O2 in Aβ oligomer- and/or CQ-treated astrocytes. Bar graphs represent mean ± SEM from 6 wells. f, DCF-DA assay for detecting ROS in Aβ oligomer-treated astrocytes with or without KDS2010 (KDS), a ROS scavenger and reversible MAO-B inhibitor. Bar graphs represent mean ± SEM from 6 wells (control), 8 wells (Aβ), and 8 wells (Aβ + KDS2010). Significantly different at *, p < 0.05; **, p < 0.01
Fig. 6
Fig. 6
Astrocyte-specific knockdown of MAP1LC3B/LC3B escalates Aβ plaque formation, GFAP-positive astrocytes, and cognitive impairment in APP/PS1 mice. a, Experimental scheme for genetic inhibition of astrocytic autophagy in the hippocampus of WT and APP/PS1 mice. b, Double immunostaining for GFAP and Aβ plaque in four groups of mice: Group 1, WT mice with AAV-EF1a-DIO-Control shRNA + AAV-pGFAP-Cre; Group 2, WT mice with AAV- EF1a-DIO-LC3B shRNA + AAV-pGFAP-Cre; Group 3, APP/PS1 mice with AAV-EF1a-DIO-Control shRNA + AAV-pGFAP-Cre; Group 4, APP/PS1 mice with AAV-EF1a-DIO-LC3B shRNA + AAV-pGFAP-Cre. Scale bars: black, 1 mm (upper); white, 20 μm (bottom). c, 3D rendering images (by IMARIS) of GFAP-positive astrocytes (green) and Aβ plaques (blue). Scale bar: black arrows (x, y, & z), 10 μm (3D). d, Quantification for the volume of GFAP-positive astrocytes in four group of mice: WT control, a total of 31 cell counts from N = 4 mice; WT + LC3B shRNA, 40 cell counts from N = 4 mice; APP/PS1 control, 27 cell counts from N = 4 mice; APP/PS1 + LC3B shRNA, 36 cell counts from N = 4 mice. e, Quantification for the volume of Aβ plaques in APP/PS1 control and APP/PS1 + LC3B shRNA mice. A total of 45 plaque counts from N = 4 mice in each group. f, Immunofluorescence images for NeuN-positive neurons in four groups of mice as described in panel b. Scale bars (white): 20 μm. g, Quantification of NeuN immunoreactivity in four groups of mice: a total of 20 ROIs measurement from N = 4 mice in each group. h, Timeline and work flow for behavioral tests (NOR, novel object recognition test; NOPR, novel object place recognition test) in four group of mice: WT control, N = 8 mice; WT + LC3B shRNA, N = 4 mice; APP/PS1 control, N = 7 mice; APP/PS1 + LC3B shRNA, N = 4 mice. i & j, Bar graph showing discrimination index in NOR (i) and NOPR (j) behavior tests in four groups of mice. Data are presented as mean ± SEM. Significantly different at *, p < 0.05; **, p < 0.01
Fig. 7
Fig. 7
Astrocyte-specific knock down of SQSTM1 exacerbates Aβ plaque formation and cognitive impairment in APP/PS1 mice. a, Experimental scheme for genetic inhibition of astrocytic autophagy in the hippocampus of APP/PS1 mice: Group 1, APP/PS1 mice with AAV-EF1a-DIO-Control shRNA + AAV-pGFAP-Cre.; Group 2, APP/PS1 mice with AAV-EF1a-DIO-SQSTM1 shRNA + AAV-pGFAP-Cre. b, Double immunostaining for GFAP and Aβ plaque in the brain of APP/PS1 mice with or without SQSTM1 shRNA injection. Scale bars: white, 20 μm; black arrows (x, y, & z in 3D view), 2 μm. c & d, Quantification of mean intensity of GFAP (c) and NeuN (d) immunoreactivity in four groups of mice: a total of 10 ROIs measurement from each group of N = 4 mice e, Quantification of volume of Aβ plaque in two groups of mice: APP/PS1 control, 32 Aβ plaque measurements; APP/PS1 + SQSTM1 shRNA, 54 Aβ plaque measurements from N = 4 mice in each group. f, Quantification of the number of Aβ plaque in two groups of mice: APP/PS1 control; APP/PS1 + SQSTM1 shRNA, 8 ROIs from N = 4 mice in each group. g & h, Discrimination index from behavioral analyses of NOR (g) and NOPR (h) in four groups of mice: WT control, N = 8 mice; WT + SQSTM1 shRNA, N = 4 mice; APP/PS1 control, N = 7 mice; APP/PS1 + SQSTM1 shRNA, N = 4 mice. i, Double immunostaining for phosphorylated (p)-Tau (AT8: Ser202/Thr205) and GFAP in the hippocampus of LC3B shRNA or SQSTM1 shRNA virus-injected APP/PS1 mice. Scale bars (white): 20 μm. j, Quantification of p-Tau (Ser202/Thr205) intensity in neurons of DG in three groups of mice: a total of 20 ROIs measurements from N = 3 mice in each group. k, Correlation analysis between GFAP and p-Tau (Ser202/Thr205) intensities (derived from panel j). Data are presented as mean ± SEM. Significantly different at *, p < 0.05; **, p < 0.01
Fig. 8
Fig. 8
MAP1LC3B/LC3B overexpression ameliorates neuropathology and improves cognitive function in APP/PS1 mice. a, Experimental scheme for overexpression of LC3B in the hippocampus of three groups of mice: Group 1, WT + AAV-GFAP-mCherry; Group 2, APP/PS1 + AAV-GFAP-mCherry; Group 3, APP/PS1 + AAV-GFAP-LC3B-mCherry. b, Representative immunofluorescence image for GFAP-positive astrocyte (green) and Aβ plaque (red) in the brain of three groups of mice. Scale bars: 50 μm (1st to 3rd raw of images) and 20 μm (4th raw of images). c & d, Quantification of GFAP immunoreactivity (c) and number of Aβ plaque (d). Cell counts: panel c, 150 cell counts from each group of N = 3 mice; panel d, 6 ROIs (0.25 mm2) from each group of N = 3 mice. e, Astrocyte-specific overexpression of LC3B restores NeuN immunoreactivity in the hippocampus of APP/PS1 mice. f, Astrocyte-specific overexpression of LC3B restores the number of NeuN-positive neurons in APP/PS1 mice. A total of 10 ROIs cell from N = 3 mice in each group. g, Representative heatmaps of NOR and NOPR behavioral tests in three group of mice. h & i, LC3B overexpression rescues cognitive (represented by NOR) (h) and spatial memory function (represented by NOPR) (i) in APP/PS1 mice. Cases: WT + AAV-GFAP-mCherry, N = 5 mice; APP/PS1 + AAV-GFAP-mCherry, N = 8 mice; APP/PS1 + AAV-GFAP-LC3B, N = 5 mice. Data are presented as mean ± SEM. Significantly different at *, p < 0.05; **, p < 0.01
Fig. 9
Fig. 9
Astrocytes respond to Aβ oligomer-induced stress and undergo plastic changes in the autophagy processes to remove Aβ oligomer. Aβ oligomer transiently induces expression of MAP1LC3B/LC3B gene and also turns on a prolonged transcription of SQSTM1 gene in astrocytes. These components facilitate Aβ degradation via induced astrocytic autophagy pathway. Pharmacological inhibition of autophagy function exacerbates mitochondrial dysfunction and oxidative stress, and leads to astrocytic cell death. When astrocytic autophagy plasticity is impaired by the loss of LC3B and SQSTM1 function, Aβ aggregations and GFAP-positive astrocytes are increased in AD mice, consequently leading to accelerated neuronal damage and memory dysfunction

References

    1. Carter SF, Scholl M, Almkvist O, Wall A, Engler H, Langstrom B, Nordberg A. Evidence for astrocytosis in prodromal Alzheimer disease provided by 11 C-deuterium-L-deprenyl: a multitracer PET paradigm combining 11 C-Pittsburgh compound B and 18F-FDG. J Nucl Med. 2012;53:37–46. 10.2967/jnumed.110.087031 - DOI - PubMed
    1. Chun H, Lee CJ. Reactive astrocytes in Alzheimer’s disease: A double-edged sword. Neurosci Res 2017. - PubMed
    1. Escartin C, Galea E, Lakatos A, O’Callaghan JP, Petzold GC, Serrano-Pozo A, Steinhauser C, Volterra A, Carmignoto G, Agarwal A, et al. Reactive astrocyte nomenclature, definitions, and future directions. Nat Neurosci. 2021;24:312–25. 10.1038/s41593-020-00783-4 - DOI - PMC - PubMed
    1. Jiwaji Z, Tiwari SS, Aviles-Reyes RX, Hooley M, Hampton D, Torvell M, Johnson DA, McQueen J, Baxter P, Sabari-Sankar K, et al. Reactive astrocytes acquire neuroprotective as well as deleterious signatures in response to Tau and ass pathology. Nat Commun. 2022;13:135. 10.1038/s41467-021-27702-w - DOI - PMC - PubMed
    1. Liddelow SA, Guttenplan KA, Clarke LE, Bennett FC, Bohlen CJ, Schirmer L, Bennett ML, Munch AE, Chung WS, Peterson TC, et al. Neurotoxic reactive astrocytes are induced by activated microglia. Nature. 2017;541:481–7. 10.1038/nature21029 - DOI - PMC - PubMed

Substances