. 2024 Jul 9:15:1415457.
doi: 10.3389/fimmu.2024.1415457. eCollection 2024.

T-cell responses in colorectal peritoneal metastases are recapitulated in a humanized immune system mouse model

Affiliations

T-cell responses in colorectal peritoneal metastases are recapitulated in a humanized immune system mouse model

Job Saris et al. Front Immunol. .

Abstract

Background: The occurrence of peritoneal metastasis (PM) in patients with colorectal cancer (CRC) has a dismal prognosis. There is often limited response to systemic- and immunotherapy, even in microsatellite unstable (MSI) CRC. To overcome therapy resistance, it is critical to understand local immune environment in the peritoneal cavity, and to develop models to study anti-tumor immune responses. Here, we defined the peritoneal immune system (PerIS) in PM-CRC patients and evaluate the pre-clinical potential of a humanized immune system (HIS) mouse model for PM-CRC.

Methods: We studied the human PerIS in PM-CRC patients (n=20; MSS 19/20; 95%) and in healthy controls (n=3). HIS mice (NODscid gamma background; n=18) were generated, followed by intraperitoneal injection of either saline (HIS control; n=3) or human MSS/MSI CRC cell lines HUTU80, MDST8 and HCT116 (HIS-PM, n=15). Immune cells in peritoneal fluid and peritoneal tumors were analyzed using cytometry by time of flight (CyTOF).

Results: The human and HIS mouse homeostatic PerIS was equally populated by NK cells and CD4+- and CD8+ T cells, however differences were observed in macrophage and B cell abundance. In HIS mice, successful peritoneal engraftment of both MSI and MSS tumors was observed (15/15; 100%). Both in human PM-CRC and in the HIS mouse PM-CRC model, we observed that MSS PM-CRC triggered a CD4+ Treg response in the PerIS, while MSI PM-CRC drives CD8+ TEMs responses.

Conclusion: In conclusion, T cell responses in PM-CRC in HIS mice mirror those in human PM-CRC, making this model suitable to study antitumor T cell responses in PM-CRC.

Keywords: CyTOF; T-cell biology; colorectal cancer; humanized immune system; peritoneal immune system; peritoneal metastasis.


Conflict of interest statement

LV is an employee of Genentech Inc. and received consultancy fees from Bayer, MSD, Servier, and Pierre Fabre, but these had no relation to the content of this publication. JG has a collaboration with Roche. The remaining authors declare that the research was conducted in the absence of any commercial or financial relationships that could be construed as a potential conflict of interest.

Figures

Figure 1
Figure 1
The human PerIS is characterized by abundant CD4+- and CD8+ T cells, NK cells and myeloids. (A) t-SNE overlay of human PF color coded per condition: HC (blue) and PM-CRC (red) showing the overlap between both groups. (B) t-SNE of human PF color coded per immune subset (n=5) and split by condition: HC (left) and PM-CRC (right) identifying major immune subsets in both groups. (C) Complex unsupervised heatmap showing proportion of immune subsets in the PerIS relative to CD45+ immune cells, grouped per main lineage, of human HCs (n=3) and PM-CRC patients (n=20). Samples did not cluster based on HC/PM-CRC status. (D) Boxplot of human HC PF (n=3) vs PM-CRC (n=20) showing proportion of immune subsets in the PerIS relative to CD45+ immune cells, grouped per main lineage showing the large abundance of CD4- and CD8 T cells in both conditions. (E) Boxplot comparison of T cells in human HC PF (n=3) compared to human PM-CRC PF (n=20) showing proportion of CD4- or CD8 immune subsets in the PerIS relative to CD4- or CD8 T cells, respectively. Showing increase of CD4+ Tregs in PM-CRC patients. Statistics: Mann-Whitney U test. HC, healthy controls; PM-CRC, peritoneal metastasized colorectal cancer; PF, peritoneal fluid; CyTOF, cytometry by time of flight; t-SNE, t-Distributed Stochastic Neighbor Embedding; CD4 T, CD4+ T cells; CD8 T, CD8+ T cells; Other T, double negative T cells and/or double positive T cells; mono-macs, monocyte/macrophages; CDCs, conventional dendritic cells; PDCs, plasmacytoid dendritic cells; NK, natural killer cell; B, B cells; TCM, T central memory; TEM, T effector memory; Tregs, regulatory T cells; CTL, cytotoxic T cells; TEMRA, Terminally differentiated effector memory. Whiskers show minimum and maximum data values. ** = p ≤ 0.01.
Figure 2
Figure 2
Tumor dependent human-like immune response in the peritoneal cavity of HIS mice. (A) Schematic workflow of HIS intraperitoneal sample collection. HIS mice were injected intraperitoneally with human CRC cell lines (50.000 cells/injection) HCT116 (CMS1, MSI), HUTU80 and MDST8 (both CMS4, MSS). Peritoneal fluid and tumors were collected, digested, sorted for CD45+ cells and analyzed using CyTOF. (B) Representative picture of peritoneal tumors of MDST8 cells on the mesentery of a HIS mouse. Arrows depict tumors. (C) t-SNE overlay of HIS PF color coded per condition: HIS control (blue) and HIS PM-CRC (pink) identifying presence of major immune subsets in both groups. (D) t-SNE of HIS PF color coded per immune subset (n=5) and split by condition: HIS control without tumor injection (left) and HIS PM-CRC with tumor injection (right) identifying five immune subsets in both groups. (E) Complex unsupervised heatmap showing proportion of immune subsets in the PerIS relative to CD45+ immune cells, grouped per main lineage, of HIS control mice (n=3) and HIS tumor mice (n=15). Colors indicate injected cell line and MS status. (F) Boxplot comparison of HIS control mice (n=3) and HIS PM-CRC mice (n=15) showing proportion of immune subsets in the PerIS relative to CD45+ immune cells, grouped per main lineage. An increase in CD4 T cells and a decrease in B naive cells was observed in PM-CRC compared to control. Statistics: Mann-Whitney U test. (G) Boxplot comparison of the proportion of CD4 T and CD8 T cells in the PerIS relative to CD45+ immune cells in HIS control mice (n=3), and mice injected with HCT116 (n=5), HUTU80 (n=6) and MDST8 (n=4). Increase of CD4 T cells in HUTU80 and MDST8. Statistics: Mann-Whitney U test. HIS, humanized immune system; HSCs, hematopoietic stem cells; t-SNE, t-Distributed Stochastic Neighbor Embedding; PF, peritoneal fluid; PM-CRC, peritoneal metastasized colorectal cancer; MS, microsatellite; MSI, microsatellite instable; MSS, microsatellite stable; CD4 T, CD4+ T cells; CD8 T, CD8+ T cells; Other T, double negative T cells and/or double positive T cells; DCs, dendritic cells; NK, natural killer cell. Whiskers show minimum and maximum data values. (* = p ≤ 0.05; ** = p ≤ 0.01).
Figure 3
Figure 3
Peritoneal Tregs in the PF of HIS mice expand only in MSS PM-CRC, while MSI PM-CRC-responses are defined by CD8 TEM expansion. (A) t-SNE of reclustered T cell immune subsets in HIS PF, color coded per immune subset (n=11) and split by cell line. (B) Boxplot comparison of PF from HIS control mice (n=3), and mice injected with HCT116 (n=5), HUTU80 (n=6) and MDST8 (n=4), showing proportion of different CD4- and CD8 T cell subsets in the PerIS relative to total CD4T/CD8T cells, grouped per main T cell lineage. Statistics: Mann-Whitney U test. (C) Boxplot comparison of PF from both control and PM-CRC of both HIS and human showing proportion of CD4 Tregs and CD8 TEMs. Both HIS (n=10) and human (n=19) samples are exclusively MSS tumor bearing. Statistics: Mann-Whitney U test. HIS, humanized immune system; PF, peritoneal fluid; MSI, microsatellite instable; MSS, microsatellite stable; CD4 T, CD4+ T cells; CD8 T, CD8+ T cells; TCM, T central memory; TEM, T effector memory; Tregs, regulatory T cells; CTL, cytotoxic T cells; DNT, double negative T cells; DPT, double positive T cells; t-SNE, t-Distributed Stochastic Neighbor Embedding; PM-CRC, peritoneal metastasized colorectal cancer. Whiskers show minimum and maximum data values. * = p ≤ 0.05.
Figure 4
Figure 4
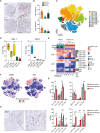
Peritoneal tumors in HIS mice have increased CD4 TCM, CD4 Treg and CD8 TEM subsets which show high expression of CD69 and PD1. (A) Immunohistochemical staining of CD4+ and CD8+ cells infiltrating HIS peritoneal tumors (representative picture: MDST8 cell line) Scale bars 200 µm (left) and 60 µm (right). (B) Quantification of infiltrating immune cells per cell line, manually counted using QuPath software. Every dot represents one tumor from the indicated cell line. Bar graph shows mean ± SD of minimally 3 technical replicates. (C) t-SNE of reclustered T cell immune subsets in PM of MSS-HIS mice, color coded per immune subset (n=12). (D) Boxplot analysis of T cells in PM from MSS-HIS mice (n=4) showing proportion of T cell subsets in the PM relative to T cells, grouped per main T cell lineage (CD4 left; CD8 right). (E) Complex supervised heatmap showing the proportional abundance relative to total CD45+ immune cells per main T cell subset (CD4 T, CD8 T and other T) of PM of both MSS-HIS mice (n=4) and humans (n=5; MSS only). (F) Feature plot showing T cell activation/exhaustion markers on PM derived T cell subsets, CD69 (left) and PD1 (right). (G) Bar graph comparison of PD1+ (upper panel) and CD69+ (lower panel) expressing T cells subsets from PF of control HIS mice, MSS tumor bearing HIS mice and PM (MSS only). Bar graph shows mean ± SD of minimally 3 technical replicates. (H) Immunohistochemical staining of PD1+ cells that have infiltrated a HIS peritoneal tumor from the MDST8 cell line. Scale bars 0-100um, magnification 5x (left) and 20x (right). HIS, humanized immune system; MSI, microsatellite instable; MSS, microsatellite stable; CD4 T, CD4 T cells; CD8 T, CD8 T cells; TCM, T central memory; TEM, T effector memory; Tregs, regulatory T cells; CTL, cytotoxic T cells; DNT, double negative T cells; DPT, double positive T cells; PD1, Programmed cell death protein 1; t-SNE, t-Distributed Stochastic Neighbor Embedding; PM, peritoneal metastasis. Whiskers show minimum and maximum data values.

References

    1. Franko J, Shi Q, Meyers JP, Maughan TS, Adams RA, Seymour MT, et al. . Prognosis of patients with peritoneal metastatic colorectal cancer given systemic therapy: an analysis of individual patient data from prospective randomised trials from the Analysis and Research in Cancers of the Digestive System (ARCAD) database. Lancet Oncol. (2016) 17:1709–19. doi: 10.1016/S1470-2045(16)30500-9 - DOI - PubMed
    1. Lenos KJ, Bach S, Ferreira Moreno L, Ten Hoorn S, Sluiter NR, Bootsma S, et al. . Molecular characterization of colorectal cancer related peritoneal metastatic disease. Nat Commun. (2022) 13:4443. doi: 10.1038/s41467-022-32198-z - DOI - PMC - PubMed
    1. Laoukili J, Constantinides A, Wassenaar ECE, Elias SG, Raats DAE, van Schelven SJ, et al. . Peritoneal metastases from colorectal cancer belong to Consensus Molecular Subtype 4 and are sensitised to oxaliplatin by inhibiting reducing capacity. Br J Cancer. (2022) 126:1824–33. doi: 10.1038/s41416-022-01742-5 - DOI - PMC - PubMed
    1. Guinney J, Dienstmann R, Wang X, de Reyniès A, Schlicker A, Soneson C, et al. . The consensus molecular subtypes of colorectal cancer. Nat Med. (2015) 21:1350–6. doi: 10.1038/nm.3967 - DOI - PMC - PubMed
    1. Chalabi M, Fanchi LF, Dijkstra KK, Van den Berg JG, Aalbers AG, Sikorska K, et al. . Neoadjuvant immunotherapy leads to pathological responses in MMR-proficient and MMR-deficient early-stage colon cancers. Nat Med. (2020) 26:566–76. doi: 10.1038/s41591-020-0805-8 - DOI - PubMed