. 2024 Jun 21;27(7):110343.
doi: 10.1016/j.isci.2024.110343. eCollection 2024 Jul 19.

Maternal high fat diet induces circadian clock-independent endocrine alterations impacting the metabolism of the offspring

Affiliations

Maternal high fat diet induces circadian clock-independent endocrine alterations impacting the metabolism of the offspring

Lu Ding et al. iScience. .

Abstract

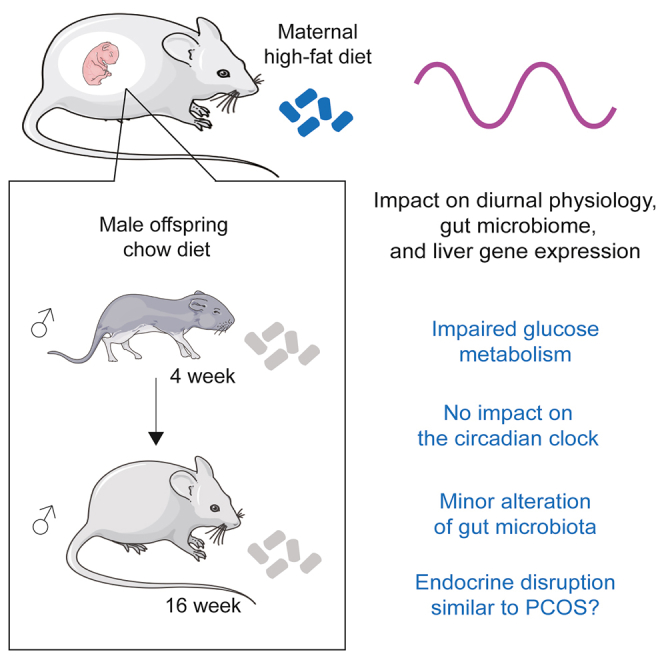
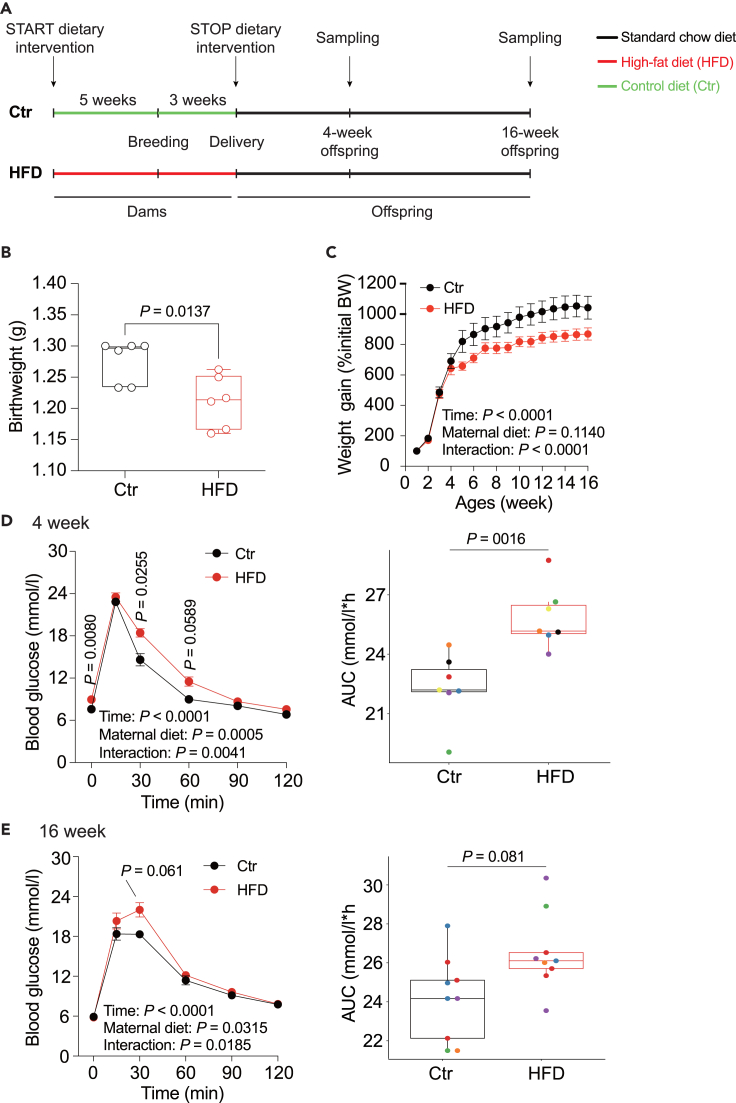
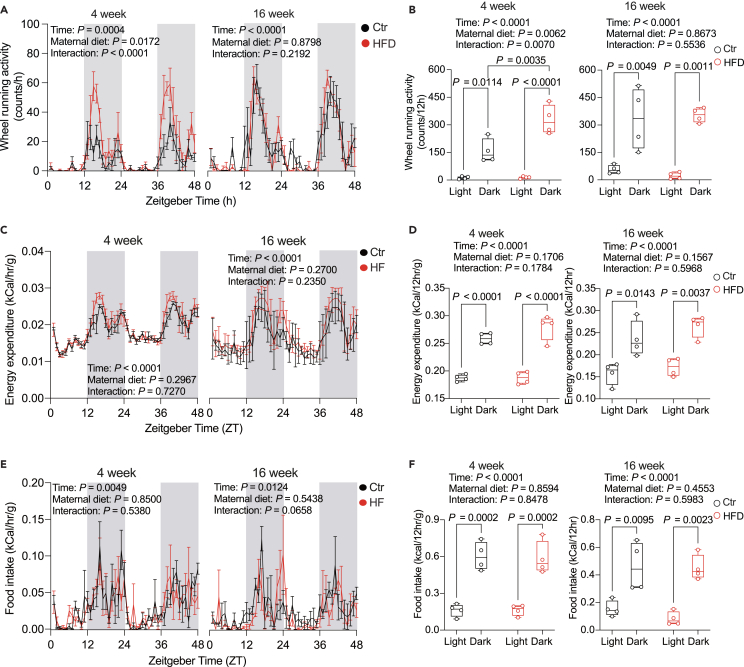
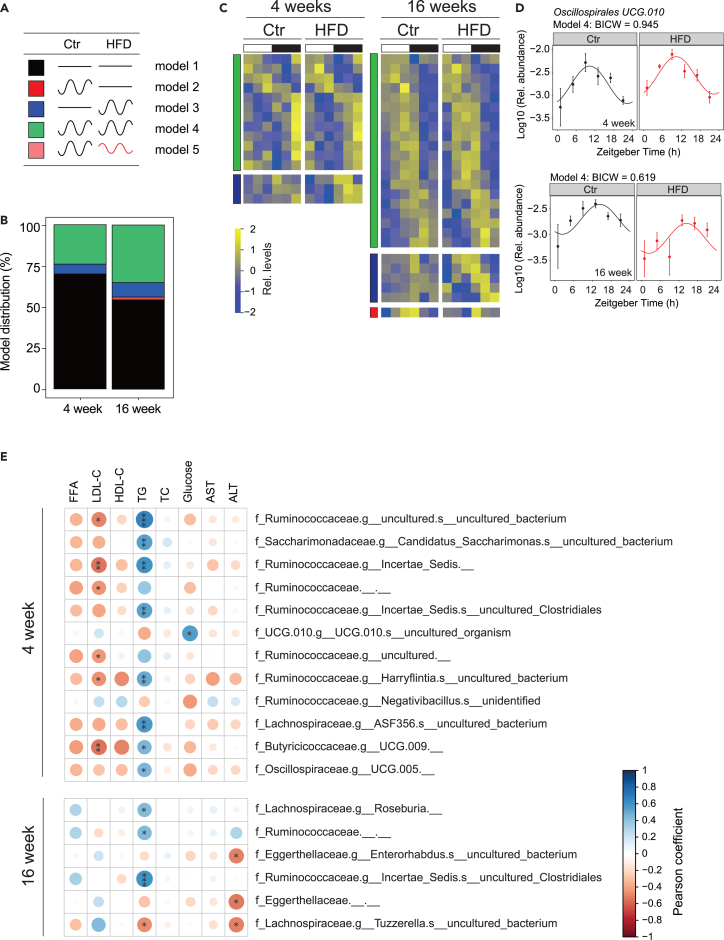
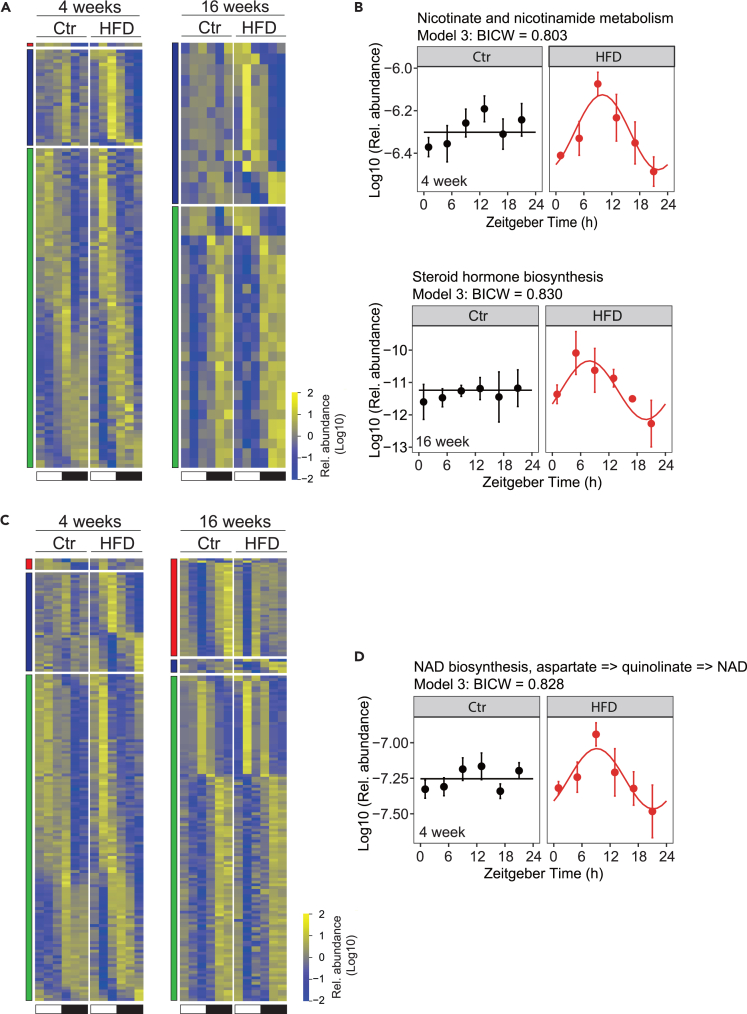
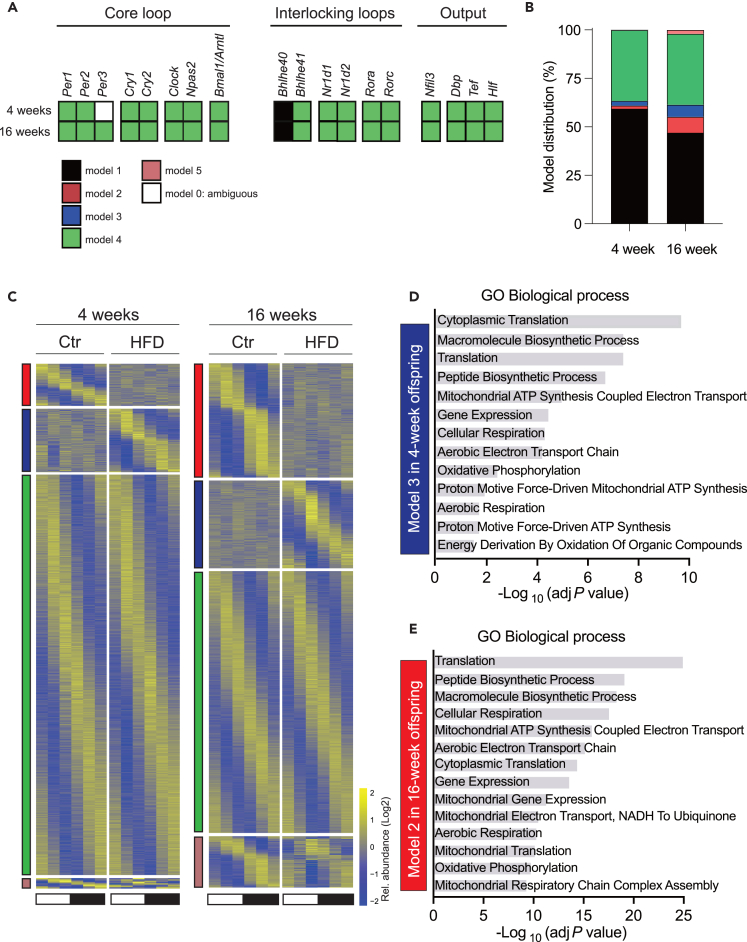
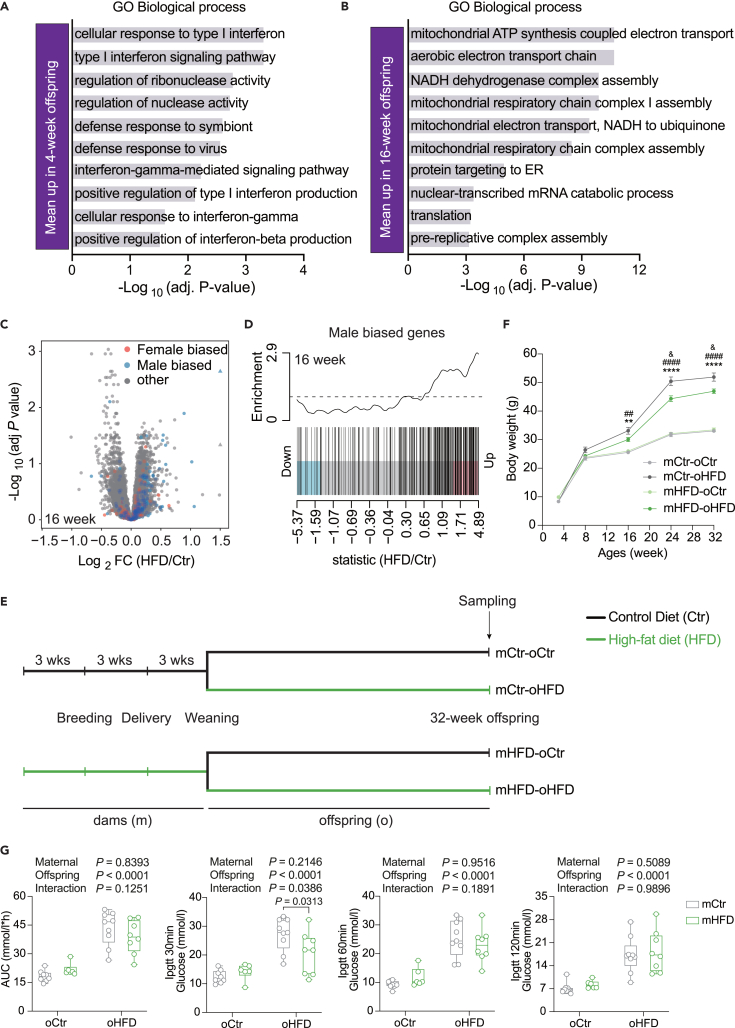
Maternal obesity has long-term effects on offspring metabolic health. Among the potential mechanisms, prior research has indicated potential disruptions in circadian rhythms and gut microbiota in the offspring. To challenge this hypothesis, we implemented a maternal high fat diet regimen before and during pregnancy, followed by a standard diet after birth. Our findings confirm that maternal obesity impacts offspring birth weight and glucose and lipid metabolisms. However, we found minimal impact on circadian rhythms and microbiota that are predominantly driven by the feeding/fasting cycle. Notably, maternal obesity altered rhythmic liver gene expression, affecting mitochondrial function and inflammatory response without disrupting the hepatic circadian clock. These changes could be explained by a masculinization of liver gene expression similar to the changes observed in polycystic ovarian syndrome. Intriguingly, such alterations seem to provide the first-generation offspring with a degree of protection against obesity when exposed to a high fat diet.

Keywords: behavioral neuroscience; molecular neuroscience; neuroscience; omics; transcriptomics.


Conflict of interest statement

Mark Morisson has received consultancy fees from Bayer Steigerwald Arzneimittelwerk (Bayer Consumer Health), Sanofi Australia, and Danone-Nutricia Australia, and serves on the science advisory board (non-remunerated) for GenieBiome, Hong Kong SAR. All other authors report no potential conflicts of interest.

Figures

None
Graphical abstract
Figure 1
Figure 1
Maternal HFD impacts glucose and cholesterol metabolism in offspring (A) Experimental setup assessing the effects of maternal HFD before and throughout pregnancy on metabolic and circadian changes in offspring. (B) Offspring birthweight. (C) Percentage change in offspring body weight throughout the study. (D and E) Glucose tolerance test (left) and the corresponding area under the curve (right, each color represents different litter) for 4-week-old offspring (D) and 16-week-old offspring (E). N = 5–6 mice (from different litters) per experimental group. All boxplots are Tukey boxplots and data is assessed with a Student’s t-test; line chart data are presented as mean ± S.E.M. and are analyzed via a repeated measure two-way ANOVA or mixed linear model followed by Šídák post hoc tests. The details of the statistical analysis results are available in Table S6. Ctr: maternal control diet (black); HFD: maternal high-fat diet (red).
Figure 2
Figure 2
Maternal HFD marginally affects diurnal food consumption and energy expenditure (A, C, and E) Diurnal rhythms of running wheel activity (A), energy expenditure (C), and food intake (E) in 4-week-old (left) and 16-week-old offspring (right). (B, D and F) Daily alterations in running wheel activity (B), energy expenditure (D), and food intake (F) in 4-week-old (left) and 16-week-old offspring (right). Zeitgeber time (ZT) indicates light entrainment periods (ZT0-12: lights on; ZT12-24: lights off). N = 4 mice (from different litters) per group. All boxplots are Tukey boxplots and line chart data are presented as mean ± S.E.M. Data are analyzed via a repeated measure two-way ANOVA followed by Šídák post hoc tests. The details of the results of the statistical analyses are available in Table S6. Ctr: maternal control diet (black); HFD: maternal high-fat diet (red).
Figure 3
Figure 3
Maternal exposure to HFD alters gut microbiome composition in offspring (A) Model selection for rhythmic ASVs in male offspring from maternal HFD and maternal Ctr groups: black line, non-rhythmic ASVs; black sinus wave: rhythmic ASVs; red sinus wave, rhythmic ASVs with different phase and/or amplitude. (B) Model distribution percentage of ASVs across models 1–5, with different colors indicating the respective model as illustrated in (A). (C) Heatmap showing rhythmic ASVs in 4-week-old (left) and 16-week-old offspring (right). Standardized relative ASV abundance is indicated in blue (low) and yellow (high). The white and black bars denote light conditions. Different color indicates the corresponding model as shown in (A). (D) Exemple of rhythmic ASV in 4-week-old (top) and 16-week-old offspring (bottom). Each dot represents the mean ASV abundance for each zeitgeber time (ZT) with the line illustrating the cosinor regression fit. The ZT defines the timing of entrainment by light (ZT0: lights on; ZT12: lights off). (E) Correlation plots based on Pearson coefficient between serum metabolic profiles and ASV abundance. Only correlations with a Pearson coefficient that had an associated Benjamini-Hochberg adjusted p-value of less than 0.05 (determined through Fisher’s Z transform) were deemed statistically significant. The details of the results of the statistical analyses are available in Table S6. Colors represent positive (blue) and negative (red) correlation. Size of the circles indicates the corresponding p-value. N = 4 mice (from different litters) per group. Ctr: maternal control diet (black); HFD: maternal high-fat diet (red).
Figure 4
Figure 4
Maternal HFD alters the functional attributes of the offspring’s gut microbiome (A and C) Heatmap for rhythmic KEGG pathway (A) and KEGG module (C) in 4-week-old offspring (left) and 16-week-old offspring (right). Standardized relative pathway/module abundance is indicated in blue (low) and yellow (high). White and black bars indicate light conditions. Different color indicates the corresponding model as shown in Figure 3A. (B) Nicotinate and nicotinamide metabolism pathway in 4-week-old (top) and steroid hormone biosynthesis pathway in 16-week-old offspring (bottom). (D) NAD+ biosynthesis module in 4-week-old offspring. The dots mark values of inferred functional activity for each zeitgeber time (ZT) with the line illustrating the cosinor regression fit. The ZT defines the timing of entrainment by light (ZT0: lights on; ZT12: lights off). N = 3 mice (from different litters) per group. Ctr: maternal control diet (black); HFD: maternal high-fat diet (red).
Figure 5
Figure 5
Impact of maternal HFD on rhythmic liver gene expression (A) Hepatic circadian clock genes show an unaltered temporal expression profile under maternal HFD, with most genes assigned to model 4. (B) Model distribution percentage of genes in model 1–5. Different color indicates the corresponding model as shown in (A). (C) Heatmap for rhythmic genes in 4-week-old offspring (left) and 16-week-old offspring (right). Standardized relative gene expression is indicated in blue (low) and yellow (high). White and black bars indicate light conditions. Different color indicates the corresponding model as shown in (A). (D and E) Enrichment of GO biological process for genes in model 3 in 4-week-old offspring (D) and in model 2 in 16-week-old offspring (E). N = 2–3 mice (from different litters) per group. Ctr: maternal control diet (black); HFD: maternal high-fat diet (red).
Figure 6
Figure 6
Differential gene expression in offspring exposed to maternal HFD (A and B) GO enrichment analysis of hepatic genes showing a mean increase in expression in 4-week-old (A) and 16-week-old offspring upon maternal HFD (B). (C) Volcano plots illustrating sex-biased differentially expressed genes in the livers of 16-week-old offspring upon maternal HFD. (D) Barcode plots for male-biased genes in the liver of 16-week-old offspring with genes ordered from most down to most upregulated. (E) Experimental design of Zheng et al. (F) Changes in offspring bodyweight from 4 to 32 weeks of age. (G) Area under the curve for the glucose tolerance test and blood glucose levels at 30-, 60-, and 120-min post-glucose load (2 g/kg) in 32-week-old offspring. N = 2–3 mice (from different litters) per group. All boxplots are Tukey boxplots and line chart data are presented as mean ± S.E.M. Data are analyzed via two-way ANOVA followed by Holm-Šídák post hoc tests. The details of the results of the statistical analyses are available in Table S6. ∗∗p < 0.05 and ∗∗∗∗p < 0.0001, mHF-oHF vs. mHF-oCtr; ##p < 0.01 and ####p < 0.0001, mCtr-oHF vs. mCtr-oCtr; & p < 0.05, mCtr-oHF vs. mHF-oHF. mCtr, maternal control diet; mHFD, maternal high-fat diet; oCtr, offspring control diet; oHFD, offspring high-fat diet.

Similar articles

References

    1. Driscoll A.K., Gregory E.C.W. NCHS Data Brief; 2020. Increases in Prepregnancy Obesity: United States, 2016-2019; pp. 1–8. - PubMed
    1. Hales C.M., Carroll M.D., Fryar C.D., Ogden C.L. NCHS Data Brief; 2020. Prevalence of Obesity and Severe Obesity Among Adults: United States, 2017-2018; pp. 1–8. - PubMed
    1. Fernandez-Twinn D.S., Hjort L., Novakovic B., Ozanne S.E., Saffery R. Intrauterine programming of obesity and type 2 diabetes. Diabetologia. 2019;62:1789–1801. doi: 10.1007/s00125-019-4951-9. - DOI - PMC - PubMed
    1. Godfrey K.M., Reynolds R.M., Prescott S.L., Nyirenda M., Jaddoe V.W.V., Eriksson J.G., Broekman B.F.P. Influence of maternal obesity on the long-term health of offspring. Lancet Diabetes Endocrinol. 2017;5:53–64. doi: 10.1016/s2213-8587(16)30107-3. - DOI - PMC - PubMed
    1. Poston L., Harthoorn L.F., van der Beek E.M., Contributors to the ILSI Europe Workshop Obesity in Pregnancy: Implications for the Mother and Lifelong Health of the Child. A Consensus Statement. Pediatr. Res. 2011;69:175–180. doi: 10.1203/PDR.0b013e3182055ede. - DOI - PubMed