Review
. 2024 Jul;21(216):20240009.
doi: 10.1098/rsif.2024.0009. Epub 2024 Jul 24.

Symptom propagation in respiratory pathogens of public health concern: a review of the evidence

Affiliations
Review

Symptom propagation in respiratory pathogens of public health concern: a review of the evidence

Phoebe Asplin et al. J R Soc Interface. 2024 Jul.

Abstract

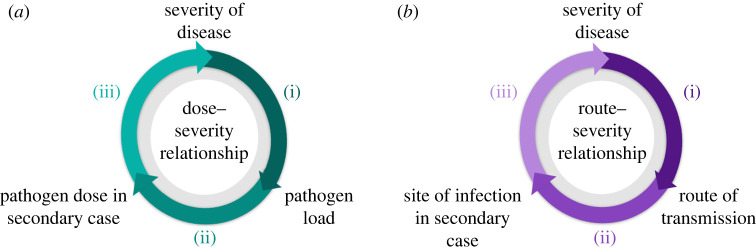
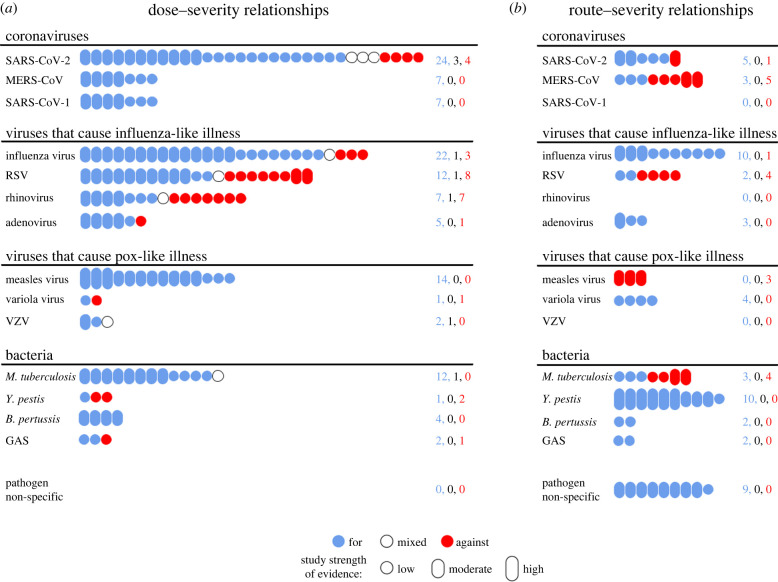
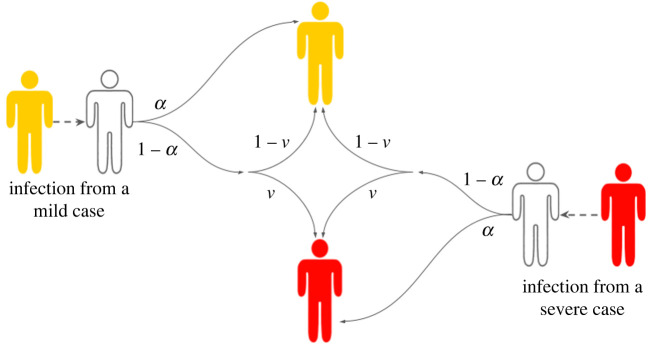
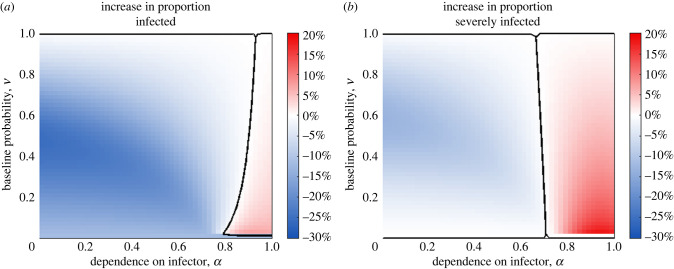
Symptom propagation occurs when the symptom set an individual experiences is correlated with the symptom set of the individual who infected them. Symptom propagation may dramatically affect epidemiological outcomes, potentially causing clusters of severe disease. Conversely, it could result in chains of mild infection, generating widespread immunity with minimal cost to public health. Despite accumulating evidence that symptom propagation occurs for many respiratory pathogens, the underlying mechanisms are not well understood. Here, we conducted a scoping literature review for 14 respiratory pathogens to ascertain the extent of evidence for symptom propagation by two mechanisms: dose-severity relationships and route-severity relationships. We identify considerable heterogeneity between pathogens in the relative importance of the two mechanisms, highlighting the importance of pathogen-specific investigations. For almost all pathogens, including influenza and SARS-CoV-2, we found support for at least one of the two mechanisms. For some pathogens, including influenza, we found convincing evidence that both mechanisms contribute to symptom propagation. Furthermore, infectious disease models traditionally do not include symptom propagation. We summarize the present state of modelling advancements to address the methodological gap. We then investigate a simplified disease outbreak scenario, finding that under strong symptom propagation, isolating mildly infected individuals can have negative epidemiological implications.

Keywords: SARS-CoV-2; influenza; mathematical modelling; respiratory pathogens; symptom propagation; symptom severity.


Conflict of interest statement

We declare we have no competing interests.

Figures

Figure 1.
Figure 1.
Cycle diagrams depicting two symptom propagation mechanisms: dose–severity relationships and route–severity relationships. (a) A dose–severity relationship arises when (i) an individual’s disease severity determines their pathogen load; (ii) pathogen load affects the infectious dose with which they infect others; (iii) this infectious dose then determines the disease severity in the secondary case. (b) A route–severity relationship arises when (i) an individual’s disease severity determines the transmission route through which they infect others; (ii) the transmission route then determines the site of infection in the secondary case; (iii) the site of infection then affects their disease severity.
Figure 2.
Figure 2.
Infographic depicting the number of relevant studies found for each pathogen for the two symptom propagation mechanisms. The number of relevant studies found for each pathogen relating to (a) dose–severity relationships or (b) route–severity relationships. Colour denotes whether the study was supportive (blue) or against (red) the hypothesis, with mixed studies (white) containing findings that were both for and against or not clearly either (counts of the numbers of papers in each category are provided on the right). Bubble height denotes our classification of strength of evidence: high—a study directly investigating symptom propagation with significant findings; moderate—a study strongly related to part of the mechanism with significant findings; low—a study with either non-significant findings, or that is more weakly related to part of the mechanism. All studies are listed in the summary tables with their corresponding strength of evidence ratings (see electronic supplementary material, S2). Pathogens are grouped by the type.
Figure 3.
Figure 3.
Dependence of symptom severity on α and ν (in the absence of interventions). White shaded individuals correspond to those susceptible to infection, yellow shaded individuals correspond to infectious cases with mild severity and red shaded individuals correspond to infectious cases with severe symptoms. The values on the arrows show the corresponding probability. An infected individual has probability α of copying the symptom severity of their infector and a probability 1 − α of reverting to the baseline probability of having severe disease, i.e. they develop severe disease with probability ν.
Figure 4.
Figure 4.
Investigating the effect of α and ν on the number of total cases and severe cases prevented by additionally isolating mild cases. (a) The difference between the overall number of cases when isolating 50% of severe cases only and the overall number of cases when isolating 50% of all cases (severe and mild). (b) The difference between the number of severe cases when isolating 50% of severe cases only and the number of severe cases when isolating 50% of all cases (severe and mild). Shading denotes the cases prevented (as a percentage of the population): blue denotes values where isolating mild cases decreased the number of cases; red denotes values where isolating mild cases increased the number of cases. Black solid lines represent parameter combinations where no cases were prevented by additionally isolating mild cases.

Similar articles

Cited by

References

    1. World Health Organisation. 2023. WHO Mortality Database. See https://platform.who.int/mortality/themes/theme-details/topics/topic-det... (accessed 4 January 2024).
    1. Dennis DT, Gage KL, Gratz N, Poland JD, Tikhomirov E. 1999. Plague manual: epidemiology, distribution, surveillance and control. Geneva, Switzerland: World Health Organisation.
    1. Tellier R. 2006. Review of aerosol transmission of influenza A virus. Emerg. Infect. Dis. 12, 1657-1662. (10.3201/eid1211.060426) - DOI - PMC - PubMed
    1. Van Damme W, Dahake R, van de Pas R, Vanham G, Assefa Y. 2021. COVID-19: does the infectious inoculum dose–response relationship contribute to understanding heterogeneity in disease severity and transmission dynamics? Med. Hypotheses 146, 110431. (10.1016/j.mehy.2020.110431) - DOI - PMC - PubMed
    1. Domingo JL. 2021. What we know and what we need to know about the origin of SARS-CoV-2. Environ. Res. 200, 111785. (10.1016/j.envres.2021.111785) - DOI - PMC - PubMed

LinkOut - more resources