. 2024 Sep 3;36(9):3875-3893.
doi: 10.1093/plcell/koae212.

Strigolactone-induced degradation of SMXL7 and SMXL8 contributes to gibberellin- and auxin-mediated fiber cell elongation in cotton

Affiliations

Strigolactone-induced degradation of SMXL7 and SMXL8 contributes to gibberellin- and auxin-mediated fiber cell elongation in cotton

Yaru Sun et al. Plant Cell. .

Abstract

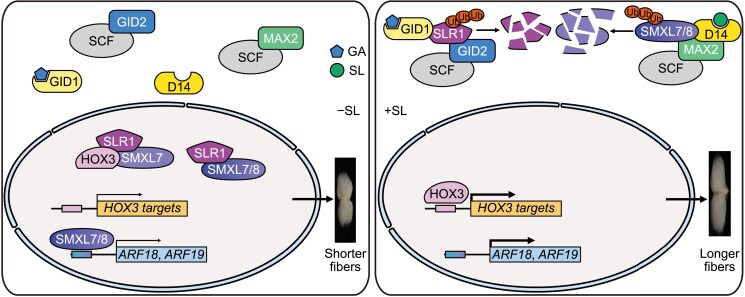
Cotton (Gossypium) fiber length, a key trait determining fiber yield and quality, is highly regulated by a class of recently identified phytohormones, strigolactones (SLs). However, the underlying molecular mechanisms of SL signaling involved in fiber cell development are largely unknown. Here, we show that the SL signaling repressors MORE AXILLARY GROWTH2-LIKE7 (GhSMXL7) and GhSMXL8 negatively regulate cotton fiber elongation. Specifically, GhSMXL7 and GhSMXL8 inhibit the polyubiquitination and degradation of the gibberellin (GA)-triggered DELLA protein (GhSLR1). Biochemical analysis revealed that GhSMXL7 and GhSMXL8 physically interact with GhSLR1, which interferes with the association of GhSLR1 with the E3 ligase GA INSENSITIVE2 (GhGID2), leading to the repression of GA signal transduction. GhSMXL7 also interacts with the transcription factor GhHOX3, preventing its binding to the promoters of essential fiber elongation regulatory genes. Moreover, both GhSMXL7 and GhSMXL8 directly bind to the promoter regions of the AUXIN RESPONSE FACTOR (ARF) genes GhARF18-10A, GhARF18-10D, and GhARF19-7D to suppress their expression. Cotton plants in which GhARF18-10A, GhARF18-10D, and GhARF19-7D transcript levels had been reduced by virus-induced gene silencing (VIGS) displayed reduced fiber length compared with control plants. Collectively, our findings reveal a mechanism illustrating how SL integrates GA and auxin signaling to coordinately regulate plant cell elongation at the single-cell level.


Conflict of interest statement

Conflict of interest statement. The authors declare no competing interests.

Figures

Figure 1.
Figure 1.
SL regulates GA-induced GhSLR1 degradation. A) The expression level of GhSLR1 in 10 DPA fibers from WT and GhSLR1-OE plants. GhUBQ7 was used as the internal control. Data are represented as the mean ± Sd (n = 3). Asterisks represent significant difference determined by Student's t test. ***P < 0.001. B) Immunoblotting analysis of Myc-GhSLR1 protein levels in 10 DPA fibers from WT and GhSLR1-OE lines. Actin was used as the internal control. C) Sanger sequencing-based genotyping of Ghslr1 mutant obtained by CRISPR/Cas9. Nucleotide deletions were denoted by blue dashes, while PAM sites were highlighted with yellow shadows. D) Images of mature fibers from WT, GhSLR1-OE, and Ghslr1 transgenic plants (T2 generation). Bar = 1 cm. E) Statistical analysis of mature fibers from WT, GhSLR1-OE, and Ghslr1 transgenic plants. Data are represented as the mean ± Sd (n > 10). Asterisks represent significant difference determined by Student's t test. ***P < 0.001, *P < 0.05, ***P < 0.001. F, G) GR24 and Tis108 mediate GA3-induced GhSLR1 degradation. GhSLR1-OE ovules were cultured in BT medium for 10 days, following treatment with 15 μM GR24, 10 μM Tis108, 1 μM GA3, 1 μM GA3 + 15 μM GR24, 1 μM GA3 + 10 μM Tis108, or equal volume of ethanol (Mock) for the indicated time. Total proteins were extracted and subjected to immunoblot analysis. Representative immunoblot results with the relative protein level of Myc-GhSLR1 are shown in (F), with quantitative analysis in (G). Data are represented as the mean ± Sd (n = 3). H) Effects of Tis108 dose on GA-induced GhSLR1 degradation. GhSLR1-OE ovules were grown in BT medium for 10 days and then treatment with 1 μM GA3 and different concentrations of Tis108. I) In vivo degradation assay showing the effect of KAR1 on GA3-induced GhSLR1 degradation. GhSLR1-OE ovules were grown in BT medium for 10 days and then treatment with 40 μM KAR1, 1 μM GA3, 1 μM GA3 + 40 μM KAR1 or equal volume of ethanol (Mock) for the indicated time. The immunoblot results in (H) and (I) were quantified using ImageJ software. The intensity values of control samples were set to 1.0. Relative band intensities are shown below each lane.
Figure 2.
Figure 2.
GhSMXL7 and GhSMXL8 interact with GhSLR1. A) Y2H assay showing the interactions of GhSLR1 with GhSMXL7 and GhSMXL8. The transformed yeast cells were grown on SD-Leu/Trp (DDO) medium and SD-Leu/Trp/His/Ade (QDO) medium. B, C) LCI assay for GhSLR1-GhSMXL7/8 interactions. GhSLR1 and GhSMXL7/8 were fused with N- and C-terminal of luciferase protein, respectively. D) BiFC assay showing the interaction of GhSLR1 with GhSMXL7 and GhSMXL8. No signal was observed for the negative controls in which GhSMXL7-nYFP and GhSMXL8-nYFP were co-expressed with GhSLR11–100-cYFP (the amino acid sequence encoding the N-terminal part of GhSLR1 fused with cYFP). Bars = 50 μm. E) Co-IP analysis showing the interaction between GhSLR1 and GhSMXL7/8 using a transient expression system in Nicotiana benthamiana leaves. GhSMXL7/8-GFP and Myc-GhSLR1 constructs were transiently expressed in N. benthamiana. The GFP protein was used as a negative control. F) Co-IP assay in transgenic plants. The total protein extracts from GhSMXL7-Flag-OE, GhSMXL8-Flag-OE, Myc-GhSLR1-OE, Myc-GhSLR-OE × GhSMXL7-Flag-OE, and Myc-GhSLR1-OE × GhSMXL8-Flag-OE cotton fibers (5 DPA) were immunoprecipitated with GFP agarose beads, followed by immunoblotting analysis using anti-GFP or anti-Myc antibodies. G) Pull-down assay showing the physical interactions between GhSLR1 and GhSMXL7/8. The recombinant GST, GST-GhSMXL7, or GST-GhSMXL8 protein coupled with GST beads were incubated with equal amount of His-GhSLR1 protein. After washing, the GST beads were subjected to immunoblotting analysis. H, I) LCI assays showing that the C-terminal GRAS domain of GhSLR1 is essential for the interactions of GhSLR1 with GhSMXL7 (H) and GhSMXL8 (I).
Figure 3.
Figure 3.
GhSMXL7 and GhSMXL8 inhibit the GA-induced GhSLR1 degradation. A) Images of mature fibers from WT, GhSMXL7-OE, GhSMXL8-OE, Ghsmxl7, Ghsmxl8 (T2 generations), and Ghsmxl7×Ghsmxl8 (F2) double mutant plants. Bar = 1 cm. B) Fiber length data analysis of mature fibers shown in (A). Data are represented as the mean ± Sd (n > 10). Asterisks represent significant difference determined by Student's t test. **P < 0.01; ***P < 0.001. ns, no significant difference. C) Phenotypes of fibers (collected at +1 DPA) cultured in vitro with 1 μM GA3 or 15 μM GR24 for 10 days. Bar = 1 cm. D) Statistical analysis of fiber length in (C). Data are represented as the mean ± Sd (n > 10). Different letters at top of each column indicate a significant difference at P < 0.05 determined by one-way ANOVA multiple comparisons. E) Levels of GhSMXL7-Flag and GhSMXL8-Flag proteins in transgenic fibers after treatment with 15 μM GR24 for 48 h. Proteins were detected by immunoblotting with anti-Flag antibody. Actin was used as internal control. F) The protein levels of Myc-GhSLR1 in GhSLR1-OE, GhSLR1-OE × GhSMXL7-OE, GhSLR1-OE × GhSMXL7-OE fibers treated with GA3 alone or together with GR24 for 12 h. G) The protein levels of GhSLR1 in WT and Ghsmxl7×Ghsmxl8 fibers treated with GA3 for the indicated times. H) Relative protein levels of GA3-induced degradation of Myc-GhSLR1 shown in (G) as mean ± Sd (n = 3). I) Images of mature fibers from WT, Ghslr1, Ghsmxl7/Ghsmxl8 (F2), and Ghsmxl7/Ghsmxl8/Ghslr1 (T2) mutant plants. Bar = 1 cm. J) Fiber length data analysis of mature fibers shown in (I). Data are represented as the mean ± Sd (n > 10). Different letters at top of each column indicate a significant difference at P < 0.05 determined by one-way ANOVA multiple comparisons.
Figure 4.
Figure 4.
GhSMXL7 and GhSMXL8 disrupt the GhGID2-GhSLR1 interaction to inhibit GhSLR1 polyubiquitination and degradation. A) Images of mature fibers from WT, GhGID2-OE (T3 generation), and Ghgid2 (T3 generation) transgenic plants. Bar = 1 cm. B) Statistical analysis of mature fibers from WT, GhSLR1-OE, and Ghgid2 transgenic plants. Data are represented as the mean ± Sd (n > 10). Different letters at top of each column indicate a significant difference at P < 0.05 determined by one-way ANOVA multiple comparisons. C) Co-IP assay in cotton protoplasts. GhSLR1-YFP and GhGID2-Flag were transiently expressed in the protoplasts. The total protein extracts were immunoprecipitated with GFP beads, followed by immunoblotting analysis using anti-GFP or anti-Flag antibodies. The YFP protein was used as a negative control. D) Co-IP assay showing that GA3 promotes the interaction of GhGID2 with GhSLR1 in a dosage-dependent manner in cotton protoplasts. E) Semi-in vitro ubiquitination assay showing that GhGID2 promotes the polyubiquitination level of GhSLR1. The purified His-GhSLR1 protein coupled with Ni-agarose was incubated with total protein extracts of fibers from WT GhGID2-OE, and Ghgid2 plants and treated with 1 μM GA3 and 100 μM MG132. After washing, the polyubiquitination of GhSLR1 was detected by immunoblotting with an anti-Ubiquitin antibody. F) Polyubiquitination of GhSLR1 by GhGID2 in cotton protoplasts. GhGID2-YFP and Myc-GhSLR1 constructs were co-transfected into cotton protoplasts in the presence of 1 μM GA3 and 50 μM MG132. The Myc-GhSLR1 protein was immunoprecipitated using an anti-Myc antibody, followed by immunoblotting analysis using an anti-Ubiquitin antibody. G) In vitro degradation assay. Myc-GhSLR1 protein was incubated with total protein extracts from 10 DPA fibers for indicated times, followed by immunoblotting analysis using an anti-Myc antibody. H) In vivo degradation assay in cotton protoplasts. Indicated amounts of GhGID2-Flag, Myc-GhSLR1, and YFP-Flag plasmids were transfected into cotton protoplasts and allowed to be expressed for 16 h at 28 °C. Total protein was extracted and subjected to immunoblotting analysis using anti-Myc, anti-Flag, anti-GFP, and anti-Actin antibodies. Actin was used as the internal control. I) LCI assays showing that GhSMXL7 and GhSMXL8 prevents the interaction between GhGID2 and GhSLR1 in Nicotiana benthamiana leaves. J) Immunoblot assay showing the accumulation of related proteins in (I). GUS-GFP protein was used as the negative control, and GhSMXL7/8-GFP proteins were used as the competitors. K) Quantification of luciferase activity for the samples in (I). LUC signals were collected by a luminescent imaging workstation (Tanon 5200 Chemiluminescence image analysis system). Data are represented as the mean ± Sd (n = 3). Asterisks represent significant difference determined by Student's t test. *** P < 0.001. L) Cell-free GST pull-down assay showing that GhSMXL7 and GhSMXL8 repress the interaction of GhGID2 with GhSLR1. GST-GhGID2 protein (right four lanes) was used as a bait and incubated total protein extracts from WT, GhSLR1-OE, GhSLR1-OE × GhSMXL7-OE, and GhSLR1-OE × GhSMXL8-OE cotton fibers (10 DPA), respectively. GST protein (left four lanes) was used as the negative control. M) Co-IP assay showing that GhSMXL7 and GhSMXL8 repress the interaction of GhGID2 with GhSLR1 in cotton protoplasts. GhGID2-Flag, Myc-GhSLR1, together with GhSMXL7-YFP, GhSMXL8-YFP, or YFP, were transiently co-expressed in cotton protoplasts. Total protein was extracted and followed by immunoprecipitation with anti-Flag antibody. The Myc-GhSLR1 protein was detected by immunoblotting with an anti-Myc antibody. N) In vivo ubiquitination assay showing the inhibition of GhSMXL7 and GhSMXL8 on GhGID2-mediated GhSLR1 degradation in GhSLR1-OE cotton protoplasts in the presence of 1 μM GA3. O) In vivo degradation assay showing the effect of GhSMXL7 and GhSMXL8 on GhGID2-mediated GhSLR1 degradation in GhSLR1-OE protoplasts. These constructs were co-transfected into GhSLR1-OE protoplasts. After cultured for 12 h, following treated with 1 μM GA3 and 200 mm CHX for the indicated times. Representative immunoblots with the relative protein level of GhSLR1 in (E to H, N, O) are shown below each line and the levels at control was set to 1.0. The protein level of GhSLR1 was quantified with Image J software.
Figure 5.
Figure 5.
GhSMXL7 interferes with the binding of GhHOX3 to the targets. A) Y2H assay showing the interaction of GhSMXL7 with GhHOX3. B) LCI assay showing the interaction between GhSMXL7 and GhHOX3 in Nicotiana benthamiana leaves. C) Co-IP assay showing the interaction between GhSMXL7 and GhHOX3 using a transient expression system in Nicotiana benthamiana leaves. D, E) EMSA showing that the GhSMXL7-GhHOX3 interaction attenuated the DNA-binding activity of GhHOX3 to GhRDL1 and GhEXPA1 promoters. F, G) Transient expression assays and quantitative analysis of luciferase activity showing that GhSMXL7 inhibits the transactivation activity of GhHOX3 on the LUC reporter gene driven by the GhRDL1 promoter (F) and GhEXPA1 promoter (G). Renilla luciferase (REN) was used as the internal control. H, I) GR24 eliminates the repressive effect of GhSMXL7 on the transactivation activity of GhRDL1 (H) and GhEXPA1 (I). Data in (F to I) are represented as the mean ± Sd (n = 3). Asterisks represent significant difference determined by Student's t test. **P < 0.01, ***P < 0.001. ns indicates no significant difference. J) RT-qPCR and immunoblotting analysis of relative GhSLR1 transcript and protein levels in 10 DPA fibers from WT, Ghslr1, Ghsmxl7/Ghsmxl8, and GhHOX3 silenced plants. Data are represented as the mean ± Sd (n = 3). K) Representative images and statistical analysis of mature fibers from WT, Ghslr1, Ghsmxl7/Ghsmxl8, and GhHOX3 silenced plants. Data are represented as the mean ± Sd (n > 10). Different letters at top of each column indicate a significant difference at P < 0.05 determined by one-way ANOVA multiple comparisons. L, M) RT-qPCR analysis of GhRDL1 and GhEXPA1 transcripts in 10 DPA fibers from WT, Ghslr1, Ghsmxl7/Ghsmxl8, and GhHOX3 silenced plants. Data are represented as the mean ± Sd (n > 10). Different letters at top of each column indicate a significant difference at P < 0.05 determined by one-way ANOVA multiple comparisons.
Figure 6.
Figure 6.
SL regulates the auxin-mediated fiber elongation through the transcriptional repression of GhARFs by GhSMXL7 and GhSMXL8. A) Phenotypes of fibers cultured in BT medium for 10 days with 15 μM GR24, 10 μM Tis108, 5 μM IAA, 10 μM NPA, 15 μM GR24 + 10 μM NPA, or 5 μM IAA + 10 μM Tis108. B) Statistical analysis of fiber length in A). Data are represented as the mean ± Sd (n > 10). C) IAA contents in untreated fibers (Mock) and fibers treated with 15 μM GR24 or 10 μM Tis108. Data are represented as the mean ± Sd (n = 3). ns, no significant difference. D)epi-5DS contents in fibers after treatment with 5 μM IAA or 10 μM NPA for 10 days. Data are represented as the mean ± Sd (n = 3). ns, no significant difference. E) Heatmap representation of the GhARF genes up-regulated by GR24 and down-regulated by Tis108 in fibers. F) Y1H assays showing the binding of GhSMXL7 and GhSMXL8 to the GhARF18-10A, GhARF18-10D, and GhARF19-7D promoters. G to I) Schematic diagrams illustrating the truncated DNA fragment of GhARF18-10A (G), GhARF18-10D (H), and GhARF19-7D (I) promoters. The green bars indicate ATAACAA elements. J to L) Y1H assays showing the binding of GhSMXL7 and GhSMXL8 to GhARF18-10A (J), GhARF18-10D (K), and GhARF19-7D (L) promoter fragments. JG, empty pJG-45 vector without inserted transcription factors. M to R) Transient expression assay showing the transcriptional repression effects of GhSMXL7 and GhSMXL8 on the LUC reporter genes driven by the GhARF18-10A (M, N), GhARF18-10D (O, P), and GhARF19-7D (Q, R) promoters. 62sk empty vector was used as the negative control. S to X) EMSA showing the direct physical binding of GhSMXL7 and GhSMXL8 to GhARF18-10A (S, T), GhARF18-10D (U, V), and GhARF19-7D (W, X) promoters. The purified GST-GhSMXL7 and GST-GhSMXL8 proteins were incubated with the biotin-labeled DNA probes. Y, Z) ChIP-qPCR assay showing GhSMXL7 (Y) and GhSMXL8 (Z) binding to the GhARF18-10A, GhARF18-10D, and GhARF19-7D promoters in vivo. Five-day-old fibers from GhSMXL7-OE and GhSMXL8-OE plants were collected for the ChIP assay. DNA fragments immunoprecipitated using anti-Flag antibody were subjected to qPCR. Data in (Y) and (Z) are represented as the mean ± Sd (n = 3). Asterisks represent significant difference determined by Student's t test. *P < 0.05, **P < 0.01, ***P < 0.001.
Figure 7.
Figure 7.
Schematic model depicting the function of GhSMXL7 and GhSMXL8 in regulating fiber cell elongation. In the absence of SL (left), the stabilized GhSMXL7 and GhSMXL8 compete with GhGID2 to interact with GhSLR1 to inhibit its degradation, thereby repressing GA signaling. At the same time, GhSLR1 and GhSMXL7 bind with the transcription factor GhHOX3 to inhibit its DNA-binding activity, leading to the repression of the expression of HOX3-targeted genes, such as GhRDL1 and GhEXPA1. In addition, GhSMXL7 and GhSMXL8 function as transcriptional repressors to further inhibit the expression of GhARF18-10A/D and GhARF19-7D. Under SL supply (right), SL triggers the ubiquitination and degradation of GhSMXL7/8 to abolish their interactions with GhSLR1, and then GA destabilizes GhSLR1. GhHOX3 are released from the repression of GhSLR1 and GhSMXL7 and are capable of binding to upstream genes. The degradation of GhSMXL7/8 eliminates the transcriptional inhibition of GhARF18-10A/D and GhARF19-7D, which are in turn activated by auxin, finally promoting fiber cell elongation.

Similar articles

Cited by

References

    1. Alder A, Jamil M, Marzorati M, Bruno M, Vermathen M, Bigler P, Ghisla S, Bouwmeester H, Beyer P, Al-Babili S. The path from β-carotene to carlactone, a strigolactone-like plant hormone. Science. 2012:335(6074):1348–1351. 10.1126/science.1218094 - DOI - PubMed
    1. Asami T. Toward the next step to the new green revolution. Mol Plant. 2023:16(5):802–803. 10.1016/j.molp.2023.03.014 - DOI - PubMed
    1. Bennett T, Leyser O. Strigolactone signalling: standing on the shoulders of DWARFs. Curr Opin Plant Biol. 2014:22:7–13. 10.1016/j.pbi.2014.08.001 - DOI - PubMed
    1. Bennett T, Liang Y, Seale M, Ward S, Müller D, Leyser O. Strigolactone regulates shoot development through a core signalling pathway. Biol Open. 2016:5(12):1806–1820. 10.1242/bio.021402 - DOI - PMC - PubMed
    1. Brewer PB, Dun EA, Ferguson BJ, Rameau C, Beveridge CA. Strigolactone acts downstream of auxin to regulate bud outgrowth in pea and Arabidopsis. Plant Physiol. 2009:150(1):482–493. 10.1104/pp.108.134783 - DOI - PMC - PubMed

MeSH terms

LinkOut - more resources