. 2024 Aug 7;16(31):40611-40627.
doi: 10.1021/acsami.4c07173. Epub 2024 Jul 24.

Photothermal Temperature-Modulated Cancer Metastasis Harnessed Using Proteinase-Triggered Assembly of Near-Infrared II Photoacoustic/Photothermal Nanotheranostics

Affiliations

Photothermal Temperature-Modulated Cancer Metastasis Harnessed Using Proteinase-Triggered Assembly of Near-Infrared II Photoacoustic/Photothermal Nanotheranostics

Yao-Chen Chuang et al. ACS Appl Mater Interfaces. .

Abstract

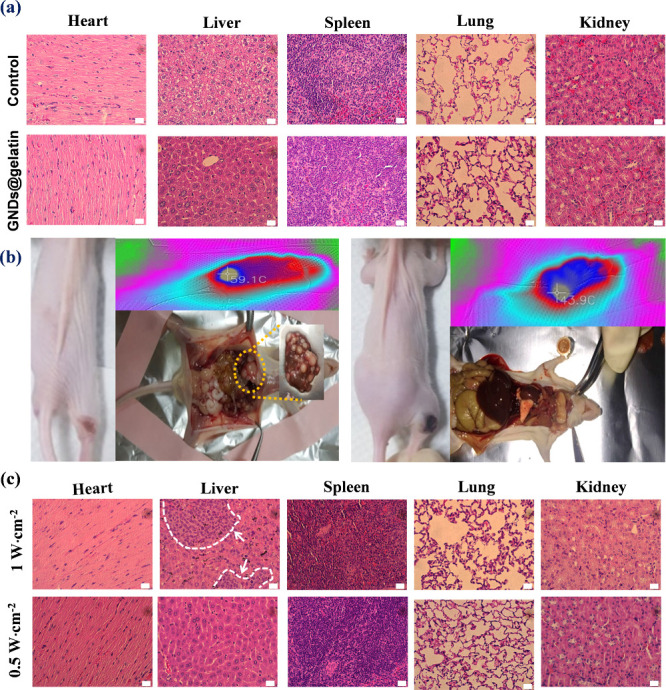
Here we demonstrate that cancer metastasis could be modulated by the judicious tuning of physical parameters such as photothermal temperature in nanoparticle-mediated photothermal therapy (PTT). This is supported by theranostic nanosystem design and characterization, in vitro and in vivo analyses, and transcriptome-based gene profiling. In this work, the highly efficient near-infrared II (NIR-II) photoacoustic image (PA)-guided PTT are selectively activated using our developed matrix metalloproteinase (MMP)-triggered in situ assembly of gold nanodandelions (GNDs@gelatin). Unlike other "always-on" NIR PTT agents lacking specific bioactivation and suffering from the intrinsic nonspecific pseudosignals and treatment-related side effects such as metastasis, our GNDs@gelatin possesses important advantages while deployed in cancer PTT that include the following: (1) The theranostic effects could be "turned on" only after specific MMP-2/-9 activity and with acidity in the tumor microenvironment. (2) The quantitative PA diagnosis allows for precise PTT planning for better cancer treatment. (3) GNDs@gelatin could noninvasively quantify MMP activity and efficiently harness NIR-I (808 nm) and NIR-II (1064 nm) energies for tumor ablation. (4) The multibranched nanostructures reabsorb scattered laser photons, thus enhancing the surface plasmons for the pronounced photothermal conversion of aggregated GNDs@gelatin in situ. (5) It is noteworthy that in situ tumor eradication at higher PTT temperature (>55 °C) mediated by GNDs@gelatin could induce subsequent metastasis, which could be otherwise abolished at lower PTT temperatures (50 °C > T > 43 °C). (6) Furthermore, the gene profiling using transcriptome-based microarray including GO and KEGG analyses revealed that 315 differentially expressed genes were identified in higher PTT temperature treated tumors compared with lower PTT temperature ones. These were enriched into some well-known cancer-related pathways, such as cell migration pathway, signal transductions, cell proliferation, wound healing, PPAR signaling, and metabolic pathways. These observations suggest a new perspective of "moderate-is-better" in nanoparticle-mediated PTT for maximizing its therapeutic/prognosis benefits and translational potential with metastasis inhibition.

Keywords: gold nanodandelions; matrix metalloproteinases; metastasis; near-infrared window I and II; photoacoustic imaging; plasmonic photothermal therapy.


Conflict of interest statement

The authors declare no competing financial interest.

Figures

Figure 1
Figure 1
MMPs-triggered and pH enhanced self-assembly of GNDs@gelatin. (a–d) UV–vis–NIR spectra of untreated GNDs@gelatin at pH 7.5, 7.0, 6.5, and 5.5 after different incubation times. (e–h) UV–vis–NIR spectra of MMP-2 treated GNDs@gelatin at pH 7.5, 7.0, 6.5, and 5.5 after different incubation times. Time evolution of the GNDs@gelatin (i) before and (j) after MMP-2 treatments at different pH values of PBST solution (contain 500 ng·mL–1 MMP-2). Insets show TEM images of GNDs@gelatin after 6 h of incubation at pH 5.5. All scale bars are 5 μm.
Figure 2
Figure 2
MCH-to-MPA ratio-dependent morphologies and absorption spectral evolution of GNDs@gelatin X:Y. (a) Spectral profiles of MCH:MPA (X:Y) ratio-dependent absorption of GNDs@gelatin X:Y in NIR I and II. (b) Variation of absorption ratios (A1064/A555 and A808/A555) versus the different feed ratios of MCH to MPA ligands that attached to the surface of GNDs@gelatin (**p < 0.01). (c) TEM images of GNDs@gelatin X:Y at different ratios of MCH to MPA. Insets show the structures of individual GNDs@gelatin X:Y under each condition. All scale bars are 100 nm. (d) Optical microscopy images delineate the uptake efficiencies of GNDs@gelatin X:Y by C6 cells at different MCH:MPA ratios. All scale bars are 100 μm.
Figure 3
Figure 3
Effects of gelatinase activity on cellular uptake of GNDs@gelatin. (a) Representative analysis of cell lysate (20 μg of total protein per sample) subjected to SDS-PAGE followed by in-gel zymography. Molecular mass markers are indicated at the right side. (b) The densitometric quantification of MMP-2 and -9 activity. Differential optical microscopy images of (c) U87-MG, (d) CT-2A, (e) C6, (f) A549, (g) MES-SA, and (h) MCF-7 cells treated with GNDs@gelatin for 24 h. All scale bars are 20 μm (*p < 0.05 and **p < 0.01).
Figure 4
Figure 4
Activatable NIR plasmonic properties of GNDs@gelatin. (a) Normalized UV–vis–NIR absorption spectra of AuNPs@gelatin, GNDs@gelatin, endocytosed AuNPs@gelatin, and endocytosed GNDs@gelatin (solid black, solid red, dashed black, and dashed red lines, respectively). The inset shows the enlarged view of absorbance over the NIR-I and -II regions. (b) Comparison of A1064(808)/A525 of AuNPs@gelatin and A1064(808)/A555 of GNDs@gelatin before and after the nanoparticle endocytosis. Error bars were obtained from three experiments (**p < 0.01, n = 3).
Figure 5
Figure 5
Photothermal properties of the synthesized GNDs@gelatin. Temperature elevation of dispersed and aggregated GNDs@gelatin over five laser on/off cycles of (a) 808 nm and (d) 1064 nm laser irradiation with the laser power density of 1.0 W·cm–2. The concentration of GNDs@gelatin was 100 μg·mL–1. The changes in temperature rise profiles were plotted as a function of the irradiation time for dispersed (b, e) (dGNDs@gelatin) and aggregated (aGNDs@gelatin) (c, f) GNDs@gelatin with different lasers. The photoirradiation was carried out using (b, c) 808 nm and (e, f) 1064 nm CW laser irradiation.
Figure 6
Figure 6
Photoacoustic characterization of the GNDs@gelatin. (a) Representative PA images and signal intensity of dispersed and aggregated GNDs@gelatin solutions at the concentration of 100 μg·mL–1, each was excited by the pulse laser from 700 to 980 nm. The corresponding B-scan images of aggregated GNDs@gelatin (top) and dispersed GNDs@gelatin (bottom) at different laser wavelengths are shown. (b) PA intensities of aggregated GNDs@gelatin as a function of nanoparticle concentration in PBS. R2 = 0.9872, 0.978, 0.9908, 0.9558 for 750, 800, 850, and 900 nm, respectively. (c) NIR-II photoacoustic imaging of GNDs@gelatin. Representative PA images (left) and derived signal intensities (right) of dispersed and aggregated GNDs@gelatin solutions with the concentration of 100 μg·mL–1 excited by pulsed laser at various wavelengths.
Figure 7
Figure 7
Photothermal cytotoxicity of GNDs@gelatin. (a) Fluorescence images of live (calcein AM, green) and dead (PI, red) C6 and A549 cells after treatment with 808 nm laser alone, or the GNDs@gelatin with 808 nm laser irradiation (scale bars are 100 μm). (b) Fluorescence images of C6 and A549 cells after incubation with GNDs@gelatin under the 1064 nm laser irradiation (scale bars are 200 μm).
Figure 8
Figure 8
In vivo PA images of the GNDs@gelatin in the tumor tissues. (a) PA images at 808 nm (NIR-I) and 1160 nm (NIR-II) of GNDs@gelatin before (0 h) and after intravenous injection of GNDs@gelatin (24 h). (b) Time-dependent changes of PA intensities at 808 and 1160 nm following the GNDs@gelatin injection.
Figure 9
Figure 9
In vivo NIR-I and -II PTT against tumor. (a) Representative IR thermal images of C6-tumor-bearing mice with intravenous injection of GNDs@gelatin under laser irradiation at either 808 nm (1 W·cm–2) or 1064 nm (1 W·cm–2) for different time periods (**p < 0.01, n = 5). (b) Tumor growth curves with different treatments over the period of 30 days. The significant inhibition of tumor growth was observed under the NIR-I or NIR-II operation in the presence of GNDs@gelatin. (c) The corresponding body weight variation of mice following the treatments (**p < 0.01, n = 5).
Figure 10
Figure 10
Modulation effect of laser power on tumor metastasis following PTT. (a) Representative H&E-stained images on histological sections of major organs from mice 7 days post i.v. injection of GNDs@gelatin (1 mg per mouse) and laser irradiation (NIR-I at 808 nm). (b) IR images and representative pictures of tumor bearing mice at 28 days after 1.0 W·cm–2 (left, 60 °C average final temperature) and 0.5 W·cm–2 (right, 44 °C average final temperature) NIR-II (1064 nm) PTT treatments. GNDs@gelatin-injected mice with complete tumor eradication were sacrificed 28 days after NIR-II PTT treatment. The liver metastasis of tumor was observed under the 60 °C average final temperature using higher laser power at 1.0 W·cm–2 (shown with dashed yellow circle and enlarged inset in the left panel), whereas no metastasis was induced under the 44 °C average final temperature using 0.5 W·cm–2 (right panel). (c) H&E-stained images of major organs from the mice in panel b. The distinct traits of liver metastasis (indicated by white arrow and white dashed lines) of C6 glioma tumor were verified from the mouse group treated with the 1.0 W·cm–2 laser. All scale bars are 20 μm.
Figure 11
Figure 11
GNDs@gelatin PTT induced differentially expressed genes (DEGs) in variant condition. (a) Heatmap of intersample correlation showed there was an obvious difference of significant mRNA expression levels between GNDs@gelatin PTT-treated and untreated groups. The Pearson’s correlation coefficient is represented by a color scale. The intensity increased from blue (relatively lower correlation) to red (relatively higher correlation). Correlation was evaluated by Pearson’s correlation coefficient of significant mRNA expression levels. (b) Bulb map of GO:BP, GO:MF, and KEGG analysis of differentially expressed gene. Rich factor represents the enrichment degree of differentially expressed genes. The Y axis shows the name of enriched pathways. The area of each node represents the number of the DEGs. The p-value is represented by a color scale. The statistical significance increased from purple (relatively lower significance) to red (relatively higher significance.

Similar articles

Cited by

References

    1. Wong X. Y.; Sena-Torralba A.; Álvarez-Diduk R.; Muthoosamy K.; Merkoçi A. Nanomaterials for nanotheranostics: Tuning their properties according to disease needs. ACS Nano 2020, 14, 2585–627. 10.1021/acsnano.9b08133. - DOI - PubMed
    1. Sivasubramanian M.; Chuang Y. C.; Chen N. T.; Lo L. W. Seeing better and going deeper in cancer nanotheranostics. Int. J. Mol. Sci. 2019, 20, 3490.10.3390/ijms20143490. - DOI - PMC - PubMed
    1. Yoon H. Y.; Jeon S.; You D. G.; Park J. H.; Kwon I. C.; Koo H.; et al. Inorganic nanoparticles for image-guided therapy. Bioconjug Chem. 2017, 28, 124–34. 10.1021/acs.bioconjchem.6b00512. - DOI - PubMed
    1. Moore C.; Jokerst J. V. Strategies for image-guided therapy, surgery, and drug delivery using photoacoustic imaging. Theranostics 2019, 9, 1550–71. 10.7150/thno.32362. - DOI - PMC - PubMed
    1. Attia A. B. E.; Balasundaram G.; Moothanchery M.; Dinish U. S.; Bi R.; Ntziachristos V.; et al. A review of clinical photoacoustic imaging: Current and future trends. Photoacoustics 2019, 16, 10014410.1016/j.pacs.2019.100144. - DOI - PMC - PubMed

LinkOut - more resources