. 2024 Oct 3;144(14):1508-1520.
doi: 10.1182/blood.2024024518.

KDM6A regulates immune response genes in multiple myeloma

Affiliations

KDM6A regulates immune response genes in multiple myeloma

Daphné Dupéré-Richer et al. Blood. .

Abstract

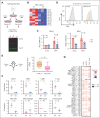
The histone H3 at lysine 27 (H3K27) demethylase lysine demethylase 6A (KDM6A) is a tumor suppressor in multiple cancers, including multiple myeloma (MM). We created isogenic MM cells disrupted for KDM6A and tagged the endogenous protein to facilitate genome-wide studies. KDM6A binds genes associated with immune recognition and cytokine signaling. Most importantly, KDM6A binds and activates NLRC5 and CIITA, which encode regulators of major histocompatibility complex genes. Patient data indicate that NLRC5 and CIITA are downregulated in MM with low KDM6A expression. Chromatin analysis shows that KDM6A binds poised and active enhancers and KDM6A loss led to decreased H3K27ac at enhancers, increased H3K27me3 levels in body of genes bound by KDM6A, and decreased gene expression. Reestablishing histone acetylation with an HDAC3 inhibitor leads to upregulation of major histocompatibility complex expression, offering a strategy to restore immunogenicity of KDM6A-deficient tumors. Loss of Kdm6a in Kirsten rat sarcoma virus (K-RAS)-transformed murine fibroblasts led to increased growth in vivo associated with decreased T-cell infiltration.


Conflict of interest statement

Conflict-of-interest disclosure: J.D.L. reports research support from Epizyme/Ipsen; and a consultancy role at AstraZeneca. L.H.B. reports a consultancy role at AstraZeneca; C.S.M. serves on the scientific advisory board of Adicet Bio; reports consultant/honoraria from Genentech, Nerviano, Secura Bio, and Oncopeptides; and research funding from EMD Serono, Karyopharm, Sanofi, Nurix, Bristol Myers Squibb, H3 Biomedicine/Eisai, Springworks, Abcuro, Novartis, and Opna. The remaning authors declare no competing financial interests.

Figures

None
Graphical abstract
Figure 1.
Figure 1.
KDM6A monoallelic loss in female patients with myeloma corresponds with worse outcome. (A) Heat map of somatic copy number (CN) on the X chromosome for female patients with MM from CoMMpass. (B) Histogram of somatic CN for female patients. The red line denotes the threshold used for CN number loss and the number of female patients. (C) Expression of KDM6A in 703 patients with newly diagnosed MM from the CoMMpass trial with CN and RNA-sequencing data. P values determined by linear regression. (D) Progression-free survival for CoMMpass patients grouped into the categories shown in panel C. P values determined by Cox proportional hazards regression relative to the female (F; red) group. (E) Response of female patients with or without loss of the X chromosome, treated with lenalidomide or other regimens. SD, stable disease; PR partial response; VGPR, very good partial response; CR, complete response; sCR, stringent complete response (X2 test). FPKM, fragment per kilobase per million mapped fragment; M, male.
Figure 2.
Figure 2.
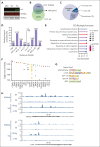
KDM6A binding sites in myeloma cell lines. (A) Immunoblot showing the detection of KDM6A by an HA antibody in ARP-1 cells in which both alleles of endogenous KDM6A were HA tagged using CRISPR-Cas9 gene editing. ARD is a KDM6A-negative control cell line. (B) Overlap of KDM6A binding sites detected by chromatin precipitation of an HA-tagged ARP-1 cell line with anti-HA or anti-KDM6A antibodies. (C) Distribution of KDM6A binding sites in the annotated regions of the genome in the ARP-1 cell line. (D) Distance and orientation between KDM6A binding regions and their closest genes. (E) Dot plot visualization of gene ontology (GO) biological process enrichment analyses of KDM6A-bound genes using the GoShiny v0.77 tool. The size of the dots reflects the number of genes, the length of the line indicates fold enrichment, and color scale indicates false discovery rate. (F) Similarity of KDM6A binding pattern with those of transcription factors found in the Cistrome database (top 20). Each dot represents a different ChIP experiment. (G) Hypergeometric optimization of motif enrichment (HOMER)–identified enriched transcription factor binding motif within regions bound by KDM6A as identified both by KDM6A and HA antibody in ARP-1 cells expressing HA-tagged KDM6A. (H) Genome browser view of the CIITA and NLRC5 locus in ARP-1 cell line replete or knocked out or KO for KDM6A. FDR, false discovery rate; TSS, transcriptional start site.
Figure 3.
Figure 3.
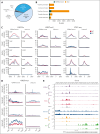
KDM6A loss impact on chromatin structure. (A) Distribution of KDM6A binding sites annotated regions of the genome in ARP-1 cell lines. (B) Box plot showing the proportion of total enhancers and promoters bound by KDM6A. (C) H3K27ac-seq, H3k27me3-seq, and ATAC-seq (assay for transposase-accessible chromatin with sequencing) signals in ARP-1 isogenic clonal cell line WT or KO for KDM6A centered on H3K4me1 peaks for enhancers and centered on transcription start sites for promoters. (D) H3K27me3 metagene analysis at locus bound by KDM6A in ARP-1 isogenic clonal cell line WT or KO for KDM6A. (E) Genome browser view of the CIITA locus in ARP-1 cell line WT or KO for KDM6A. TES, transcription end site; TSS, transcription start site.
Figure 4.
Figure 4.
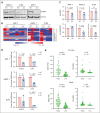
KDM6A controls MHC I and II gene expression. (A) Immunoblot showing depletion of KDM6A protein in CRISPR edited clonal cell lines. (B) Heat map of z scores for all expressed MHC genes in KDM6A WT and KO cell lines. (C) Flow cytometry analysis of HLA-A/B/C and HLA-DM/DQ/DR in clonal isogenic cell lines ARP-1, AMO-1, and EJM. Bottom panels of each histograms represent the mean fluorescence intensity (MFI) quantification (3 to 6 biological replicates; ± standard deviation [SD] Wilcoxon t test). (D) mRNA analysis by quantitative polymerase chain reaction (qPCR) normalized to glyceraldehyde-3-phosphate dehydrogenase (GAPDH; 3-5 biological replicates; ± SD. Wilcoxon t test). (E) Normalized expression values in transcript per million (TPM) of NLRC5 and CIITA in myeloma patient tumors within the top or bottom decile of KDM6A expression (38 females and 54 males in each group, unpaired t test). (F) Multiplex enzyme-linked immunosorbent assay analysis of cytokine in ARP-1 WT and KO clonal cells line (Mann-Whitney t test). max, maximum; min, minimum; ns, not significant.
Figure 5.
Figure 5.
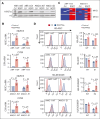
HDAC3 inhibition restores MHC expression in MM cell lines. (A) Immunoblot of H3K27ac 24 hours after treatment with 10 μM RGFP966. (B) Heat map of z scores for all expressed MHC genes in KDM6A clonal isogenic cell lines. (C) mRNA analysis by qPCR normalized to GAPDH 24 hours after treatment with 10 μM RGFP966 (3-5 biological replicates; ± SD. Wilcoxon t test). (D) Flow cytometry analysis of HLA-A/B/C and HLA-DM/DQ/DR in myeloma isogenic cell lines treated or not with 10 μM RGFP966 for 24 hours or 72 hours. Panel on the right shows the histograms MFI quantification of HLA-A/B/C and HLA-DM/DQ/DR (4 or 5 biological replicates; ± SD, Wilcoxon t test). Ctl, control.
Figure 6.
Figure 6.
KDM6A depletion decreases MHC I expression in MEFs and decreases tumor immunogenicity in vivo. (A) Schematic of the protocol used to develop isogenic Kdm6a KO MEF from a C57BL/6J mouse homozygous for an allele of Kdm6a in which exon 3 was flanked with LoxP sites. (B) Heat map of z score for all expressed MHC I genes in Kdm6a WT and KO MEF. (C) Nlrc5 mRNA analysis by qPCR normalized to GAPDH (5 biological replicates; ± SD. Mann-Whitney t test). (D) Flow cytometry analysis of H-2kb in Kdm6a WT or KO MEFs (upper panel). MFI quantification of H-2kb surface expression from upper panel (5 biological replicates; ± SD, Mann-Whitney t test) (lower panel). (E) K-Ras-transformed WT and Kdm6a KO MEFs were injected into left and right flanks respectively of C57BL/6J and NOD-SCID mice and tumors excised and weighed after 3 weeks. The ratio of tumor weights from animal injected with Kdm6a-replete or Kdm6a-deficient K-Ras-transformed fibroblasts was calculated in immunocompetent C57BL/6J and immunodeficient NOD-SCID mice (8 biological replicates; ± SD, Mann-Whitney t test). (F) Flow cytometry quantifications of T cell, NK cells, and macrophage populations in the tumors isolated in panel E. (G) Spearman correlation between KDM6A and NLRC5 or CIITA gene expression and CD8+ T-cell infiltration in tumors isolated from various human cancers and correlation between KDM6A expression and T cell infiltrates as determined using Cistrome TIMER 2.0.

Update of

Comment in

References

    1. Avet-Loiseau H, Li C, Magrangeas F, et al. Prognostic significance of copy-number alterations in multiple myeloma. J Clin Oncol. 2009;27(27):4585–4590. - PMC - PubMed
    1. Calasanz MJ, Cigudosa JC, Odero MD, et al. Cytogenetic analysis of 280 patients with multiple myeloma and related disorders: primary breakpoints and clinical correlations. Genes Chromosomes Cancer. 1997;18(2):84–93. - PubMed
    1. Dewald GW, Kyle RA, Hicks GA, Greipp PR. The clinical significance of cytogenetic studies in 100 patients with multiple myeloma, plasma cell leukemia, or amyloidosis. Blood. 1985;66(2):380–390. - PubMed
    1. Sawyer JR, Waldron JA, Jagannath S, Barlogie B. Cytogenetic findings in 200 patients with multiple myeloma. Cancer Genet Cytogenet. 1995;82(1):41–49. - PubMed
    1. Bergsagel PL, Kuehl WM, Zhan F, Sawyer J, Barlogie B, Shaughnessy J. Cyclin D dysregulation: an early and unifying pathogenic event in multiple myeloma. Blood. 2005;106(1):296–303. - PMC - PubMed

MeSH terms