. 2024 Sep 1;35(9):ar122.
doi: 10.1091/mbc.E24-01-0030. Epub 2024 Jul 24.

Measurement of solubility product reveals the interplay of oligomerization and self-association for defining condensate formation

Affiliations

Measurement of solubility product reveals the interplay of oligomerization and self-association for defining condensate formation

Aniruddha Chattaraj et al. Mol Biol Cell. .

Abstract

Cellular condensates often consist of 10s to 100s of distinct interacting molecular species. Because of the complexity of these interactions, predicting the point at which they will undergo phase separation is daunting. Using experiments and computation, we therefore studied a simple model system consisting of polySH3 and polyPRM designed for pentavalent heterotypic binding. We tested whether the peak solubility product, or the product of the dilute phase concentration of each component, is a predictive parameter for the onset of phase separation. Titrating up equal total concentrations of each component showed that the maximum solubility product does approximately coincide with the threshold for phase separation in both experiments and models. However, we found that measurements of dilute phase concentration include small oligomers and monomers; therefore, a quantitative comparison of the experiments and models required inclusion of small oligomers in the model analysis. Even with the inclusion of small polyPRM and polySH3 oligomers, models did not predict experimental results. This led us to perform dynamic light scattering experiments, which revealed homotypic binding of polyPRM. Addition of this interaction to our model recapitulated the experimentally observed asymmetry. Thus, comparing experiments with simulation reveals that the solubility product can be predictive of the interactions underlying phase separation, even if small oligomers and low affinity homotypic interactions complicate the analysis.


Conflict of interest statement

Conflict of interest: The authors declare a financial conflict of interest.

Figures

FIGURE 1:
FIGURE 1:
Concentration of polySH3 and polyPRM in dense and dilute phase changes with the increasing total concentration. (A) Equimolar concentrations of polySH3 (green) and polyPRM (magenta) undergo phase separation above 40 μM each (total concentration of protein = 80 μM). Brightness and contrast for each image were adjusted for visualization and to account for differences in percent labeling. n = 3. Scale bar = 20 μm. (B) Dilute phase concentrations of polySH3 and polyPRM as a function of total concentration. (C) Dense phase concentrations of polySH3 and polyPRM as the total concentration increases. In B and C, dilute and dense phase concentrations were calculated from the images obtained for the phase diagram using fluorescence-concentration curves (Supplemental Figure S2, A and B). The green and magenta lines represent polySH3 and polyPRM, respectively. Shaded regions represent error corresponding to the SD. The blue dotted line indicates the phase transition boundary as observed in A.
FIGURE 2:
FIGURE 2:
Accounting for small oligomers in our simulated dilute phase results in more accurate quantitative predicted dilute phase concentrations and SP. (A) Experimentally calculated SP of equimolar polySH3 and polyPRM concentrations. Concentration on X axis is per component, that is, 20 μM Total Concentration = 20 μM polyPRM = 20 μM polySH3. The blue line indicates the phase transition boundary as observed in Figure 1A. (B) SpringSaLaD representation of polySH3 and polyPRM. In polySH3, five (green) SH3 domains are interspersed with 10 linker sites (pink); linear molecular length = 42 nm. Similarly, polyPRM contains five (magenta) binding sites linked by 10 (orange) linker sites; linear molecular length = 28 nm. For all sites, radius = 1 nm, diffusion constant = 2 µm2/s. (C) Solubility product (SPdilute) profile where SPdilute = [Dilute SH3] * [Dilute PRM], derived from simulation results when clusters including up to five molecules are included in dilute phase calculations. (D) Molecular clusters at 100 µM and 200 µM, respectively. We randomly place N molecules of each type in a 3D reaction volume of 100*100*100 nm3. We then titrate up N to increase the molecular concentrations and quantify the cluster size distribution at steady state. For this system, N = [20, 40, 60, 80, 100, 120, 140, 160]. We run 50 stochastic trials for each condition and sample 2 steady state timepoints for each trial. So, each free concentration datapoint is an average over 100 independent realizations. (E) Extent of molecular clustering as a function of concentration. Average of the cluster size distribution is referred to as the ACO which is then divided by the total number of molecules (Ntotal) present in the system. In A and C, circle represents the mean, and the fluctuation envelope visualizes SDs.
FIGURE 3:
FIGURE 3:
Experimental SPs are asymmetrically distributed across the phase diagram contrary to symmetrically distributed simulated SPs. (A) Phase diagram obtained using polySH3 and polyPRM concentrations ranging from 0 μM to 80 μM. n = 3. Scale bar = 20 μm. (B) Experimental SPs are asymmetrically distributed across concentrations. Color scale indicates the experimentally calculated SP. (C) Binary classification of phase transition tendency based on the SpringSaLaD simulated cluster size distribution. Red points indicate phase transition while cyan points do not predict phase transition. For the classification, we inspect each steady state timeframe and look for a cluster that contains at least 10% of the total molecules. This thresholding yields a series of “yes” and “no.” If fraction of “yes” > 0.5, then the system has a phase transition tendency. SH3 and PRM counts are 20, 40, 60, 80, 100, 120, 140, 160 and reaction volume is 100*100*100 nm3. Number of steady state timeframes = 100. (D) SP profile from simulations along the phase diagram where SP = [Dilute polySH3] * [Dilute polyPRM]. As described earlier (Figure 2C), dilute phase includes clusters up to size 5. Number of steady state timeframes = 150.
FIGURE 4:
FIGURE 4:
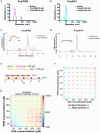
PRM-PRM self-association causes SP to be asymmetrical across the phase diagram. (A) DLS analysis of solutions containing polyPRM at concentrations of 0 μM (buffer only, black), 20 μM (cyan), and 80 μM (magenta). (B) DLS analysis of solutions containing polySH3 at concentrations of 0 μM (buffer only, black), 20 μM (cyan), and 80 μM (magenta). (C) SEC-MALS analysis of purified polyPRM (Supplemental Figure S1). UV detection of protein and light scattering occurs over a range of elutions. (D) SEC-MALS analysis of purified polySH3 (Supplemental Figure S1). UV detection of protein and light scattering occurs at a single peak during elution. (E) Illustration of our modified model where PRMs can self-associate. We enabled binding (5x weaker than the canonical SH3–PRM interaction) between linkers of PRM molecules. (F) Binary classification of phase transition tendency based on the cluster size distribution, as described in Figure 3C. SH3 and PRM counts are 20, 40, 60, 80, 100, 120, 140, 160 and reaction volume is 100*100*100 nm3. Number of steady state timeframes = 100. (G) Simulated SPoligomer (SP that includes small oligomers and homotypic polyPRM interactions) profile across the phase diagram. Number of steady state timeframes = 150.
FIGURE 5:
FIGURE 5:
The maximal simulated monomer SP occurs at the critical concentrations for phase separation across the phase diagram. (A) Simulated SPmonomer profile across the phase diagram when only heterotypic interactions between polySH3 and polyPRM are modeled. Number of steady state timeframes = 150. (B) Simulated SPmonomer profile across the phase diagram when heterotypic interactions between polySH3 and polyPRM and homotypic interactions between polyPRM and polyPRM are modeled. Number of steady state timeframes = 150.
FIGURE 6:
FIGURE 6:
A picture of equilibrium for multicomponent phase separating systems. Experimentally measured dilute phase concentration includes both monomers and small oligomers, allowing us to calculate the SPoligomer across concentrations in the phase diagram. We can also calculate this parameter using computational modeling to determine agreement between experimental and computational systems. When the computational and experimental SPoligomer are in agreement, the model can be parsed for the SPmonomer. Phase separation occurs at the maximal SPmonomer.

Update of

References

    1. Alberti S, Hyman AA (2021). Biomolecular condensates at the nexus of cellular stress, protein aggregation disease and ageing. Nat Rev Mol Cell Biol 22, 196–213. - PubMed
    1. Banani SF, Lee HO, Hyman AA, Rosen MK (2017). Biomolecular condensates: organizers of cellular biochemistry. Nat Rev Mol Cell Biol 18, 285–298. - PMC - PubMed
    1. Banani SF, Rice AM, Peeples WB, Lin Y, Jain S, Parker R, Rosen MK (2016). Compositional control of phase-separated cellular bodies. Cell 166, 651–663. - PMC - PubMed
    1. Banjade S, Wu Q, Mittal A, Peeples WB, Pappu RV, Rosen MK (2015). Conserved interdomain linker promotes phase separation of the multivalent adaptor protein Nck. Proc Natl Acad Sci USA 112, E6426–E6435. - PMC - PubMed
    1. Case LB, Zhang X, Ditlev JA, Rosen MK (2019). Stoichiometry controls activity of phase-separated clusters of actin signaling proteins. Science 363, 1093–1097. - PMC - PubMed

MeSH terms

LinkOut - more resources