. 2025 Apr 1;74(2):267-281.
doi: 10.1093/sysbio/syae043.

Exploring the Macroevolutionary Signature of Asymmetric Inheritance at Speciation

Affiliations

Exploring the Macroevolutionary Signature of Asymmetric Inheritance at Speciation

Théo Gaboriau et al. Syst Biol. .

Abstract

Popular comparative phylogenetic models such as Brownian Motion, Ornstein-Ulhenbeck, and their extensions assume that, at speciation, a trait value is inherited identically by 2 descendant species. This assumption contrasts with models of speciation at a micro-evolutionary scale where descendants' phenotypic distributions are sub-samples of the ancestral distribution. Different speciation mechanisms can lead to a displacement of the ancestral phenotypic mean among descendants and an asymmetric inheritance of the ancestral phenotypic variance. In contrast, even macro-evolutionary models that account for intraspecific variance assume symmetrically conserved inheritance of ancestral phenotypic distribution at speciation. Here, we develop an Asymmetric Brownian Motion model (ABM) that relaxes the assumption of symmetric and conserved inheritance of the ancestral distribution at the time of speciation. The ABM jointly models the evolution of both intra- and inter-specific phenotypic variation. It also infers the mode of phenotypic inheritance at speciation, which can range from a symmetric and conserved inheritance, where descendants inherit the ancestral distribution, to an asymmetric and displaced inheritance, where descendants inherit divergent phenotypic means and variances. To demonstrate this model, we analyze the evolution of beak morphology in Darwin finches, finding evidence of displacement at speciation. The ABM model helps to bridge micro- and macro-evolutionary models of trait evolution by providing a more robust framework for testing the effects of ecological speciation, character displacement, and niche partitioning on trait evolution at the macro-evolutionary scale.

Keywords: Character displacement; phenotypic evolution; phylogenetic comparative methods; speciation.


Conflict of interest statement

None declared.

Figures
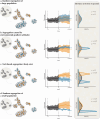
Figure 1
Figure 1
Different scenarios of ancestral distribution’s inheritance are expected depending on the processes that caused segregation. Each line represents a different speciation scenario from the same ancestral population (top left) with intraspecific variation. The measured phenotype is body-size as represented by different sizes of bird images. The central column represents simulations of how ancestral and descendant species distributions change through time. Lines represent the evolution of the mean and shaded polygons represent the 95% interval of each species distribution. Ts is the time of speciation represented as a branching event in a phylogeny. The ancestral distribution is represented in black and the descendants in orange and blue. The right column represents the expected distributions of descendants’ phenotypes at the time of speciation Ts according to the ABM model. The parameters ν (asymmetry) and ω (displacement) control the repartition of the ancestral distribution (in black) into 2 descending distributions in blue and orange.
Figure 2
Figure 2
Beak morphology distributions per species in Coerebinae. The left represents the time-calibrated phylogeny of Coerebinae and the right panels represent estimated trait distributions from individual observation (dots) for each species and each trait used in the analysis.
Figure 3
Figure 3
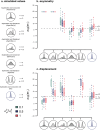
Variable selection results on the simulated datasets. The upper panel represents the 2log(BF) of asymmetric vs symmetric inheritance in function of the simulated scenarios. The lower panel represents the 2log(BF) of displaced vs conserved inheritance in function of the simulated scenarios. Most simulations involving displacement led to a log(BFω)>6. Most simulations involving asymmetry led to a log(BFω)>6. Simulations with high evolutionary rates led to less accurate model selection. Asym/Cons : Asymmetric and Conserved Inheritance (ν=0.5,ω=0); Asym/Dis(+) : Asymmetric and Displaced inheritance (ν=0.5,ω=0.5); Asym/Dis(-) : Intermediate scenario (ν=0.2,ω=0.2); OU : Sym/Cons with Ornstein-Ulhenbeck on the ζ (ν=0,ω=0); Sym/Cons : Symmetric and Conserved Inheritance (ν=0,ω=0); Sym/Dis : Symmetric and Displaced Inheritance (ν=0,ω=0.5).
Figure 4
Figure 4
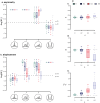
Parameter estimation on the simulated datasets. Each panel represents mean parameter estimation in function of the simulated scenario. The grey dashed lines represent the parameter value used to simulate the dataset. Asym/Cons : Asymmetric and Conserved Inheritance (ν=0.5,ω=0); Asym/Dis(+) : Asymmetric and Displaced inheritance (ν=0.5,ω=0.5); Asym/Dis(-) : Intermediate scenario (ν=0.2,ω=0.2); OU : Sym/Cons with Ornstein-Ulhenbeck on the ζ (ν=0,ω=0); Sym/Cons : Symmetric and Conserved Inheritance (ν=0,ω=0); Sym/Dis : Symmetric and Displaced Inheritance (ν=0,ω=0.5).
Figure 5
Figure 5
Variable selection results on datasets simulated with extinction. The upper panel (a) represents the 2log(BF) of asymmetric versus symmetric inheritance in function of the simulated scenarios. The lower panel represents the 2log(BF) of displaced versus conserved inheritance in function of the simulated scenarios. Asym/Cons : Asymmetric and Conserved Inheritance (ν=0.5,ω=0); Asym/Dis(+) : Asymmetric and Displaced inheritance (ν=0.5,ω=0.5); Asym/Dis() : Intermediate scenario (ν=0.2,ω=0.2); Sym/Dis : Symmetric and Displaced Inheritance (ν=0,ω=0.5). Right Panels (c–e): Parameter estimation on the simulated datasets with extinction for the Asymmetric and Displaced Inheritance scenario ((ν=0.5,ω=0.5). Each panel represents mean parameter estimation. The grey dashed lines represent the parameter value used to simulate the dataset.

References

    1. Abzhanov A. 2017. The old and new faces of morphology: the legacy of D’Arcy Thompson’s “theory of transformations” and “laws of growth”. Development (Cambridge) 144:4284–4297. - PubMed
    1. Ackermann M., Doebeli M.. 2004. Evolution of niche width and adaptive diversification. Evolution 58:2599–2612. - PubMed
    1. Beaulieu J.M., Jhwueng D.-C., Boettiger C., O’Meara B.C.. 2012. Modeling stabilizing selection: expanding the Ornstein-Uhlenbeck model of adaptive evolution. Evolution 66:2369–2383. - PubMed
    1. Blomberg S.P., Garland T., Ives A.R.. 2003. Signal in comparative data: testing for phylogenetic behavioral traits are more labile. Evolution 57:717–745. - PubMed
    1. Bokma F. 2002. Detection of punctuated equilibrium from molecular phylogenies. J. Evol. Biol. 15:1048–1056.