. 2024 Aug 27;43(8):114527.
doi: 10.1016/j.celrep.2024.114527. Epub 2024 Jul 23.

PAI-1 uncouples integrin-β1 from restrain by membrane-bound β-catenin to promote collagen fibril remodeling in obesity-related neoplasms

Affiliations

PAI-1 uncouples integrin-β1 from restrain by membrane-bound β-catenin to promote collagen fibril remodeling in obesity-related neoplasms

Li-Ling Lin et al. Cell Rep. .

Abstract

The paracrine actions of adipokine plasminogen activator inhibitor-1 (PAI-1) are implicated in obesity-associated tumorigenesis. Here, we show that PAI-1 mediates extracellular matrix (ECM) signaling via epigenetic repression of DKK1 in endometrial epithelial cells (EECs). While the loss of DKK1 is known to increase β-catenin accumulation for WNT signaling activation, this epigenetic repression causes β-catenin release from transmembrane integrins. Furthermore, PAI-1 elicits the disengagement of TIMP2 and SPARC from integrin-β1 on the cell surface, lifting an integrin-β1-ECM signaling constraint. The heightened interaction of integrin-β1 with type 1 collagen (COL1) remodels extracellular fibrillar structures in the ECM. Consequently, the enhanced nanomechanical stiffness of this microenvironment is conducive to EEC motility and neoplastic transformation. The formation of extensively branched COL1 fibrils is also observed in endometrial tumors of patients with obesity. The findings highlight PAI-1 as a contributor to enhanced integrin-COL1 engagement and extensive ECM remodeling during obesity-associated neoplastic development.

Keywords: CP: Cancer; CP: Metabolism; DKK1; ECM remodeling; PAI-1; collagen fibrils; endometrial cancer; integrin inside-out signaling; obesity.


Conflict of interest statement

Declaration of interests The authors declare no competing interests.

Figures
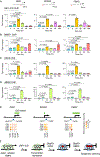
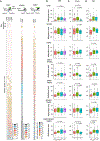
Figure 1.
Figure 1.. PAI-1 elicits epigenetic silencing of candidate CMA loci via LRP1-mediated signaling
(A–D) To assess the binding of LRP1-ICD (A), and recruitment of epigenetic repressors DNMT1 (B), EZH2 (C), or MBD2 (D), to the promoter regions of DKK1, SPARC, and TIMP2 in EME6/7t EECs treated with ASC-CM, ChIP-qPCR was used at the indicated time points (0, 6, 24, 48, 96, and 168 h). n = 3 technical replicates. Data are represented by mean ± SD. p values were determined using ANOVA test. (E) Bisulfite pyrosequencing analysis targeting the promoter regions of DKK1, SPARC, and TIMP2 to assess CpG methylation levels in EME6/7t EECs exposed to ASC-CM (experimental duplicates: CM1 and CM2) or control (experimental duplicates: C01 and C02) for 21 days. The green box indicates CpG island, and the short, thick black line over the gene body represents the scale of 200 bp. The thicker, short blue box represents the probed sites. (F) Model for the underlying repressive actions by ASC-CM, which leads to the sequential recruitment of epigenetic repressors and subsequently marks the promoters of DKK1, SPARC, and TIMP2 for methylation. LRP1-ICD initiates transcriptional repression of these genes. EZH2 and DNMT1 binding then enforces DNA methylation and establishes epigenetic silencing. See also Figures S1–S4, and Table S2.
Figure 2.
Figure 2.. Promoter hypermethylation of candidate CMA loci in endometrioid tumors of patients with obesity
(A) Bisulfite pyrosequencing analysis was performed for promoter methylation levels of DKK1, SPARC, and TIMP2 in non-cancerous endometrial tissues (n = 6) and primary tumors (n = 161). The green box indicates CpG island, and the short, thick black line over the gene body represents the scale of 200 bp. The thicker, short blue box represents probed sites (DKK1: 4 CpG sites, SPARC: 2 CpG sites, and TIMP2: 2 CpG sites). (B–D) Analysis of DNA methylation levels in (A) for individual DKK1, SPARC, and TIMP2 and their combinations in the tumor samples stratified by clinicopathologic features. BMI groups (<30, n = 25; 30–34, n = 34; 35–39, n = 25; ≥40, n = 77) (B), histologic grade groups (grade 1: n = 80; grade 2: n = 73; grade 3: n = 8) (C), or age groups (<50 years, n = 65; 50–59 years, n = 38; ≥60 years, n = 58) (D). Data are represented by mean ± SD. p values were determined using ANOVA test. See also Tables S3 and S4.
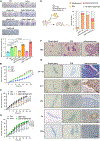
Figure 3.
Figure 3.. Repression of candidate CMA loci initiates endometrial neoplastic development
(A) Colony formation and quantification in control (Ctrl), PAI-1, and KDs of DKK1, SPARC, TIMP2, DKK1/SPARC, and DKK1/TIMP2 in EME6/7t EECs. Images of colonies in 3 wells per treatment were taken in single experiments. Data are represented by mean ± SD. p values were determined using ANOVA test. (B) Cell migration rates were assessed for EME6/7t EECs treated with PAI-1, ASC-CM (CM), or control (Ctrl). n = 6 wells per treatment were assayed in single experiments. Data are represented by mean ± SD. p values were determined using Student’s t test. (C) Migration rates of Ctrl, PAI-1, DKK1 KD, and DKK1/SPARC KD cells. n = 5 wells per treatment were assayed in single experiments. Data are represented by mean ± SD. p values were determined using Student’s t-test. (D) Migration rates of Ctrl, PAI-1-treated, DKK1 KD, and DKK1/TIMP2 KD cells. n = 5 wells per treatment were assayed in single experiments. Data are represented by mean ± SD. p values were determined using Student’s t test. (E) Left: schematic diagram depicting SCID mice that were subcutaneously injected with parental EECs, DKK1 KD, DKK1/SPARC KD, and DKK1/TIMP2 KD cells. Xenograft lesions were harvested after 70 days for pathological analysis (image created with BioRender.com). Right: quantitative analysis of the histologic types of xenograft lesions developed in the mouse groups (n = 10 mice per group). (F) Representative H&E images of tissue sections showing these histological types: simple gland, EIN, and adenocarcinoma. Scale bar, 200 μm. (G) Representative IHC images of CA-125, WT1, p53, PR, ERa. Scale bars, 200 μm. See also Figure S5 and Table S5.
Figure 4.
Figure 4.. Repression of the CMA loci unhooks β-catenin from integrin-β1 and enhances its stabilization through ubiquitination inhibition
(A) Western blotting of β-catenin levels in the membrane, cytosolic, and nuclear fractions of EME6/7t EECs treated with PAI-1 at the indicated time points. (B) Representative immunofluorescence images of β-catenin in EME6/7t EECs with or without PAI-1 treatment and DKK1 KD cells. Scale bars, 20 μm. Images of 4 fields per treatment were taken in single experiments. Data are represented by mean ± SD. p values were determined using ANOVA test. (C) Immunohistochemistry (IHC) staining of β-catenin patterns in xenograft lesion sections of the 3 histological types. Upper images scale bars: 20 μm, and lower images scale bars: 5 μm. Arrows indicate β-catenin nuclear localization in adenocarcinoma sections. (D–H) Representative images and quantitative analysis of proximity ligation assay (PLA) signals displaying the interaction between β-catenin and ubiquitin (n = 2–4 fields from 2 biological replicates) (D), β-catenin and APC (n = 3–7 fields from 2 biological replicates) (E), integrin-α3 and β-catenin (n = 2–5 fields from 2 biological replicates) (F), integrin-β1 and β-catenin (n = 2–3 fields from 2 biological replicates) (G), and integrin-β2 and β-catenin (n = 3–5 fields from 2 biological replicates) (H) in EME6/7t EECs treated or not treated with PAI-1 as well as the aforementioned EME6/7t KD cells. Scale bars, 20 μm. Data are represented by mean ± SD, and p values were calculated using ANOVA test. See also Figure S6.
Figure 5.
Figure 5.. PAI-1 induces integrin-β1-COL1 engagement and extracellular COL1 deposition
(A) Left: Representative immunoassay, using whole-exome sequencing, analysis of the levels of integrin-β1 (Int. β1) open conformation in EME6/7t EECs with PAI-1 treatment at the indicated time points. Right: quantitative analysis of expression levels. n = 3 biological replicates. Data are represented by mean ± SD, and p values were calculated using ANOVA test. (B) Representative images showing integrin-β1 in EME6/7t EECs treated with or without PAI-1. Arrows indicate integrin-β1 aggregation in the leading edges of cells. Scale bars, 20 μm. (C–E) Representative PLA signal images and quantitative analysis displaying the protein-protein interactions for integrin-β1 and COL1 (C), SPARC and integrin-β1 (D), and TIMP2 and integrin-β1 (E). Scale bars, 20 μm. n = 3 biological replicates. Data are represented by mean ± SD, and p values were calculated using ANOVA test. (F) Left: representative immunofluorescence images displaying deposited COL1 by EME6/7t EECs exposed to PAI-1 in the presence or absence of integrin-β1 neutralizing antibody. Right: quantitative analysis is shown. Scale bars, 20 μm. n = 12 fields per treatment from 3 biological replicates. (G) IHC images displaying extracellular COL1 patterns of the 3 histological types in the aforementioned xenograft model. Red arrows indicate extensive COL1 structures extending beyond the EIN and adenocarcinoma regions in mice with the DKK1 KD and DKK1/TIMP2 KD cells. Scale bars, 50 μm.
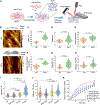
Figure 6.
Figure 6.. PAI-1 increases ECM nano-mechanical stiffness and branched topological features
(A) Schematic of ECM decellularized from EME6/7t EECs with or without PAI-1 exposure (14 days). Nanomechanical and topological features of the ECM was then assessed by AFM. Image was created with BioRender.com. (B) Representative images showing spatial distribution of height ranges of the decellularized ECM. Squares are 25 × 25μm. (C–F) Topological analysis of roughness (RMS) (C), skewness (D), fractal dimension (E), and branching (F) was performed in the decellularized ECM. Data are represented by mean ± SD, p values were determined using a Student’s t test. n = 5–8 fields from 5 biological replicates per condition. Data are represented by mean ± SD, and p values were calculated using Student’s t test. (G–J) The ECM nanomechanical features, adhesion (G and I) and stiffness (H and J), in the decellularized ECM from EME6/7t EECs with or without PAI-1 exposure (G and H); DKK1 KD, DKK1/SPARC KD, and DKK1/TIMP2 KD cells (I and J) were measured by AFM. Single dot = single area of ECM analyzed. n = 5–8 fields from 5 biological replicates per condition in (G)–(J). Data are represented by mean ± SD, and p values were calculated using Student’s t test in (G) and (H) and Tukey’s test in (I) and (J). (K) Migration rates of EECs cultured on top of 1 kPa (non-oncogenic condition) or 20 kPa (stiffer oncogenic condition) ECM and treated with or without PAI-1. n = 4 wells/per treatment were assayed in a single experiment. Data are represented by mean ± SD, and p values were calculated using Student’s t test.
Figure 7.
Figure 7.. Increased diversity of extracellular collagen fibril network in obesity-associated endometrial tumors
(A) Schematic showing an example of 3 geometric pattern types in collagen architecture: endpoint voxels, blue circles, indicate sites with <2 neighboring voxels; slab voxels, orange circles, indicate sites with 2 neighboring voxels; junction voxels, purple circles, indicate sites with >2 neighboring voxels (image created with BioRender.com). (B–E) SHG microscopy visualizing collagen fibril structures in the xenograft model. Representative images displaying collagen topology architecture in simple gland, EIN, and adenocarcinoma (B), scale bars: 50 μm. JV, junction voxels; SV, slab voxels; EDV, endpoint voxels. Collagen signatures were quantified by intensity (C), number of branches (D), and structural diversity (E, Shannon’s index) in the 3 histological types of the xenograft model. Quantitative analysis (C–E) was performed by randomly selecting n = 5 fields for intensity analysis and n = 4 images for the analysis of number of branches and Shannon’s index. Data are represented by mean ± SD, and p values were calculated using ANOVA test. (F–I) SHG imaging collagen structural analysis was also performed in non-cancerous endometrial tissues and tumors from endometrial cancer patients. (F) Representative images displaying collagen fibril architecture in non-cancerous tissue and primary tumors collected from normal weight (NW) patients or patients with obesity; scale bars: 50 μm. Collagen signatures were analyzed by intensity (G), number of branches (H), and Shannon’s index (I). Quantitative analysis (G–I) was performed by randomly selecting n = 5 fields for intensity analysis and n = 4 images for the analysis of number of branches and Shannon’s index. Data are represented by mean ± SD, and p values were calculated using ANOVA test.

References

    1. Onstad MA, Schmandt RE, and Lu KH (2016). Addressing the Role of Obesity in Endometrial Cancer Risk, Prevention, and Treatment. J. Clin. Oncol. 34, 4225–4230. 10.1200/JCO.2016.69.4638. - DOI - PMC - PubMed
    1. Setiawan VW, Yang HP, Pike MC, McCann SE, Yu H, Xiang YB, Wolk A, Wentzensen N, Weiss NS, Webb PM, et al. (2013). Type I and II endometrial cancers: have they different risk factors? J. Clin. Oncol. 31, 2607–2618. 10.1200/JCO.2012.48.2596. - DOI - PMC - PubMed
    1. Zhang T, Tseng C, Zhang Y, Sirin O, Corn PG, Li-Ning-Tapia EM, Troncoso P, Davis J, Pettaway C, Ward J, et al. (2016). CXCL1 mediates obesity-associated adipose stromal cell trafficking and function in the tumour microenvironment. Nat. Commun. 7, 11674. 10.1038/ncomms11674. - DOI - PMC - PubMed
    1. Lin LL, Kost ER, Lin CL, Valente P, Wang CM, Kolonin MG, Daquinag AC, Tan X, Lucio N, Hung CN, et al. (2020). PAI-1-dependent inactivation of SMAD4-modulated junction and adhesion complex in obese endometrial cancer. Cell Rep. 33, 108253. 10.1016/j.celrep.2020.108253. - DOI - PMC - PubMed
    1. Polusani SR, Huang YW, Huang G, Chen CW, Wang CM, Lin LL, Osmulski P, Lucio ND, Liu L, Hsu YT, et al. (2019). Adipokines deregulate cellular communication via epigenetic repression of gap junction loci in obese endometrial cancer. Cancer Res. 79, 196–208. 10.1158/0008-5472.CAN-18-1615. - DOI - PMC - PubMed

Publication types

MeSH terms

LinkOut - more resources