. 2024 Aug 27;43(8):114532.
doi: 10.1016/j.celrep.2024.114532. Epub 2024 Jul 23.

Alterations of ceramide synthesis induce PD-L1 internalization and signaling to regulate tumor metastasis and immunotherapy response

Affiliations

Alterations of ceramide synthesis induce PD-L1 internalization and signaling to regulate tumor metastasis and immunotherapy response

Wyatt Wofford et al. Cell Rep. .

Abstract

Programmed death ligand 1, PD-L1 (CD274), facilitates immune evasion and exerts pro-survival functions in cancer cells. Here, we report a mechanism whereby internalization of PD-L1 in response to alterations of bioactive lipid/ceramide metabolism by ceramide synthase 4 (CerS4) induces sonic hedgehog (Shh) and transforming growth factor β receptor signaling to enhance tumor metastasis in triple-negative breast cancers (TNBCs), exhibiting immunotherapy resistance. Mechanistically, data showed that internalized PD-L1 interacts with an RNA-binding protein, caprin-1, to stabilize Shh/TGFBR1/Wnt mRNAs to induce β-catenin signaling and TNBC growth/metastasis, consistent with increased infiltration of FoxP3+ regulatory T cells and resistance to immunotherapy. While mammary tumors developed in MMTV-PyMT/CerS4-/- were highly metastatic, targeting the Shh/PD-L1 axis using sonidegib and anti-PD-L1 antibody vastly decreased tumor growth and metastasis, consistent with the inhibition of PD-L1 internalization and Shh/Wnt signaling, restoring anti-tumor immune response. These data, validated in clinical samples and databases, provide a mechanism-based therapeutic strategy to improve immunotherapy responses in metastatic TNBCs.

Keywords: CP: Cancer; CP: Metabolism; CerS4; PD-L1; ceramide; immunotherapy; metastasis; sonic hedgehog; sphingolipid.


Conflict of interest statement

Declaration of interests The authors declare no competing interests.

Figures

Figure 1.
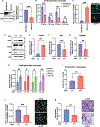
Figure 1.. shRNA-mediated CerS4 knockdown activates Shh and TGFBR1 signaling
(A) Shh protein abundance in SCR or CerS4 shRNA-transfected 4T1 cells was detected in western blots. Data quantification is shown in right panel (n = 3). (B) ELISA detected shh protein in the cell-culture supernatant from SCR or CerS4 shRNA-transfected 4T1 cells (n = 4). (C) Representative images of migration assay measured in fibronectin-coated Boyden chambers (n = 3). Scale bars, 10 μm. (D) Interaction of Shh and PTCH1 was detected by a co-immunoprecipitation with a Shh-targeting antibody and blotting for Shh and PTCH1 in 4T1 cells stably transfected with SCR or CerS4 shRNA (n = 2). Data quantification is shown in right panel. (E) Effect of exogenous shh ligand (100–200 μg/mL) on cellular migration in 4T1 cells stably expressing SCR or CerS4 shRNA (n = 3). (F) Effect of a neutralizing SMO and pSMO targeting antibody on cellular migration in 4T1 cells stably expressing SCR or CerS4 shRNA. Data quantification isshown in right panel (n = 3). Scale bars, 10 μm. (G) Effect of exogenous shh ligand (200 μg/mL) on cellular migration in 4T1 cells stably expressing SCR or CerS4 shRNA with or without neutralizing pSMO antibody treatment (n = 2). (H) TGFBR1 protein abundance in SCR or CerS4 shRNA-transfected 4T1 cells was detected by western blot. Data quantification is shown in lower panel (n = 4). (I) Interaction of pSmo and TGFBR1 proteins was measured using a PLA in 4T1 cells stably expressing SCR or CerS4 shRNA with or without neutralizing pSMO antibody treatment. Data quantification is shown in right panel (n = 3). Scale bars, 5 μm. (J) Cell-surface expression of SMO and TGFBR1 were determined using flow cytometry in 4T1 cells stably expressing SCR or CerS4 shRNA (n = 3). Data represent means ± SD; Student’s t test or two-way ANOVA was used to determine significance: *p < 0.05, **p < 0.01, ***p < 0.001, ****p < 0.0001; ns, not significant.
Figure 2.
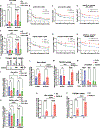
Figure 2.. CerS4 knockdown results in the internalization of PD-L1 to enhance breast cancer cell migration
(A) PD-L1 protein abundance in SCR or CerS4 shRNA-transfected 4T1 cells was detected in western blots (n = 2). (B) Plasma membrane proteins were isolated from 4T1 cells stably expressing SCR or CerS4 shRNA, and PD-L1 abundance was detected by western blotting. Na+/K+ ATPase (ATP1A1) was a loading control for the plasma membrane fraction (n = 2). (C) Cell-surface expression of PD-L1 (percentage of positive cells and mean fluorescent intensity) was determined by flow cytometry in 4T1 cells stably expressing SCR or CerS4 shRNA after treatment with 100 μg/mL IFN-γ for 48 h (n = 3). (D) Immunofluorescence was performed in 4T1 cells stably expressing SCR or CerS4 shRNA using anti-PD-L1 and anti-clathrin heavy chain (CLTC) antibodies(n = 3). Data quantification is shown in lower panel. Scale bars, 10 μm. (E) Cell-surface expression of PD-L1 was determined by flow cytometry in 4T1 cells stably expressing SCR or CerS4 shRNA with or without treatment withPitStop2 (30 μM for 1 h) (n = 6). (F) Effect of PitStop2 (5 μM for 24 h) on cellular migration in 4T1 cells stably expressing SCR or CerS4 shRNA. Data quantification is shown in right panel (n = 3). Scale bars, 10 μm. (G) Interaction of PD-L1 and caprin-1 was detected by co-immunoprecipitation and western blotting in 4T1 cells stably transfected with SCR or CerS4 shRNAs. Data quantification is shown in right panel (n = 3). (H) Effect of PitStop2 treatment (30 μM for 1 h) on PD-L1 and caprin-1 in 4T1 cells stably expressing SCR or CerS4 shRNA was determined by co-immunoprecipitation (n = 3). Data quantification is shown in right panel. (I) Caprin-1 and CerS4 protein abundance in 4T1 cells stably expressing either SCR or caprin-1 shRNA in the presence of SCR or CerS4 shRNA was detected by western blotting (n = 3). (J) Effect of caprin-1 expression on the cellular migration of 4T1 cells stably transfected with SCR and CerS4 shRNA or SCR and caprin-1 shRNA was determined (n = 3). (K) Cell-surface expression of PD-L1 was determined by flow cytometry in 4T1 cells stably expressing SCR or CerS4 shRNA and SCR or caprin-1 shRNA (n = 3). (L) Cell-surface expression of WT-PD-L1-FLAG vs. Mut-PD-L1-FLAG was determined by flow cytometry in 4T1 cells stably expressing SCR or CerS4 shRNA (n = 3). (M) The effect of WT-PD-L1-FLAG vs. Mut-PD-L1-FLAG on the cellular migration of 4T1 cells stably transfected with SCR and CerS4 shRNAs was determined. Data quantification is shown in right panel (n = 3). Scale bars, 10 μm. (N) Interaction between WT-PD-L1-FLAG vs. Mut-PD-L1-FLAG (with S278A/S279A conversions) and caprin-1 using a PLA assay in 4T1 cells stably transfected with SCR and CerS4 shRNAs using anti-FLAG and anti-caprin-1 antibodies. Data quantification is shown in right panel (n = 2). Scale bars, 10 μm. Data represent means ± SD; Student’s t test or two-way ANOVA was used to determine significance: *p < 0.05, **p < 0.01, ***p < 0.001, ****p < 0.0001; ns, not significant.
Figure 3.
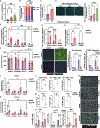
Figure 3.. Ectopic expression of CerS4 restores C18/C20-ceramide generation and surface PD-L1 accumulation
(A) CerS4 protein abundance in MDA-MB-231 and LM2-4175 cells was detected by western blotting. Data quantification is shown in right panel (n = 3). (B) The abundance of CerS4-generated ceramides in MDA-MB-231 and LM2-4175 cells was determined using LC-MS/MS-based lipidomics analysis (n = 3). (C) Interaction between PD-L1 and caprin-1 was detected by PLA using anti-PD-L1 and anti-caprin-1 antibodies in MDA-MB-231 and LM2-4175 cells. Data quantification is shown in left panel (n = 3). Scale bars, 20 μm. (D–G) CerS4 (D and E), Shh (F), and TGFBR1 (G) abundance was determined in doxycycline-inducible CerS4 expression LM2-4175 cells after 48 h in 5 μg/mL doxycycline detected by western blotting using an anti-CerS4, anti-TGFBR1, and anti-Shh antibodies. Data quantification is shown in right panels (n = 3). (H) The abundance of CerS4-generated ceramides in doxycycline-inducible CerS4 expression LM2-4175 cells was determined using LC-MS/MS-based lipidomics analysis. The raw values were normalized to the control conditions for each ceramide species (n = 3). (I) Cell-surface expression of PD-L1 was determined by flow cytometry in doxycycline-inducible CerS4 expression LM2-4175 cells after 48 h in 5 μg/mL doxycycline (n = 3). (J) Interaction between PD-L1 and caprin-1 was detected by PLA using anti-PD-L1 and anti-caprin-1 antibodies in doxycycline-inducible CerS4 expression LM2-4175 cells after 48 h in 5 μg/mL doxycycline. Data quantification is shown in left panel (n = 3). Scale bars, 20 μm. (K) Cellular migration was measured in doxycycline-inducible CerS4 expression LM2-4175 cells after 48 h in 5 μg/mL doxycycline. Data quantification is shown in left panel (n = 3). Scale bars, 10 μm. Data represent means ± SD; Student’s t test was used to determine significance: *p < 0.05, **p < 0.01, ***p < 0.001, ****p < 0.0001; ns, not significant.
Figure 4.
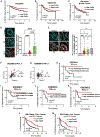
Figure 4.. The PD-L1/caprin-1 complex stabilizes Shh and TGFBR1 mRNAs to induce cell migration
(A) Interaction between caprin-1 and Shh mRNA was quantified using RNA-immunoprecipitation coupled RT-qPCR in 4T1 cells stably expressing SCR or CerS4 shRNA with empty vector, WT-PD-L1-FLAG, or Mut-PD-L1-FLAG overexpressed (n = 3). (B–D) Stability of Shh mRNA was determined in 4T1 cells stably expressing SCR or CerS4 shRNA with empty vector, WT-PD-L1-FLAG, or Mut-PD-L1-FLAG overexpressed along with actinomycin D (5 μg/mL) treatment (n = 3). (E) Interaction between caprin-1 and TGFBR1 mRNA was quantified using RNA-immunoprecipitation coupled RT-qPCR with an anti-caprin-1 antibody in 4T1 cells stably expressing SCR or CerS4 shRNA with empty vector, WT-PD-L1-FLAG, or Mut-PD-L1-FLAG overexpressed (n = 3). (F–H) Stability of TGFBR1 mRNA was determined in 4T1 cells stably expressing SCR or CerS4 shRNA with empty vector, WT-PD-L1-FLAG, or Mut-PD-L1-FLAG overexpressed along with actinomycin D (5 μg/mL) treatment (n = 3). (I) Abundance and immunoprecipitation of EXOSC10 were determined by western blotting in 4T1 cells stably expressing SCR or CerS4 shRNA (n = 2). (J and K) Interaction between EXOSC10 and Shh (J) or TGFBR1 (K) mRNA was quantified using RNA-immunoprecipitation coupled RT-qPCR with an anti-EXOSC10 antibody in 4T1 cells stably expressing SCR or CerS4 shRNA with empty vector, WT-PD-L1-FLAG, or Mut-PD-L1-FLAG overexpressed (n = 3). (L and M) The interaction between EXOSC10 and Shh (L) or TGFBR1 (M) mRNA was quantified using RNA-immunoprecipitation coupled RT-qPCR with an anti-EXOSC10 antibody in 4T1 cells stably expressing SCR or CerS4 shRNA and SCR or caprin-1 shRNA (n = 3). (N) Expression of CerS4, Shh, and TGFBR1 was determined by RT-qPCR in doxycycline-inducible CerS4 expression LM2-4175 cells after 48 h in 5 μg/mL doxycycline (n = 3). (O and P) The interaction between EXOSC10 and Shh (O) or TGFBR1 (P) mRNA was quantified using RNA-immunoprecipitation coupled RT-qPCR with an anti-EXOSC10 antibody in doxycycline-inducible CerS4 expression LM2-4175 cells after 48 h in 5 μg/mL doxycycline (n = 3). Data represent means ± SD; one-way or two-way ANOVA was used to determine significance: *p < 0.05, **p < 0.01, ***p < 0.001, ****p < 0.0001; ns, not significant.
Figure 5.
Figure 5.. The CerS4/PD-L1/caprin-1 axis drives TNBC metastasis and is sensitive to pharmacological inhibition
(A–D) Primary mammary tumors and lungs were collected from MMTV-PyMT-CerS4+/+, -CerS4+/−, and -CerS4−/− mice after 150 days. (A) The number of metastatic lung nodules from MMTV-PyMT-CerS4+/+ (n = 12), -CerS4+/− (n = 10), and -CerS4−/− (n = 8) mice were quantified by an independent pathologist after H&E staining of lungs collected after 150 days. (B) The percentage of mice that developed lung metastasis was calculated. (C) Interaction between shh and PTCH1 was detected by PLA assay using anti-Shh and anti-PTCH1 antibodies in metastatic lung nodules from MMTV-PyMT-CerS4+/+ and MMTV-PyMT-CerS4−/− mice (n = 3). (D) Interaction between PD-L1 and caprin-1 was detected by PLA assay using anti-PD-L1 and anti-caprin-1 antibodies in metastatic lung nodules from MMTV-PyMT-CerS4+/+ and MMTV-PyMT-CerS4−/− mice. Quantification of data is shown in the left panel (n = 3). Scale bars, 10 μm. (E–O) 4T1-derived tumors stably expressing SCR or CerS4 shRNA were established in BALB/c mice unilaterally. After 1 week, the mice were treated with vehicle (n = 6 SCR and n = 5 CerS4), sonidegib (n = 4 SCR and n = 4 CerS4), anti-PD-L1 therapy (n = 5 SCR and n = 6 CerS4), or a combination (n = 5 SCR and n = 6 CerS4) for 21 days. (E) The total area of lung metastasis was determined using Akoya Inform analysis software. (F) Endpoint primary tumors were collected and weighed. (G and H) The interaction between PD-L1 and caprin-1 (G) and Shh and PTCH1 (H) was detected by PLA assay using anti-PD-L1 and anti-caprin-1 or anti-Shh and anti-PTCH-1 antibodies, respectively, in primary tumors from the vehicle, anti-PD-L1, or combination groups (n = 4). (I) The expression of Shh and TGFBR1 in primary tumors from the vehicle or combination groups was determined by multiplexed immunofluorescence using anti-Shh and anti-TGFBR1 antibodies. Data quantification is shown in right panels (n = 4). Scale bars, 20 μm. (J and K) The expression of Wnt5b (J) and TCF7L2 (K) in primary tumors was determined by RT-qPCR on tumors from vehicle (n = 6 SCR and n = 6 CerS4), sonidegib (n = 5 SCR and n = 5 CerS4), anti-PD-L1 therapy (n = 4 SCR and n = 6 CerS4), or a combination (n = 5 SCR and n = 6 CerS4). (L) 4T1 allografts stably expressing SCR (n = 8) or CerS4 (n = 8) shRNA were established in BALB/c mice unilaterally. Tumors were collected after 21 days. Immune cells were characterized in the tumor microenvironment using spectral flow cytometry. (M) Tumor-infiltrating lymphocytes (TILs) were isolated from shSCR (n = 6) or shCerS4-transfected (n = 6) tumors from (L). TILs were cultured with anti-CD3 and anti-CD28 for 24 h before being treated with Golgi-stop for 3 h and processed for spectral flow cytometry. (N) Tumor-infiltrating lymphocytes (TILs) were analyzed in primary tumors from the vehicle or combination groups by performing multiplexed immunofluorescence using anti-CD3, anti-CD8, anti-FoxP3, and anti-PanCK antibodies. Scale bars, 20 μm. (O) Quantification of TIL populations counted from mulitplexed immunofluoresence shown in (N) is shown in lower panels (n = 4). Data represent means ± SD; tumor growth data and metastasis quantification, means ± SEM; data from (L) and (M), means ± interquartile range. Student’s t test, two-way ANOVA, or one-way ANOVA were used to determine significance: *p < 0.05, **p < 0.01, ***p < 0.001, ****p < 0.0001; ns, not significant.
Figure 6.
Figure 6.. The CerS4/PD-L1/caprin-1 axis inhibition sensitizes TNBC tumors to immunotherapy
Metastatic PyMT tumors were established in FVB mice. After the tumors had formed, the mice were treated with vehicle, sonidegib, anti-PD-L1 therapy, or a combination for 28 days. (A) Primary tumors were measured with calipers twice weekly, and tumor volumes were calculated (n = 6). (B) Interaction between PD-L1 and caprin-1 was detected by PLA assay using anti-PD-L1 and anti-caprin-1 antibodies in primary tumors (n = 3). Scale bars, 10 μm. (C) Pathway enrichment for Wnt/B-catenin signaling was performed after bulk RNA sequencing of the primary tumors using a suite of Wnt/B-catenin-relatedgenes (n = 4). (D) Pathway enrichment for IFN-γ response, inflammatory response, and positive regulation of cell killing was performed after bulk RNA sequencing of the primary tumors (n = 4). (E) Immune cells in the primary tumor were analyzed by performing multiplexed immunofluorescence using anti-CD3, anti-CD8, anti-FoxP3, anti-CD86, and anti-PanCK antibodies (n = 4). Data quantification is shown in right panels. Scale bars, 50 μm. Data represent means ± SD, tumor growth data represent means ± SEM; one-way ANOVA was used to determine significance: *p < 0.05, **p < 0.01, ***p < 0.001, ****p < 0.0001; ns, not significant.
Figure 7.
Figure 7.. Clinical relevance of the CerS4-dependent PD-L1/caprin-1 and Shh/Wnt signaling alterations
(A) Kaplan-Meier survival curve representing the percentage of distant relapse-free survival in breast cancer patients from GSE25066 (n = 507) separated based on low vs. high CerS4 mRNA expression. (B) Kaplan-Meier survival curve representing the percentage of disease-free survival in breast cancer patients from GSE21653 (n = 248). (C) Kaplan-Meier survival curve representing the percentage relapse-free survival in breast cancer patients from KM-Plotter (n = 4,890). (D and E) Interaction between PD-L1 and caprin-1 was detected by PLA using anti-PD-L1 and anti-caprin-1 antibodies in a commercially available tissue microarray containing normal breast tissue (n = 4 patients) and TNBC primary tumors (n = 62 patients). Two images were taken per tissue core, and two cores were present per patient sample. (D) Interaction between PD-L1 and caprin-1 was quantified in normal breast tissue (n = 4), lymph-node-negative primary tumors (N0, n = 42), and lymph-node-positive primary tumors (N1–N3, n = 20). Scale bars, 10 μm. (E) Interaction between PD-L1 and caprin-1 was quantified in normal breast tissue (n = 4), stage 2 primary tumors (T2, n = 42), stage 3 primary tumors (T3, n = 12), and stage 4 primary tumors (T4, n = 8). Scale bars, 10 μm. (F and G) Correlation analysis of caprin-1 mRNA expression and Shh score in TNBC patients from GSE58812 (n = 53 for PD-L1+ [F], and n = 54 for PD-L1 [G]). (H) Kaplan-Meier survival curve representing the percentage metastasis-free survival in PD-L1+ TNBC patients from GSE58812 (n = 24) separated based on low vs. high CerS4 mRNA and Shh score. (I–K) Kaplan-Meier survival curves representing the percentage metastasis-free survival in PD-L1+ TNBC patients from GSE58812 (n = 20) separated based on low vs. high Cers4 and CTNNB1 (I), Wnt5b (J), or TCF7L2 (K) mRNA levels. (L and M) Kaplan-Meier survival curves representing the percentage overall survival (L) and progression-free survival (M) in cancer patients treated with PD-L1 immunotherapy (n = 459 for overall survival and n = 138 for progression-free survival) separated based on low vs. high CerS4 mRNA expression. One-way ANOVA or log-rank test was used to determine significance: *p < 0.05, **p < 0.01, ***p < 0.001, ****p < 0.0001; ns, not significant.

References

    1. Wells A, Grahovac J, Wheeler S, Ma B, and Lauffenburger D (2013). Targeting tumor cell motility as a strategy against invasion and metastasis. Trends Pharmacol. Sci. 34, 283–289. 10.1016/j.tips.2013.03.001. - DOI - PMC - PubMed
    1. Muthuswamy SK (2021). Self-organization in cancer: Implications for histopathology, cancer cell biology, and metastasis. Cancer Cell 39, 443–446. 10.1016/j.ccell.2021.01.010. - DOI - PubMed
    1. Jakowlew SB (2006). Transforming growth factor-beta in cancer and metastasis. Cancer Metastasis Rev. 25, 435–457. 10.1007/s10555-006-9006-2. - DOI - PubMed
    1. Xu J, Acharya S, Sahin O, Zhang Q, Saito Y, Yao J, Wang H, Li P, Zhang L, Lowery FJ, et al. (2015). 14–3-3ζ turns TGF-β’s function from tumor suppressor to metastasis promoter in breast cancer by contextual changes of Smad partners from p53 to Gli2. Cancer Cell 27, 177–192. 10.1016/j.ccell.2014.11.025. - DOI - PMC - PubMed
    1. Riaz SK, Ke Y, Wang F, Kayani MA, and Malik MFA (2019). Influence of SHH/GLI1 axis on EMT mediated migration and invasion of breast cancer cells. Sci. Rep. 9, 6620. 10.1038/s41598-019-43093-x. - DOI - PMC - PubMed

Publication types

LinkOut - more resources