. 2024 Aug 27;43(8):114523.
doi: 10.1016/j.celrep.2024.114523. Epub 2024 Jul 23.

Misaligned feeding uncouples daily rhythms within brown adipose tissue and between peripheral clocks

Affiliations

Misaligned feeding uncouples daily rhythms within brown adipose tissue and between peripheral clocks

Victoria A Acosta-Rodríguez et al. Cell Rep. .

Abstract

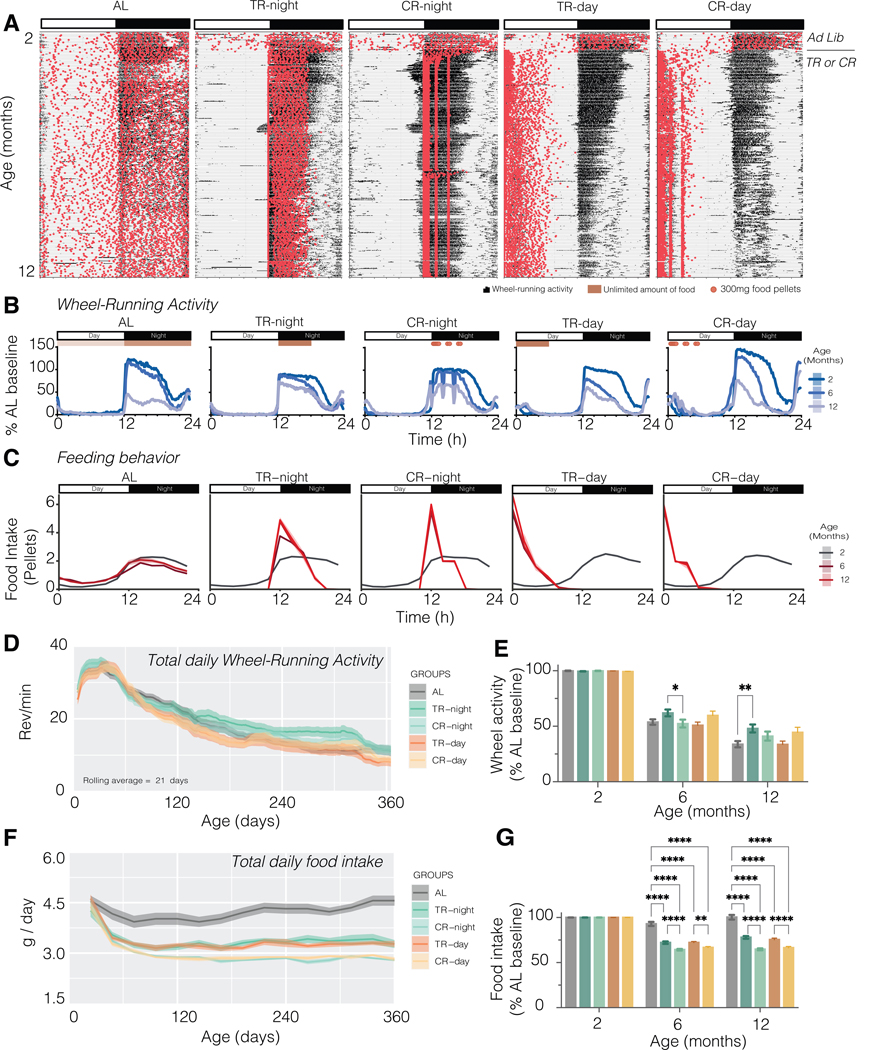
Extended food consumption during the rest period perturbs the phase relationship between circadian clocks in the periphery and the brain, leading to adverse health effects. Beyond the liver, how metabolic organs respond to a timed hypocaloric diet is largely unexplored. We investigated how feeding schedules impacted circadian gene expression in epididymal white and brown adipose tissue (eWAT and BAT) compared to the liver and hypothalamus. We restricted food to either daytime or nighttime in C57BL/6J male mice, with or without caloric restriction. Unlike the liver and eWAT, rhythmic clock genes in the BAT remained insensitive to feeding time, similar to the hypothalamus. We uncovered an internal split within the BAT in response to conflicting environmental cues, displaying inverted oscillations on a subset of metabolic genes without modifying its local core circadian machinery. Integrating tissue-specific responses on circadian transcriptional networks with metabolic outcomes may help elucidate the mechanism underlying the health burden of eating at unusual times.

Keywords: CP: Metabolism; brown adipose tissue; caloric restriction; circadian clocks; dietary interventions; liver; misaligned feeding; mouse behavior; time-restricted feeding.


Conflict of interest statement

Declaration of interests The authors declare no competing interests.

Figures

Figure 1.
Figure 1.. Effects of TR and CR on wheel-running and feeding activities in C57BL/6J male mice.
(A) Representative activity recordings (actograms) from each experimental group. Overlay showing wheel-running (black histograms) and feeding (red dots) behaviors throughout the day (x-axis) across multiple months (y-axis). All mice were on ad lib feeding for the first three weeks as baseline for endogenous and unrestricted behavior. Line on the right of the actograms denotates the onset of TR and CR. Bars above the actograms represent the 12h light (daytime, white) and 12h dark (nighttime, black). (B-C) 24h profile of the wheel-running activity (B) and food intake (C) at three different ages (averaged over 21 days, n=72 until 6 months of age and n=48 at 12 months of age) for each group. Bars above the plot indicate the light/dark cycle (white and black) and red dots represent the imposed feeding schedule. (D) Daily wheel-running activity (average revolutions/min over 24 hours ± SE) throughout the experiment. (E) Wheel-running activity normalized by individual ad lib baseline (averaged every 21 days, n=72 mice). (F) Food intake per day for each group throughout the study. Dark line is average and gray shading is SE for each group. Both CR groups were limited to 70% of ad lib consumption (10 food pellets of 300 mg each per day, total of 3 g/day) for the first 3 weeks ad lib baseline of age and was not readjusted throughout the experiment. (G) Percentage of daily food intake relative to the ad lib baseline per mouse (averaged every 21 days and per group, n=72 mice). Statistical differences were determined by one-way ANOVA followed multiple comparisons (Kruskal-Wallis test, non-parametric data; E and G).
Figure 2.
Figure 2.. Metabolic responses to dietary interventions varying calories and feeding/fasting cycles.
(A) Body weights trajectories of mice in all five groups (mean ± SE, n = 48 mice / group) measured every 3 weeks throughout the experiment. (B) Blood glucose levels measured every 4h throughout 24h at 8 months of age under a 12h light: 12h dark cycle. Each timepoint represents an average of different set of mice (mean ± SE, n = 4 mice / timepoint / group). (C) Daily profile of insulin measured every 4h over 48h at 6 months of age in constant darkness. Each timepoint represents an average of different set of mice (mean ± SE, n = 4 mice / timepoint / group), in which day1 and day2 are plotted together. Statistical differences were determined by one-way ANOVA followed multiple comparisons (Kruskal-Wallis test, non-parametric data; A-C).
Figure 3.
Figure 3.. Feeding time shifts the rhythmic profile of gene expression in the liver.
(A) 24h rhythms in gene expression from mRNA-seq were analyzed using three independent cycling algorithms, ARSER, JTK_CYCLE and RAIN. Every cycling gene meets the criteria of having at least two of three algorithms with FDR (BH-q value) < 0.05 and Log2FC > 0.3 (daily amplitude). Heatmaps (top) sorted by peak of gene expression (phase). Each row represents the z-scored expression level of a single gene across 12 time points taken every 4h over 2 days in constant darkness (columns). (B) Histogram represents the number of genes peaking at specifics times of the day (phase distribution with a 1h histogram bin resolution). (C) Pairwise comparison of phase for common genes cycling on each restricted group (TR and CR) vs AL (top). Phase shifts each gene experience under restricted feeding vs AL as circular histogram (Rosa plot, middle panel). Red dots in the bottom panel represent the phase shift for individual genes (Rayleigh plot). Rayleigh tests statistically (P-value < 0.05), whether all genes shift in the same direction. (D) Examples of rhythmic profiles of genes that are rhythmic in at least one of the five feeding conditions tested (green = night eaters AL, CR-night, and TR-night; orange = day eaters, CR-day and TR-day). Four main groups were detected: 1-opposite phases for day vs night eaters (follow feeding cues), 2- same phase for day and night eaters (insensitive feeding cues), 3- rhythms lost under daytime feeding, 4- rhythms gained after daytime feeding. (E) Gene ontology terms of genes that are cycling in any of the 5 feeding conditions tested. Represented are 10 nonredundant of the top 25 most significant enriched terms.
Figure 4.
Figure 4.. Feeding time induces tissue-specific responses in peripheral clocks.
(A) Rhythmic gene expression of core clock genes (Dbp, Rev-Erba, Per2 and Bmal1) measured by RT-qPCR of mouse tissues collected every 4h during 2 days in constant darkness (n=2 mice x 12 timepoints x 5 feeding condition, total of 24 samples/feeding) for all five feeding groups. Relative mRNA expression levels were calculated based on the ΔCT method using Gapdh as reference gene and relative to the mean expression across all timepoints. (B) Daily gene expression for major metabolic genes in the brown adipose tissues measured by RT-qPCR, representing genes whose 24h profile remained insensitive to feeding time (Ucp1, Ucp3, Pgc1a and Nampt) or shifted their peak of expression by 12h consistently with the unusual daytime feeding. (C) Summary of the tissue-specific responses observed in the 4 tissues tested. Expression of core clock genes remains insensitive to changes in feeding time in the hypothalamus, both liver and WAT completely shifts the expression profiles following feeding cues, and the brown adipose tissue has both types of responses.
Figure 5.
Figure 5.. Daytime feeding leads to an internal misalignment within the BAT.
(A) 24h rhythms in gene expression from mRNA-seq were analyzed using three independent cycling algorithms, ARSER, JTK_CYCLE and RAIN. Every cycling gene meets the criteria of having at least two out of three algorithms with FDR (BH-q value) < 0.05 and Log2FC > 0.3. Heatmaps (top) sorted by peak of gene expression (phase). Each row represents the z-scored expression level of a single gene across 12 time points taken every 4h over 2 days in constant darkness (columns). Venn diagrams represents the number of cycling genes that are shared or unique for AL and CR-day groups. (B) Phase distribution of cycling genes, represented as a histogram with the number of genes peaking at specifics times of the day (1h histogram bin resolution). (C) Circadian amplitude (daily fold-change) of the 242 genes that were rhythmic in both feeding groups. Density plots (left) indicate there is no statistical differences in the distribution of amplitudes between AL and CR-day. Correlation plots (right) with red line representing Spearman correlation and slope of linear regression not statistically different from 1, (p > 0.05) in the fold change comparison. Both statistical tests indicate that there is no difference in amplitude of rhythmic genes shared by AL vs CR-day. (D) Pairwise comparison of phase for common genes cycling between AL and CR-day (left). Phase shifts each gene experience under CR-day vs AL as circular histogram (Rosa plot, middle panel). Red dots in the bottom panel represent the phase shift for individual genes (right, Rayleigh plot). Rayleigh tests statistically (P-value < 0.05), whether all genes shift in the same direction. (F) Gene ontology terms of genes that are cycling in both AL and CR-day (242 common genes). Represented are all 17 significant enriched terms. (F) Examples of rhythmic profiles of genes that are rhythmic in at least one of the two feeding conditions tested (grey = AL; yellow = CR-day) that belong to 3 KEGG pathways. Two main groups are represented detected within the same pathways: 1-opposite phases for day vs night eaters (follow feeding cues), 2- same phase for day and night eaters (insensitive feeding cues).
Figure 6.
Figure 6.. Models for internal splitting of rhythmic gene expression in the BAT.
Two possibilities may explain the internal misalignment in BAT when mice are exposed to conflicting signals (i.e. daytime feeding in nocturnal animals). Model 1 proposes that there are two distinct groups of cells within the BAT. One group of cells are sensitive to feeding cues (Cell A, yellow), whereas the other group maintains clock or activity-driven information (Cell B, blue). If model 1 were true, then we would expect that under disrupted (daytime) feeding, only food-cells would shift the profile of gene expression. As consequence, bulk RNA-seq results for this gene will show a constant flat expression throughout the day, which is inconsistent with our results. Model 2 proposes that each adipocyte can respond to both feeding and clock cues and is their internal genes that are differentially regulated by those signals. In this case, some genes respond to nutrient availability (gene X, yellow) but other group of genes preferentially respond to clock-driven signals (gene Y, blue). As result, BAT rhythmic transcriptome splits under disrupted daytime feeding. This is because only geneX will change their expression while geneY will maintain the same phase as a nocturnal fed mouse. Model 2 seems to be more consistent with our bulk RNA-seq results.

References

    1. Acosta-Rodriguez VA, Rijo-Ferreira F, Green CB, and Takahashi JS (2021). Importance of circadian timing for aging and longevity. Nat Commun 12, 2862. 10.1038/s41467-021-22922-6. - DOI - PMC - PubMed
    1. Rijo-Ferreira F, and Takahashi JS (2019). Genomics of circadian rhythms in health and disease. Genome Med 11, 82. 10.1186/s13073-019-0704-0. - DOI - PMC - PubMed
    1. Takahashi JS (2017). Transcriptional architecture of the mammalian circadian clock. Nat Rev Genet 18, 164–179. 10.1038/nrg.2016.150. - DOI - PMC - PubMed
    1. Green CB, Takahashi JS, and Bass J (2008). The meter of metabolism. Cell 134, 728–742. 10.1016/j.cell.2008.08.022. - DOI - PMC - PubMed
    1. Bass J, and Takahashi JS (2010). Circadian integration of metabolism and energetics. Science 330, 1349–1354. 10.1126/science.1195027. - DOI - PMC - PubMed

Publication types