. 2024 Jul 30;121(31):e2321929121.
doi: 10.1073/pnas.2321929121. Epub 2024 Jul 24.

Iron regulatory protein 2 contributes to antimicrobial immunity by preserving lysosomal function in macrophages

Affiliations

Iron regulatory protein 2 contributes to antimicrobial immunity by preserving lysosomal function in macrophages

Chen Cheng et al. Proc Natl Acad Sci U S A. .

Abstract

Colorectal cancer and Crohn's disease patients develop pyogenic liver abscesses due to failures of immune cells to fight off bacterial infections. Here, we show that mice lacking iron regulatory protein 2 (Irp2), globally (Irp2-/-) or myeloid cell lineage (Lysozyme 2 promoter-driven, LysM)-specifically (Irp2ΔLysM), are highly susceptible to liver abscesses when the intestinal tissue was injured with dextran sodium sulfate treatment. Further studies demonstrated that Irp2 is required for lysosomal acidification and biogenesis, both of which are crucial for bacterial clearance. In Irp2-deficient liver tissue or macrophages, the nuclear location of transcription factor EB (Tfeb) was remarkably reduced, leading to the downregulation of Tfeb target genes that encode critical components for lysosomal biogenesis. Tfeb mislocalization was reversed by hypoxia-inducible factor 2 inhibitor PT2385 and, independently, through inhibition of lactic acid production. These experimental findings were confirmed clinically in patients with Crohn's disease and through bioinformatic searches in databases from Crohn's disease or ulcerative colitis biopsies showing loss of IRP2 and transcription factor EB (TFEB)-dependent lysosomal gene expression. Overall, our study highlights a mechanism whereby Irp2 supports nuclear translocation of Tfeb and lysosomal function, preserving macrophage antimicrobial activity and protecting the liver against invading bacteria during intestinal inflammation.

Keywords: HIF2; IRP2; TFEB localization; lactic acid; lysosomal function.


Conflict of interest statement

Competing interests statement:The authors declare no competing interest.

Figures

Fig. 1.
Fig. 1.
Liver abscesses are induced by DSS treatment in Irp2 KO mice. (A) Diagram showing the timing (in days) of treatment applications in the mouse model. (B) Survival plot of the animals during the treatment period (n = 30). (C) Body weight changes during the treatment period (initially n = 30, but some animals deceased). (D) Serum parameters for liver function. (E) The appearance of the liver of WT and Irp2−/− mice 17 d after initiation of DSS exposure. The white arrows indicated the sites of pus-filled lesions. (F) H&E staining of liver tissue. (G) Gram-staining of the liver. (H) Bacterial growth on blood agar plates from the liver, portal vein, and peripheral blood. (I) Quantification of the numbers of bacterial colonies in liver and portal vein blood after DSS exposure. n = 5/group if not specified. Data are presented as means ± SD. **P < 0.01, ***P < 0.001, ****P < 0.0001. ns: no significance. ALT, Alanine aminotransferase; AST, Aspartate aminotransferase; ALB, Albumin. White boxes indicate the enlarged regions.
Fig. 2.
Fig. 2.
Irp2 deficiency in macrophages promotes DSS-induced liver abscesses. (A) Diagram showing the strategy to generate Irp2ΔLysM mice. (B) Representative Western blotting demonstrating the Irp2 KO in BMDM isolated from Irp2ΔLysM and Irp2flox/flox mice. (C) Survival plot (n = 30). The experimental procedure was the same as in Fig. 1A. (D) Body weight changes post-DSS drinking (initially n = 30). (E) The appearance of the representative livers from WT and Irp2ΔLysM mice with or without DSS treatment. White arrows indicated the sites of liver abscesses. (F) H&E staining of the liver sections. (G) Gram-positive staining with the liver sections. (H) Bacterial growth on blood agar plates from the liver, portal vein, and peripheral blood. (I) Quantification of the number of bacteria in liver tissue and portal vein blood after DSS treatment. n = 5/group if not specified. Data are means ± SD. ****P < 0.0001. White boxes indicate the enlarged regions.
Fig. 3.
Fig. 3.
The increased bacterial load and decreased bacterial clearance of Irp2−/− macrophages were associated with macrophage defective lysosomal biogenesis and acidification when infection by E. coli. (A) Confocal images of BMDM and peritoneal macrophages that were infected with eGFP-expressing (E. coli-eGFP) or mCherry-expressing E. coli (E. coli-mCherry) with MOI = 50 for 1 h. E. coli that were not phagocytosed were removed by gentamicin (200 μg/mL for 30 min). (B) Quantification of fluorescence, representing E. coli-eGFP and E. coli-mCherry in BMDM and peritoneal macrophages. (C and D) Protein levels of lysosomal markers Lamp1 and Ctsb in BMDM (C) and peritoneal macrophages (D) after incubation with E. coli with MOI = 10 for 90 min. (E) Lamp1 expression levels in BMDM and peritoneal macrophages of WT and Irp2−/− mutant as revealed by immunofluorescence assays. (F) Quantification for E. (G) Lamp1 expression levels in BMDM and peritoneal macrophages of WT and Irp2−/− mice post–E. coli infection, revealed by immunofluorescence assays. MOI = 50 for 1 h. (H) Quantification for G. (I) Lysosomal acidification in BMDM and peritoneal macrophages as indicated by pH-dependent pHrodo fluorescence. (J) The quantification of the fluorescence intensity of pHrodo for I. *P < 0.05, **P < 0.01, ***P < 0.001, ****P < 0.0001. Scale bar, 20 μm.
Fig. 4.
Fig. 4.
Expression and nuclear localization of Tfeb decreases in Irp2−/− liver tissue and macrophages. (A and B) mRNA levels of the Mitf family members, Tfeb, Tfe3, and Mitf, and their target gene Atp6v0e2 in the liver of mice treated with DSS water (A) and in macrophage-like RAW264.7 cells postinfection by E. coli (B). (C and D) Protein levels of Tfeb and its target protein Lamp1 and Ctsb in the liver of DSS-treated mice (C) and in RAW264.7 cells postinfection by E. coli (D). (E and F) Nuclear and cytosolic Tfeb in WT and RAWIrp2KO cells before infection (E) and postinfection (F) with E. coli. MOI = 25 for 90 min. Results are expressed as means ± SD from three independent experiments. *P < 0.05, ***P < 0.001, ****P < 0.0001; ns: no significance.
Fig. 5.
Fig. 5.
Irp2 deficiency-induced lactate suppresses lysosomal biogenesis and function in RAW264.7 cells by inhibiting Tfeb nuclear localization. (A) Lactate contents in WT and Irp2-deficient mutant culture medium prior to and post–E. coli infection. (B) Retained E. coli-eGFP and E. coli-mCherry in WT and RAWIrp2KO cells pretreated with LdhA-specific inhibitor OXA (20 mM) for 30 min. (C and D) Western blots showing Tfeb and its target proteins following treatment with 5 mM lactic acid (LAC) prior to C and post–E. coli infection (D). (E and F) Protein levels of Tfeb and its target proteins posttreatment with 20 mM OXA prior to E and post–E. coli infection (F). (G and H) Nuclear and cytosolic Tfeb protein levels in WT treated with 5 mM lactic acid (G) or in Irp2 KO treated with 20 mM OXA (H) followed by E. coli infection. Results are expressed as means ± SD from three independent experiments. **P < 0.01, ***P < 0.001; ns: no significance.
Fig. 6.
Fig. 6.
Irp2 restrains Hif2α expression, promoting lysosomal biogenesis and function in the macrophage’s immune responses against bacterial infection. (A and B) Hif2α and LdhA protein levels in WT and Irp2−/− liver after DSS modeling (A) and in WT and RAWIrp2KO cells after E. coli infection (B), revealed by immunoblotting assays. (C) Retained E. coli-eGFP and E. coli-mCherry in WT and RAWIrp2KO cells, pretreated with Hif2 specific inhibitor PT2385. (D) Diagram of PT2385 administration during the treatment protocol. (E) Body weight changes following administration of PT2385 (initially n = 30). (F) Survival plot of the animals during the protocol’s duration (n = 30). (G) Gross appearance of representative livers from Irp2ΔLysM mice after treatment with PT2385 in the DSS-induced IBD model. White arrows indicate the sites of abscesses. (H) H&E staining of the liver. (I) Gram-positive staining of the liver. (J) Bacterial growth from the liver, portal vein blood, and peripheral blood on blood agar plates. n = 5/group if not specified. Data are presented as means ± SD. ****P < 0.0001.
Fig. 7.
Fig. 7.
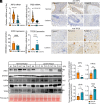
IRP2 expression is reduced in clinical samples from patients with Crohn’s disease or Ulcerative colitis. (A) mRNA levels of IRP2 and TFEB in nonlesion and lesion sections of Crohn’s disease patients (n = 10 to 20). (B) Immunohistochemical staining assays of IRP2 and TFEB protein in nonlesion and lesion sections of Crohn’s patients. (C) Quantification data of B by the index of mean optical density (MOD). (D) Protein levels of IRP2, HIF2α, LDHA, and TFEB in nonlesion and lesion regions, revealed by immunoblotting assays (Left) and quantified in the Right panel. N: nonlesion; P: patient; n = 6. *an unspecific band. GAPDH and Ponceau S staining: internal controls for total proteins. Results are expressed as means ± SD. *P < 0.05, **P < 0.01, ***P < 0.001, ****P < 0.0001.
Fig. 8.
Fig. 8.
A schematic model presenting IRP2 functions in macrophages leading to prevention from developing liver abscesses in the context of intestinal barrier injury. Irp2 preserves lysosomal biogenesis and function by regulating Tfeb nuclear localization in macrophages. Irp2 deficiency up-regulates Hif2a expression, which induces lactic acid production by targeting LdhA genes. The increased lactic acid mislocalizes Tfeb, a key transcription factor to regulate a series of lysosome genes. Thus, macrophage lysosomal function is compromised, giving the pathogens a chance to route into the portal vein from the injured intestinal barrier. The constant pathogen invasion and translocation into the liver will promote the development of liver abscesses. (The scheme is created in BioRender.com).

References

    1. Cui J., Liu Y., Li J., The new changes of epidemiology, etiology, and clinical characteristics of pyogenic liver abscesses: A retrospective study in a hospital in Northern China. Infect. Drug Resist. 16, 4013–4023 (2023). - PMC - PubMed
    1. Chen Y., Gong Y., Song B., Du Y., Cai K., Pyogenic liver abscess complicated with endogenous endophthalmitis caused by Klebsiella pneumoniae: A case report and literature review. Immun. Inflamm. Dis. 11, e943 (2023). - PMC - PubMed
    1. Li J., et al. , Development and validation of a nomogram for predicting sepsis in patients with pyogenic liver abscess. Sci. Rep. 13, 10849 (2023). - PMC - PubMed
    1. Bläckberg A., et al. , A population-based study of unfavorable prognostic factors associated with pyogenic liver abscess. Open Forum Infect. Dis. 10, ofad352 (2023). - PMC - PubMed
    1. Lin J. N., et al. , Pyogenic liver abscess in patients with inflammatory bowel disease: A nationwide cohort study. Liver Int. 36, 136–144 (2016). - PubMed

MeSH terms

Substances