. 2024 Jul 26;10(30):eadi7438.
doi: 10.1126/sciadv.adi7438. Epub 2024 Jul 24.

Dietary and water restriction leads to increased susceptibility to antimicrobial resistant pathogens

Affiliations

Dietary and water restriction leads to increased susceptibility to antimicrobial resistant pathogens

Keenan A Lacey et al. Sci Adv. .

Abstract

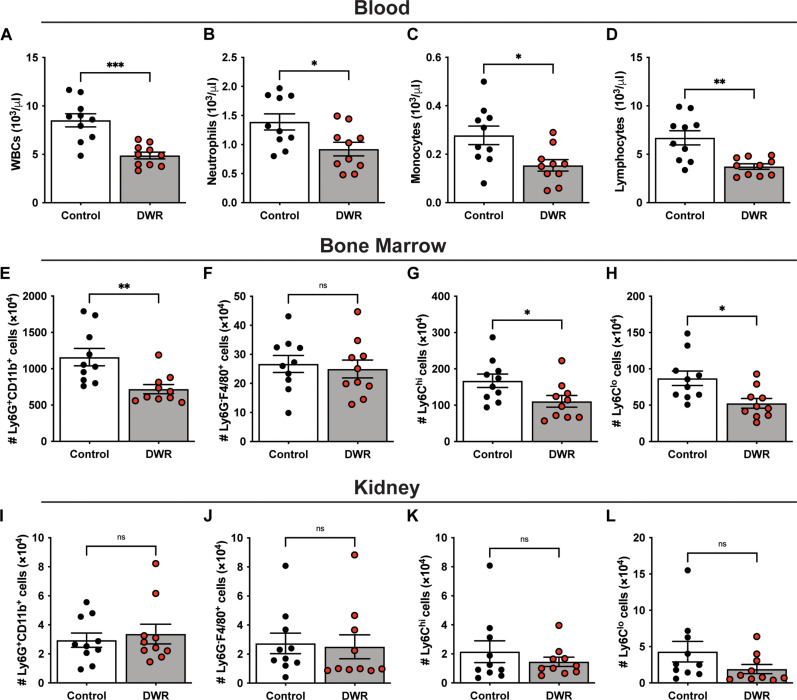
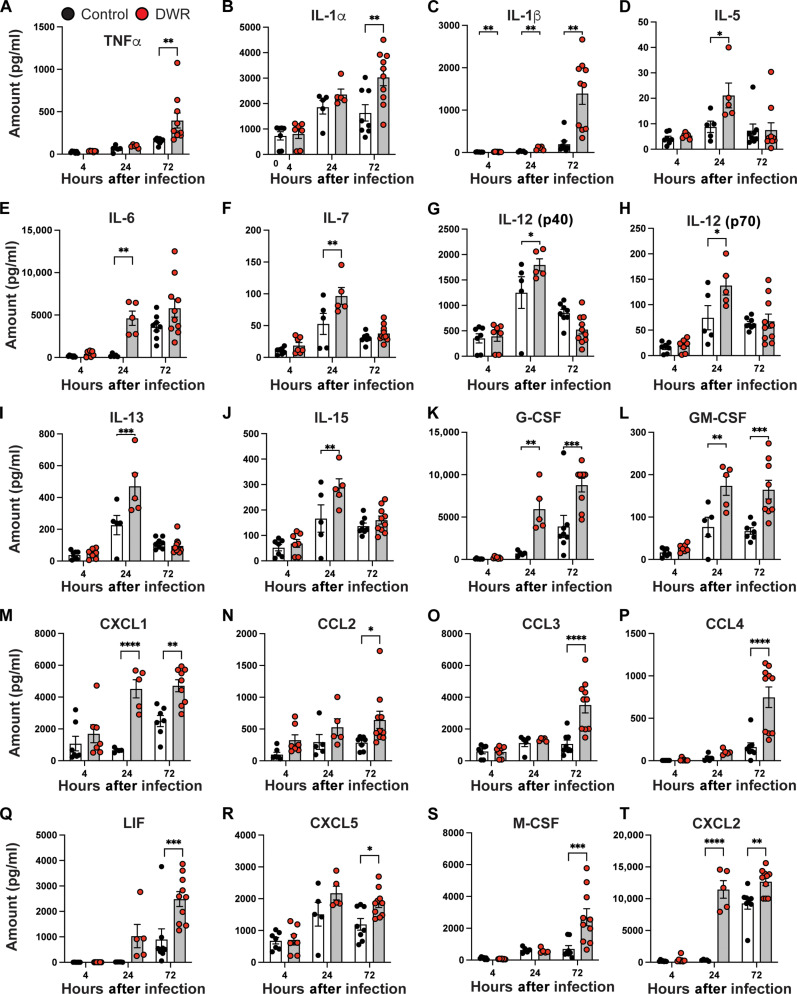
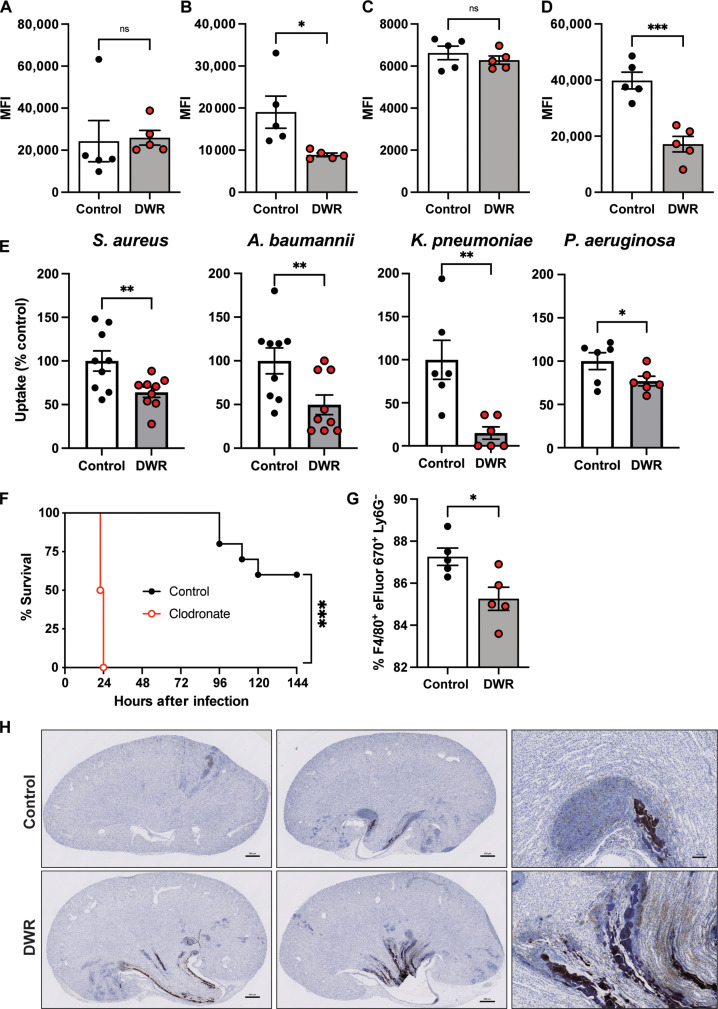
Dehydration and malnutrition are common and often underdiagnosed in hospital settings. Multidrug-resistant bacterial infections result in more than 35,000 deaths a year in nosocomial patients. The effect of temporal dietary and water restriction (DWR) on susceptibility to multidrug-resistant pathogens is unknown. We report that DWR markedly increased susceptibility to systemic infection by ESKAPE pathogens. Using a murine bloodstream model of methicillin-resistant Staphylococcus aureus infection, we show that DWR leads to significantly increased mortality and morbidity. DWR causes increased bacterial burden, severe pathology, and increased numbers of phagocytes in the kidney. DWR appears to alter the functionality of these phagocytes and is therefore unable to control infection. Mechanistically, we show that DWR impairs the ability of macrophages to phagocytose multiple bacterial pathogens and efferocytose apoptotic neutrophils. Together, this work highlights the crucial impact that diet and hydration play in protecting against infection.


Figures

Fig. 1.
Fig. 1.. DWR leads to increased mortality and pathology from HA-MRSA infection.
Model of DWR (A). Weight of mice during DWR, n = 19 to 25 (B). Hematocrit measurements from 0, 4, and 12 days, n = 10 to 17 (C). Survival curve of mice challenged intravenously with 1 × 10⁷ colony-forming units (CFU) of HA-MRSA strain TH16, n = 14 to 15 (D). Bacterial burden from 24 hours (E) and 72 hours (F) after infection, n = 7 to 16. Hematoxylin and eosin (H&E) staining from representative kidney sections of infected animals at 0, 24, and 72 hours after infection. Scale bars, 500 μm (G). Serum blood urea nitrogen (BUN) (H) and BUN/creatine ratio (I), n = 5. Survival of DWR and DWR after 7-day refeeding infected with 1 × 10⁷ CFU of HA-MRSA, n = 5 to 10 (J). Statistical analysis was performed using two-way analysis of variance (ANOVA) with Šídák posttest [(B), (E), and (F)] and log-rank (Mantel-Cox) test [(D) and (J)], Student’s t test [(H) and (I)]. Error bars represent SEM. *P < 0.05, **P < 0.01, ***P < 0.001, and ****P < 0.0001. ns, not significant.
Fig. 2.
Fig. 2.. DWR sensitizes mice to a variety of AMR pathogens.
Survival curve of intravenously infected mice with 5 × 10⁷ CFU of K. pneumoniae (A), A. baumannii (B), P. aeruginosa (C), E. cloacae (D), and C. albicans (E), n = 5 to 10. Statistical analysis was performed using log-rank (Mantel-Cox) test. *P < 0.05 and **P < 0.005.
Fig. 3.
Fig. 3.. DWR leads to a reduction in phagocytes in the blood and bone marrow.
Mice were treated with water and caloric restriction for 10 days, followed by 2 days of refeeding. Blood was analyzed for number of white blood cells (WBCs) (A), neutrophils (B), monocytes (C), and lymphocytes (D) by complete blood count (CBC). Bone marrow was analyzed by flow cytometry to determine the number of Ly6G+CD11b+ neutrophils (E), Ly6GF4/80+ macrophages (F), Ly6Chi monocytes (G), and Ly6Clo monocytes (H). Kidneys were analyzed by flow cytometry to determine the number of neutrophils (I), macrophages (J), Ly6Chi monocytes (K), and Ly6Clo monocytes (L). n = 10 per group. Statistical analysis was performed using Student’s t test. The bars represent the mean, and error bars represent SEM. *P < 0.05, **P < 0.01, and ***P < 0.001.
Fig. 4.
Fig. 4.. DWR leads to increased serum cytokine responses.
Serum levels of interferon-γ (IFN-γ) (A), tumor necrosis factor–α (TNFα) (B), interleukin-1β (IL-1β) (C), IL-5 (D), IL-6 (E), IL-10 (F), IL-12 (p70) (G), IL-13 (H), IL-15 (I), eotaxin (J), granulocyte colony-stimulating factor (G-CSF) (K), granulocyte-macrophage colony-stimulating factor (GM-CSF) (L), C-X-C motif chemokine ligand 1 (CXCL1) (M), C-C motif chemokine ligand 2 (CCL2) (N), CCL3 (O), CCL4 (P), leukemia inhibitory factor (LIF) (Q), and CXCL2 (R) were analyzed by Luminex assay at time of infection (0 hours) and 4, 24, and 72 hours after infection. n = 9 to 16 per group. Statistical analysis was performed using two-way ANOVA with Sidak posttest. The bars represent the mean, and error bars represent SEM. *P < 0.05, **P < 0.01, ***P < 0.001 and ****P < 0.0001.
Fig. 5.
Fig. 5.. DWR leads to increased kidney cytokine responses.
Kidney cytokine levels of TNFα (A), IL-1α (B) IL-1β (C), IL-5 (D), IL-6 (E), IL-7 (F), IL-12 (p40) (G), IL-12 (p70) (H), IL-13 (I), IL-15 (J), G-CSF (K), GM-CSF (L), CXCL1 (M), CCL2 (N), CCL3 (O), CCL4 (P), LIF (Q), CXCL5 (R), M-CSF (S), and CXCL2 (T) were analyzed by Luminex assay at time of infection (0 hours), and 4, 24, and 72 hours after infection with HA-MRSA strain TH16. n = 5 to 10 per group. Statistical analysis was performed using two-way ANOVA with Sidak posttest. The bars represent the mean, and error bars represent SEM. *P < 0.05, **P < 0.01, ***P < 0.001, and ****P < 0.0001.
Fig. 6.
Fig. 6.. Phagocyte numbers 24 hours after infection.
Control and DWR mice infected intravenously with 1 × 10⁷ CFU of HA-MRSA strain TH16. Cells from the blood (A to D), bone marrow (E to H), and the kidneys (I to L) were analyzed by flow cytometry to determine the number of Ly6G+CD11b+ neutrophils [(A), (E), and (I)], Ly6GF4/80+ macrophages [(B), (F), and (J)], Ly6Chi monocytes [(C), (G), and (K)], and Ly6Clo monocytes [(D), (H), and (L)]. n = 10 per group. Kidney sections from 72 hours after infection were stained for S. aureus (green), Ly6G+ cells (red), and F4/80+ cells (blue). Scale bars, 100 μm (M). Statistical analysis was performed using Student’s t test. The bars represent the mean, and error bars represent SEM. *P < 0.05 and ****P < 0.0001.
Fig. 7.
Fig. 7.. Restriction leads to reduced phagocytosis and efferocytosis.
Bone marrow cells (A), splenocytes (B), and elicited PECs from day 1 (C) and day 3 (D) from control and DWR mice were infected with GFP-labeled S. aureus strain TH16 [multiplicity of infection (MOI) of 10], and phgocytosis was assayed using flow cytometry by quantifying the mean fluorescence intensity (MFI). n = 5 per group. Gentamicin protection assay of S. aureus strain TH16 and other AMR pathogens (MOI of 10) using day 3 PECs from control or DWR mice. Data normalized to control groups for each bacterium. n = 6 to 9 per group (E). Survival of mice treated with PBS or clodronate liposomes (F), n = 10 per group. Efferocytosis of apoptotic neutrophils by PECs from control and DWR mice (G), n = 5 per group. Caspase-3 staining of kidney sections 72 hours after infection. Scale bars, 500 μm (H). Statistical analysis was performed using Student’s t test [(A) to (D) and (G)], Mann-Whitney one-sided U test (E), and log-rank (Mantel-Cox) test (F). Error bars represent SEM. *P < 0.05, **P < 0.01, and ***P < 0.001.
Fig. 8.
Fig. 8.. Serum factors play a role in the restriction phenotype.
Serum from control or DWR mice was transferred to DWR mice on two consecutive days before intravenous infection with 1 × 10⁷ CFU of TH16, and survival at 150 hours was measured (A), data from four independent experiments with n = 20 per group total. Bone marrow–derived macrophages (BMDMs) from naïve mice were treated with serum from control or restricted mice for 2 hours and then infected with GFP-expressing TH16, and intracellular bacteria were measured by plating (B) and flow cytometry (C) 1 hour after infection, n = 10 per group. BMDMs were treated with the metabolite fraction from control or DWR plasma followed by infection with GFP-expressing TH16, and intracellular bacteria were measured by plating (D) and flow cytometry (E), n = 5 per group. Statistical analysis was performed using Student’s t test. Error bars represent SEM. *P < 0.05, **P < 0.01, and ***P < 0.001.

References

    1. El-Sharkawy A. M., Watson P., Neal K. R., Ljungqvist O., Maughan R. J., Sahota O., Lobo D. N., Hydration and outcome in older patients admitted to hospital (The HOOP prospective cohort study). Age Ageing 44, 943–947 (2015). - PMC - PubMed
    1. Silver H. J., Pratt K. J., Bruno M., Lynch J., Mitchell K., McCauley S. M., Effectiveness of the malnutrition quality improvement initiative on practitioner malnutrition knowledge and screening, diagnosis, and timeliness of malnutrition-related care provided to older adults admitted to a tertiary care facility: A pilot study. J. Acad. Nutr. Diet. 118, 101–109 (2018). - PubMed
    1. Antimicrobial Resistance Collaborators, Global burden of bacterial antimicrobial resistance in 2019: A systematic analysis. Lancet 399, 629–655 (2022). - PMC - PubMed
    1. Tong S. Y. C., Davis J. S., Eichenberger E., Holland T. L., Fowler V. G., Staphylococcus aureus infections: Epidemiology, pathophysiology, clinical manifestations, and management. Clin. Microbiol. Rev. 28, 603–661 (2015). - PMC - PubMed
    1. van Hal S. J., Jensen S. O., Vaska V. L., Espedido B. A., Paterson D. L., Gosbell I. B., Predictors of mortality in Staphylococcus aureus bacteremia. Clin. Microbiol. Rev. 25, 362–386 (2012). - PMC - PubMed

Publication types