. 2024 Nov 12;8(21):5612-5624.
doi: 10.1182/bloodadvances.2024013117.

NK- and T-cell repertoire is established early after allogeneic HSCT and is imprinted by CMV reactivation

Affiliations

NK- and T-cell repertoire is established early after allogeneic HSCT and is imprinted by CMV reactivation

Antonia Schäfer et al. Blood Adv. .

Abstract

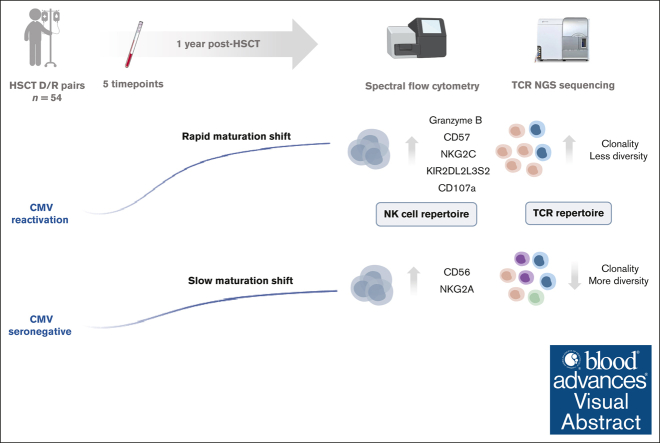
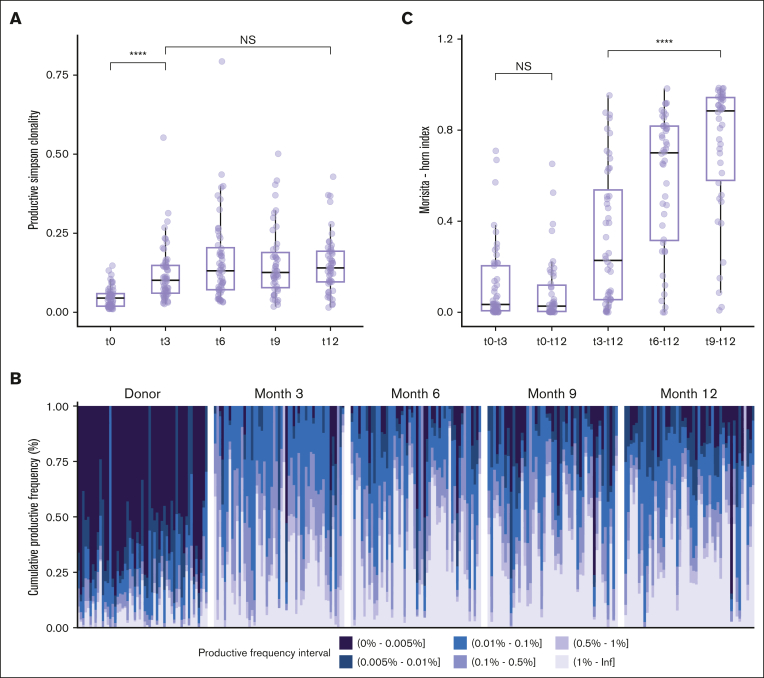
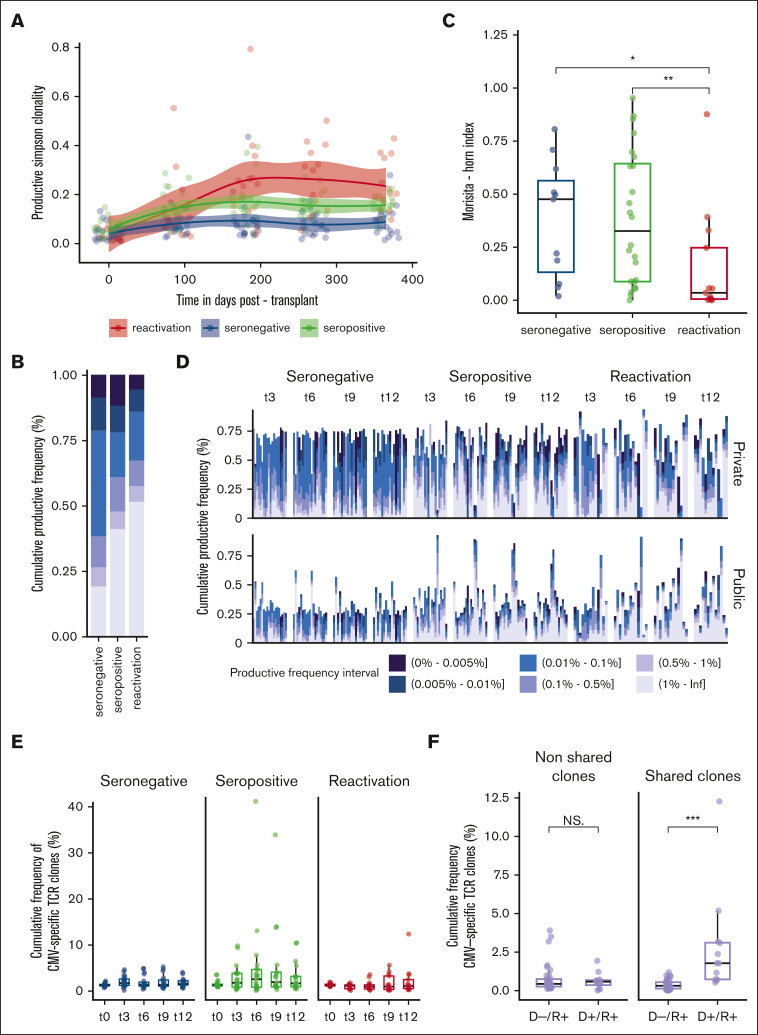
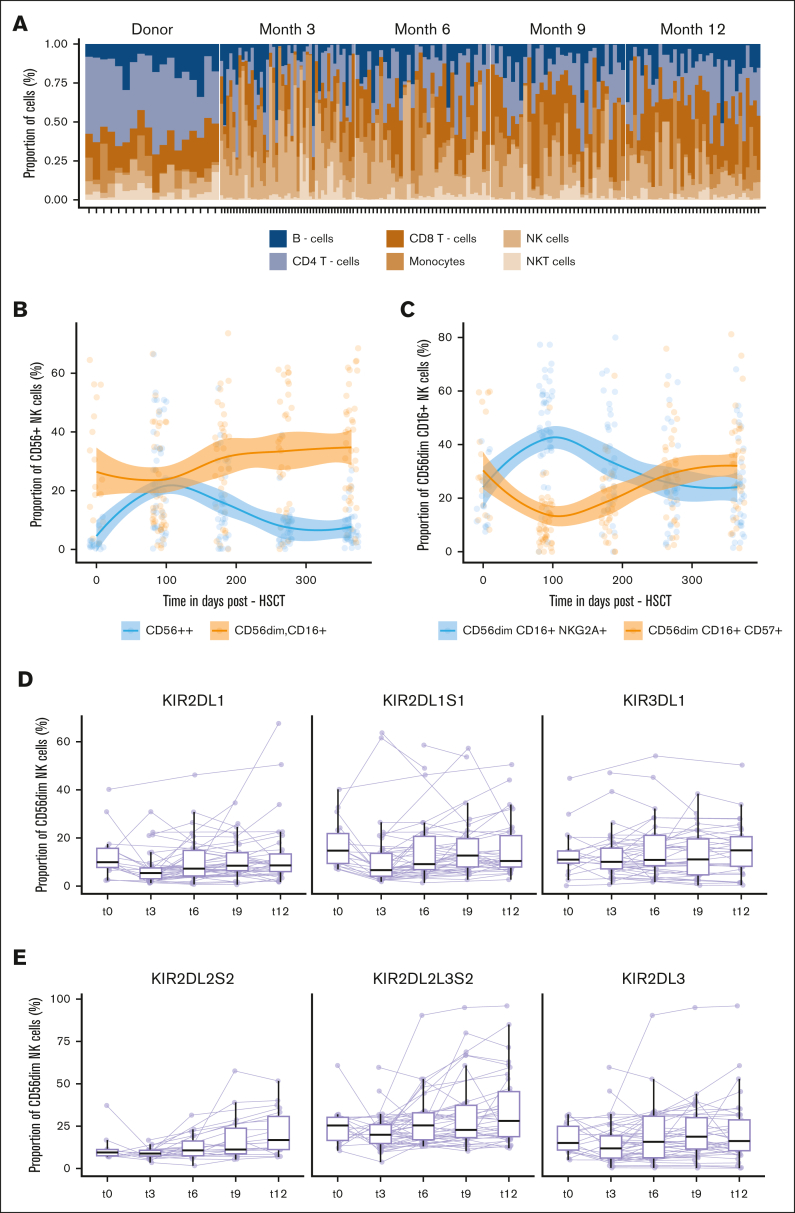
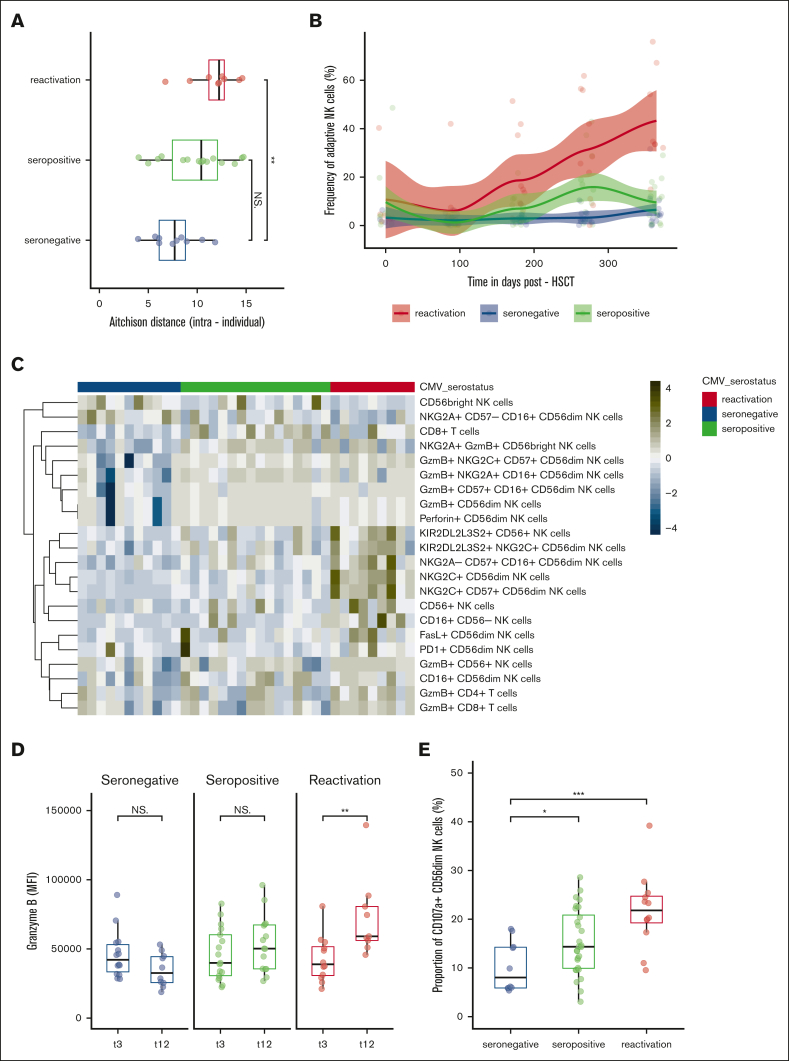
Besides genetic influences, nongenetic factors such as graft-versus-host disease and viral infections have been shown to be important shapers of the immune reconstitution and diversification processes after hematopoietic stem cell transplantation (HSCT). However, differential susceptibility to immune modulation by nongenetic factors is not fully understood. We determined to follow the reconstitution of the T-cell receptor (TCR) repertoire through immune sequencing of natural killer (NK) cells using a 35-marker spectral flow cytometry panel and in relation to clinical events. A longitudinal investigation was performed on samples derived from 54 HSCT recipients during the first year after HSCT. We confirmed a significant contraction in TCR repertoire diversity, with remarkable stability over time. Cytomegalovirus (CMV) reactivation had the ability to significantly change TCR repertoire clonality and composition, with a long-lasting imprint. Our data further revealed skewing of NK-cell reconstitution in CMV reactivated recipients, with an increased frequency of KIR2DL2L3S2+ adaptive, cytolytic, and functional CD107a+ NK cells, concomitant with a reduced pool of NKG2A+ NK cells. We provided support that CMV might act as an important driver of peripheral homeostatic proliferation of circulating specific T and NK cells, which can be viewed as a compensatory mechanism to establish a new peripheral repertoire.


Conflict of interest statement

Conflict-of-interest disclosure: Y.C. reports consulting fees from Merck Sharp & Dohme (MSD), Novartis, Incyte, Bristol Myers Squibb, Pfizer, AbbVie, Roche, Jazz, Gilead, Amgen, AstraZeneca, and Servier; and travel support from MSD, Roche, Gilead, Amgen, Incyte, AbbVie, Janssen, AstraZeneca, Jazz, and Sanofi, all via the institution. The remaining authors declare no competing financial interests.

Figures

None
Graphical abstract
Figure 1.
Figure 1.
TCR diversity restricted during the first year after HSCT. (A) Evolution of TCR-productive Simpson clonality before allo-HSCT (t0, n = 53) in donors and at serial time points t3 (n = 54), t6 (n = 52), t9 (n = 47), and t12 (n = 48) after allo-HSCT in recipients. (B) Fractal clonal size organization defined by the productive frequency of clones at the indicated time points (t0, n = 53; t3, n = 54; t6, n = 52; t9, n = 47; and t12, n = 48). Each bar represents a single individual. The color-coded legend bar represents stratification according to the productive frequency of the individual clone. (C) TCR repertoire overlaps between donor and recipient and between post-HSCT time points in recipients calculated using the Morisita-Horn index. Morisita-Horn indices vary between 0 (no overlap) and 1 (complete overlap) and are represented along the y-axis. Box plots display medians and IQRs, with whiskers representing 1.5× IQR. Wilcoxon rank-sum test with false discovery rate correction in panel A. Kruskal-Wallis test and post hoc Dunn test in panel C. All P values were 2-sided. Statistical thresholds: ∗∗∗∗P < .0001. NS, not significant.
Figure 2.
Figure 2.
TCR repertoire restoration in relation to CMV serostatus and infection/reactivation. Stratification according to the following groups: seronegative (n = 20), seropositive (n = 21), and reactivated (n = 13) CMV recipients applies to plots (A-E). (A) Evolution of TCR-productive Simpson clonality at serial time points after HSCT fitted using LOESS regression with a 95% confidence interval. (B) Productive frequency distribution at 12 months after HSCT with respect to groups. (C) TCR repertoire overlap computed using the Morisita-Horn index between 3 and 12 months after HSCT. Morisita-Horn indices vary between 0 (no overlap) and 1 (complete overlap) and are represented along the y-axis. (D) Private (upper panel) (ie, observed in only 1 D/R pair) and public (lower panel) (ie, observed in ≥2 D/R pairs or matching clonotypes present in public databases with antigen-specific validated TCRs) fractal clonal size organization at serial time points after HSCT. Each bar represents a single individual. The color-coded legend bar represents the stratification according to the individual clone’s productive frequency. (E) Cumulative productive frequency of CMV–specific TCR clones identified by in silico matching with public databases at serial time points after HSCT. (F) Cumulative productive frequency of donor-recipient nonshared and shared (ie, between each D/R pair) CMV-specific TCR clones in D/R+ (n = 9) and D+/R+ (n = 4) CMV reactivated recipients at all time points combined. The cumulative frequencies at each time point are detailed in supplemental Figure 4A. Box plots display medians and IQRs, with whiskers representing 1.5× IQR. Wilcoxon-rank sum test for pairwise comparisons in panels B,F. All P values were 2-sided. Statistical thresholds: ∗P < .05; ∗∗P < .01; ∗∗∗P < .001.
Figure 3.
Figure 3.
Immune-cell composition during the first year after HSCT. (A) Relative proportions of 6 major cell populations: CD8+ and CD4+ T cells, NK T cell, NK cell, monocytes, and B cells assessed at the indicated time points after HSCT: t0 (n = 18), t3 (n = 44), t6 (n = 35), t9 (n = 32), and t12 (n = 37). Each stacked bar represents an individual. (B) Evolution of the frequency of CD56bright, CD56dim, CD16+ NK cells at indicated time points after HSCT: t0 (n = 18), t3 (n = 44), t6 (n = 35), t9 (n = 32), and t12 (n = 37) fitted using LOESS regression with a 95% confidence interval. Day 0 indicates a pre-HSCT state of the donor. Color-coded lines represent linear regression according to cell subset. (C) Evolution of the frequency of CD56dim, CD16+, NKG2A+, CD57neg and CD56dim, CD16+, NKG2Aneg, and CD57+ NK cells at the indicated time points after HSCT: t0 (n = 18), t3 (n = 44), t6 (n = 35), t9 (n = 32), and t12 (n = 37) fitted using LOESS regression with a 95% confidence interval. Day 0 indicates a pre-HSCT state of the donor. Color-coded lines represent linear regression according to the cell subset. (D, E) Proportion of KIR+ CD56dim NK cell at the indicated time points after HSCT: t0 (n = 18), t3 (n = 44), t6 (n = 35), t9 (n = 32), and t12 (n = 37). The lines connect paired samples. Box plots display medians and IQRs, with whiskers representing 1.5× IQR.
Figure 4.
Figure 4.
NK-cell compartment restoration in relation to CMV serostatus and infection/reactivation. Stratification according to the following groups: seronegative (n = 17), seropositive (n = 18), and reactivated (n = 12) CMV recipients applies to plots (A-E). (A) Intraindividual distance (Aitchison distance) between 3 and 12 months after HSCT among stratified groups based on 62 manually gated cell frequencies. (B) Evolution of the CD57+, NKG2C+ CD56dim adaptive NK cells at 1-year follow-up after HSCT stratified among the groups fitted using LOESS regression with a 95% confidence interval. Color-coded lines represent linear regression according to the cell subset. (C) Heat map of the frequency of cell subsets at 12 months that were statistically different between CMV seronegative (green) and CMV reactivated (blue) recipients. Heat map rows display cell subsets and are colored by the z score normalized per row. Each column represents the recipient. (D) Granzyme B expression (MFI) in KIR2DL2L3S2+ NKG2C+ CD56dim NK cells among stratified groups at 3 and 12 months after HSCT. (E) Frequency of CD107a+ CD56dim NK cells in stratified groups: seronegative (n = 17), seropositive (n = 18), and reactivated (n = 12). Box plots display medians and IQRs, with whiskers representing 1.5× IQR. Wilcoxon rank-sum test in panels A,C-E. All P values were 2-sided. Statistical thresholds: ∗P < .05; ∗∗P < .01; ∗∗∗P < .001. MFI, mean flurorescence intensity.

References

    1. Saccardi R, Putter H, Eikema DJ, et al. Benchmarking of survival outcomes following haematopoietic stem cell transplantation (HSCT): an update of the ongoing project of the European Society for Blood and Marrow Transplantation (EBMT) and Joint Accreditation Committee of ISCT and EBMT (JACIE) Bone Marrow Transplant. 2023;58(6):659–666. - PMC - PubMed
    1. Chabannon C, Kuball J, Bondanza A, et al. Hematopoietic stem cell transplantation in its 60s: a platform for cellular therapies. Sci Transl Med. 2018;10(436) - PubMed
    1. Velardi E, Tsai JJ, van den Brink MRM. T cell regeneration after immunological injury. Nat Rev Immunol. 2021;21(5):277–291. - PMC - PubMed
    1. Storek J, Geddes M, Khan F, et al. Reconstitution of the immune system after hematopoietic stem cell transplantation in humans. Semin Immunopathol. 2008;30(4):425–437. - PubMed
    1. Buhler S, Bettens F, Dantin C, et al. Genetic T-cell receptor diversity at 1 year following allogeneic hematopoietic stem cell transplantation. Leukemia. 2020;34(5):1422–1432. - PubMed

Publication types

Substances