. 2024 Sep:75:103247.
doi: 10.1016/j.redox.2024.103247. Epub 2024 Jun 19.

Heme oxygenase-1 protects cells from replication stress

Affiliations

Heme oxygenase-1 protects cells from replication stress

Patryk Chudy et al. Redox Biol. 2024 Sep.

Abstract

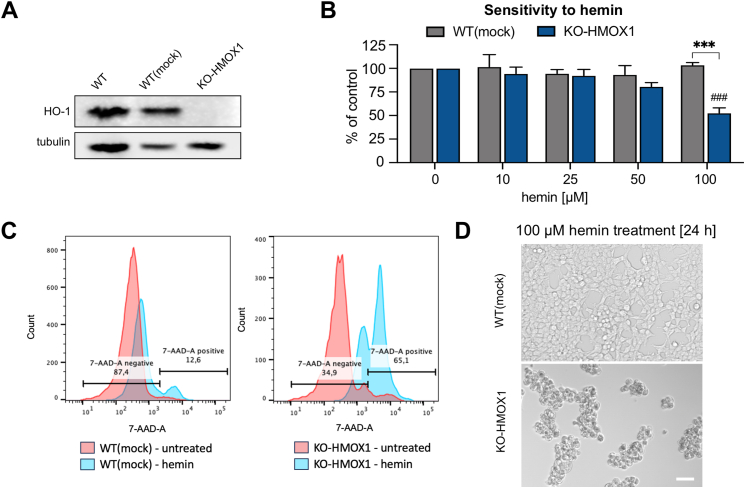
Heme oxygenase-1 (HO-1, HMOX1) degrades heme protecting cells from heme-induced oxidative damage. Beyond its well-established cellular functions, heme has emerged as a stabilizer of G-quadruplexes. These secondary DNA structures interfere with DNA replication. We recently revealed that nuclear HO-1 colocalizes with DNA G-quadruplexes and promotes their removal. Here, we investigate whether HO-1 safeguards cells against replication stress. Experiments were conducted in control and HMOX1-deficient HEK293T cell lines. Immunostaining unveiled that DNA G-quadruplexes accumulated in the absence of HO-1, the effect that was further enhanced in response to δ-aminolevulinic acid (ALA), a substrate in heme synthesis. This was associated with replication stress, as evidenced by an elevated proportion of stalled forks analyzed by fiber assay. We observed the same effects in hematopoietic stem cells isolated from Hmox1 knockout mice and in a lymphoblastoid cell line from an HMOX1-deficient patient. Interestingly, in the absence of HO-1, the speed of fork progression was higher, and the response to DNA conformational hindrance less stringent, indicating dysfunction of the PARP1-p53-p21 axis. PARP1 activity was not decreased in the absence of HO-1. Instead, we observed that HO-1 deficiency impairs the nuclear import and accumulation of p53, an effect dependent on the removal of excess heme. We also demonstrated that administering ALA is a more specific method for increasing intracellular free heme compared to treatment with hemin, which in turn induces strong lipid peroxidation. Our results indicate that protection against replication stress is a universal feature of HO-1, presumably contributing to its widely recognized cytoprotective activity.

Keywords: Cell cycle; G-quadruplexes; Heme; Heme oxygenase-1; PARP1; Replication stress.


Conflict of interest statement

Declaration of competing interest The authors declare that they have no known competing financial interests or personal relationships that could have appeared to influence the work reported in this paper.

Figures

Image 1
Graphical abstract
Fig. 1
Fig. 1
Characterization of HEK293T WT(mock) and KO-HMOX1 cell lines. A) Expression of HO-1 protein in cells cultured under control conditions. Western blot. Tubulin was used as a loading control. B) Effect of hemin (10–100 μM, 24 h) on cell viability. MTT reduction assay. ANOVA. * - KO-HMOX1 vs. WT(mock), # - treated vs. untreated cells. C) Flow cytometer plot for 7-AAD staining after hemin (100 μM, 24 h) treatment and in control (untreated) group. Percentage of 7-AAD negative (range was selected based on comparison to negative control without 7-AAD) and 7-AAD positive cells was indicated for cells after hemin stimulation. D) Effect of hemin (100 μM, 24 h) on cell morphology. Representative images. Bright field, scale bar 200 μm.
Fig. 2
Fig. 2
The role of HO-1 in the regulation of PARP1 pathway. A) PARP1 protein level. Western blotting (left) and densitometry results (right) of PARP1 in HEK293T cells. Tubulin was used as a loading control. T-test. B) PARP1 protein level. Immunofluorescence staining was analyzed by flow cytometry. T-test. C) PARP1 in HEK293T cells. Representative images of PARP1 intracellular localization (left) and densitometry analysis (right). Mann-Whitney test. Scale bar 20 μm. D) Colocalization (red dots) of HO-1 and PARP1 proteins in WT(mock) cells. Cell nuclei were counterstained with DAPI (blue). Scale bar 10 μm. Proximity ligation assay (PLA). E) Fluorescence recovery after photobleaching (FRAP) analysis of PARP1-GFP using a confocal microscope. Representative images (left) taken at the indicated timepoints (in seconds) and quantitative analysis (right) of T-half of recovery after photobleaching of PARP1-GFP. T-test. Scale bar 20 μm. F) Timelapse analysis of livePAR in WT(mock) and KO-Hmox1 after induction of DNA damage in the cell nucleus. Foci (arrows) in the image demonstrate LivePAR recruitment. G) Recruitment of LivePAR in HEK293T (left) or iPSCs (right) after laser-induced micro-irradiation. H) Effect of β-NAD (10 mM) with and without FK866 (10 nM), etoposide (250 nM), and olaparib (100 nM) on cytoplasmic (left) and nuclear (right) NAD+ levels. The FRET NAD+ sensors were analyzed by flow cytometry. Two-way ANOVA. I) Autoparylation in vitro of recombinant PARP1 in the presence of recombinant HMOX1. The liquid reaction was proceeded with mixture of biotin-NAD+ (25 μM), NAD+ (75 μM) and ssDNA or G4 oligonucleotides (5 μg/mL). Western blotting (right) and densitometry (left) detection with streptavidin-HRP. Reaction mix without NAD+ was used as a negative control. ANOVA. (For interpretation of the references to color in this figure legend, the reader is referred to the Web version of this article.)
Fig. 3
Fig. 3
G-quadruplex accumulation and DNA-damage response (DDR) in WT(mock) and KO-HMOX1 cells. A) G-quadruplexes in cells cultured under control conditions or incubated with PDS (2 μM, 24 h). B) DDR measured as γH2AX staining in cells cultured under control conditions or incubated with etoposide (0.25 μM), hemin (20 μM), ALA (350 μM) or PDS (2 μM) for 24 h. Immunocytochemistry and confocal microscopy. Representative images are presented in inserts. Kruskal-Wallis test. * - KO-HMOX1 vs. WT(mock), # - treated vs. untreated cells.
Fig. 4
Fig. 4
Effect of hemin and ALA on intracellular heme in HEK293T WT(mock) and KO-HMOX1 cells. A) Expression of HO-1 protein in WT(mock) cells. Immunocytochemistry and fluorescence microscopy. Representative pictures. B) Effect of hemin (20 μM, 24 h) and ALA (350 μM, 24 h) on total heme levels. Oxalic acid assay. ANOVA. C) Free heme in the cytoplasm and nucleus of WT(mock) and KO-HMOX1 cells under control conditions. D) Effect of hemin (20 μM, 3 h) and ALA (350 μM, 24 h) on free heme in the cytoplasm and nucleus of WT(mock) cells. E) Effect of hemin (20 μM, 3 h) and ALA (350 μM, 24 h) on free heme in the cytoplasm and nucleus of KO-HMOX1 cells. Cytoplasmic or nuclear eGFP/mKATE2 fluorescence ratio in cells transfected with reporter plasmids (a lower value indicates a higher concentration of heme). Flow cytometry. ANOVA (B, C), Kruskal-Wallis test (D, E).
Fig. 5
Fig. 5
Oxidative stress and genotoxic stress in HEK293T cells. A) Effect of hemin (20 μM, 24 h) and ALA (350 μM, 24 h) on ROS generation in WT(mock) and KO-HMOX1 cells. CellROX Deep Red Reagent assay, analyzed by flow cytometry. TBHP (200 μM, 30 min) was used as a positive control. ANOVA. B) Time course of ROS generation after hemin (20 μM) treatment in WT(mock) and KO-HMOX1 cells. C) Representative images of lipid peroxidation in untreated cells and after treatment with hemin, ALA or CH. Scale bar 40 μm. D) Effect of hemin (20 μM, 24 h), ALA (350 μM, 24 h) and hemin (20 μM, 24 h) together with NAC (2.5 mM, 24 h) on lipid peroxidation in WT(mock) and KO-HMOX1 cells. Click-iT Lipid Peroxidation Kit, analyzed using a fluorescence microscope. Cumene hydroperoxide (CH, 100 μM, 24 h) was used as a positive control. ANOVA. E) Time course of lipid peroxidation after hemin (20 μM) treatment in WT(mock) and KO-HMOX1 cells. F) DNA-damage response measured as γH2AX staining in cells exposed to etoposide (0.25 μM) and then cultured without additional stimulation or treated with PDS, hemin alone and hemin together with NAC (2.5 mM) for 24 h. Immunocytochemistry and confocal microscopy. Kruskal-Wallis test. (For interpretation of the references to color in this figure legend, the reader is referred to the Web version of this article.)
Fig. 6
Fig. 6
G-quadruplexes and replication stress in HEK923T cells. A) Effect of treatment with ALA (350 μM, 24 h) on G-quadruplexes in WT(mock) cells. B) Effect of treatment with ALA on G-quadruplexes in KO-HMOX1 cells. Immunocytochemistry and confocal microscopy. Wilcoxon test. C) Effect of PDS (2 μM, 24 h) on DNA replication, assessed as a proportion of fired, ongoing, terminated and stalled replication forks in WT(mock) and KO-HMOX1 cells. Fibers assay. Chi2 test.
Fig. 7
Fig. 7
Replication stress and G-quadruplex processing in HEK923T cells. A) Effect of ALA (350 μM, 24 h) and succinylacetone (SA, 500 μM, 24 h) on DNA replication, assessed as a proportion of fired, ongoing, terminated and stalled replication forks in WT(mock) and KO-HMOX1 cells. Fibers assay. Chi2 test. B) Length of fibers identified as ongoing forks in untreated cells and after treatment with ALA. Kruskal-Wallis test. C) Representative images of G-quadruplexes (magenta) on DNA fibers (green) of WT(mock) cells. D) Proportion of replication forks with G-quadruplexes detected in the middle or at the end of the fork in untreated cells and after treatment with ALA. Fibers assay. Chi2 test. * - G-quadruplexes in the end of forks, # - G-quadruplexes within the forks. (For interpretation of the references to color in this figure legend, the reader is referred to the Web version of this article.)
Fig. 8
Fig. 8
Nuclear translocation of p53. A) Protein level and (B) nuclear translocation of p53 measured by ImageStream. T-test. C) Nuclear translocation of p53-GFP in WT(mock) and KO-HMOX1 HEK293T cells treated with etoposide (20 μM) for 3 h. Timelapses images (right) captured by using fluorescence microscopy. Scale bar 10 μm. D) Nuclear level of p53 in dKO and NLS iPSCs cultured in heme depleted medium with SA (500 μM) for 24 h. ANOVA. E) Expression of p21 (Cdkn1a) in dKO and NLS iPSCs cultured in heme depleted medium with SA (500 μM) or in complete medium with olaparib (100 nM) for 24 h. Kruskal-Wallis test.
Fig. 9
Fig. 9
Cell cycle and proliferation of HEK293T cells. A) G1/S/G2 phases of the cell cycle in WT(mock) and KO-HMOX1 cells cultured under control conditions or treated with ALA (250 μM, 24 h). B) Representative images of cells after 12 h, 24 h, 36 h and 48 h. Scale bar 20 μm. C) Number of cells cultured under control conditions or treated with ALA (24 h or 48 h). ANOVA. D) Duration of the cell cycle in WT(mock) and KO-HMOX1 cells cultured under control. Mann-Whitney test.
Fig. 10
Fig. 10
Replication stress in primary cells. A) DNA replication, assessed as a proportion of fired, ongoing, terminated and stalled replication forks in HSCs isolated from the bone marrow of WT mice or Hmox1 KO mice and cultured in-vitro for 7 days. Chi2 test. B) Length of fibers identified as ongoing forks in HSCs isolated from the bone marrow of WT mice or KO-Hmox1 mice and cultured in-vitro for 7 days. Fibers assay. T-test, 2 biological repetitions. C) Expression Parp1, Plk2 and Cdkn1a genes in HSCs isolated from the bone marrow of old WT mice or Hmox1 KO mice. RNA-seq, data are presented as FPKM (Fragments Per Kilobase of transcript per Million mapped reads). T-test. D) DNA replication, assessed as a proportion of fired, ongoing, terminated, and stalled replication forks in LCL derived from a healthy donor (WT) and patient carrying HMOX1 mutation (HMOX1-mut). Chi2 test. E) Length of fibers identified as ongoing forks in WT and HMOX1-mut LCL. Fibers assay. T-test.

References

    1. Dulak J., Deshane J., Jozkowicz A., et al. Heme oxygenase-1 and carbon monoxide in vascular pathobiology: focus on angiogenesis. Circulation. 2008;117(2):231–241. doi: 10.1161/CIRCULATIONAHA.107.698316. - DOI - PMC - PubMed
    1. Dunn L.L., Midwinter R.G., Ni J., et al. New insights into intracellular locations and functions of heme oxygenase-1. Antioxidants Redox Signal. 2014;20(11):1723–1742. doi: 10.1089/ars.2013.5675. - DOI - PMC - PubMed
    1. Szade A., Szade K., Mahdi M., et al. The role of heme oxygenase-1 in hematopoietic system and its microenvironment. Cell. Mol. Life Sci. 2021 May;78(10):4639–4651. doi: 10.1007/s00018-021-03803-z. - DOI - PMC - PubMed
    1. Li C., Wu J., Dong Q., et al. Heme oxygenase-1 impacts oxidative stress-induced neural stem cells senescence by regulating DNA damage repair via PARP-1. SSRN. 2023 Preprint.
    1. Scaffa A., Tollefson G.A., Yao H., et al. Identification of heme oxygenase-1 as a putative DNA-binding protein. Antioxidants. 2022;11(11):2135. doi: 10.3390/antiox11112135. - DOI - PMC - PubMed

LinkOut - more resources