. 2024 Aug 8;111(8):1588-1604.
doi: 10.1016/j.ajhg.2024.06.015. Epub 2024 Jul 23.

De novo missense variants in HDAC3 leading to epigenetic machinery dysfunction are associated with a variable neurodevelopmental disorder

Affiliations

De novo missense variants in HDAC3 leading to epigenetic machinery dysfunction are associated with a variable neurodevelopmental disorder

Jihoon G Yoon et al. Am J Hum Genet. .

Abstract

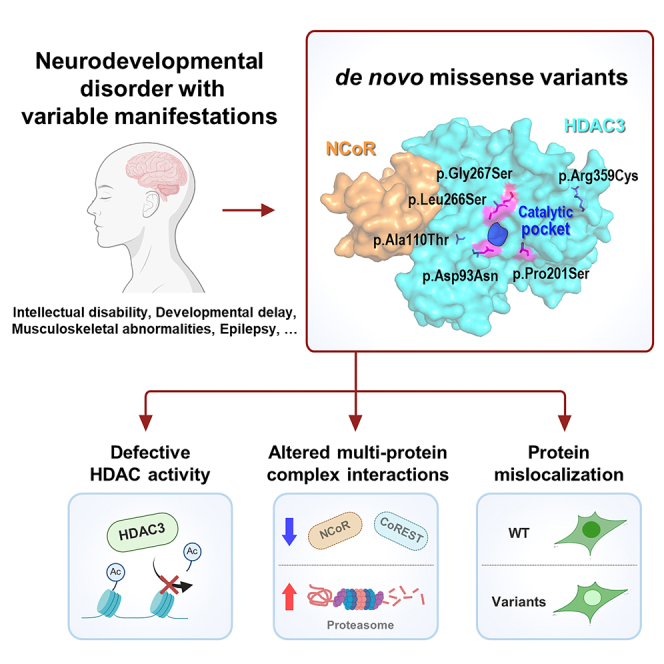
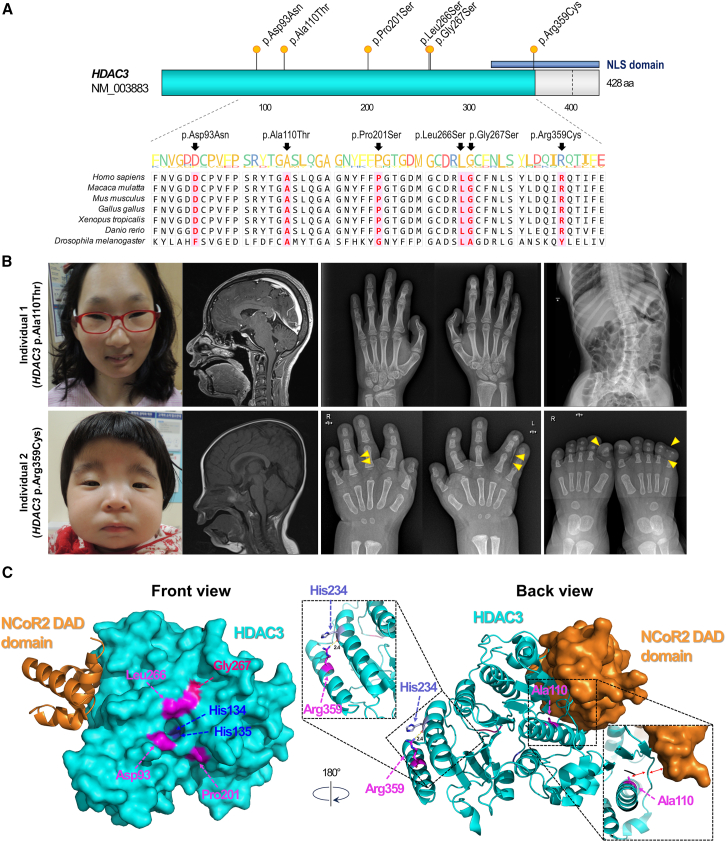
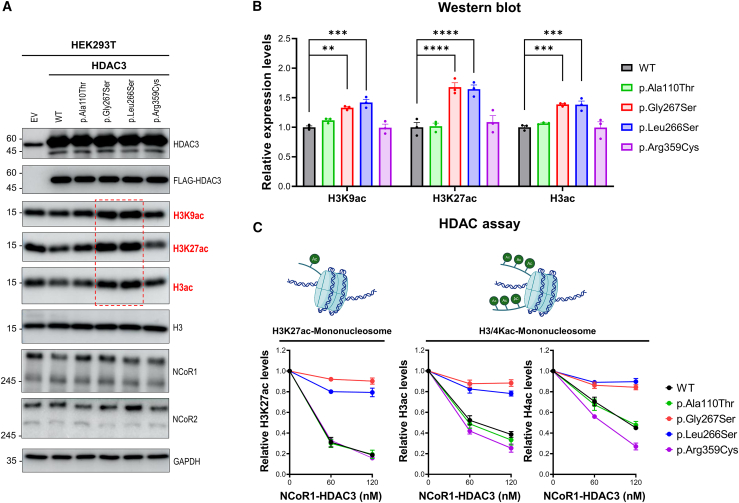
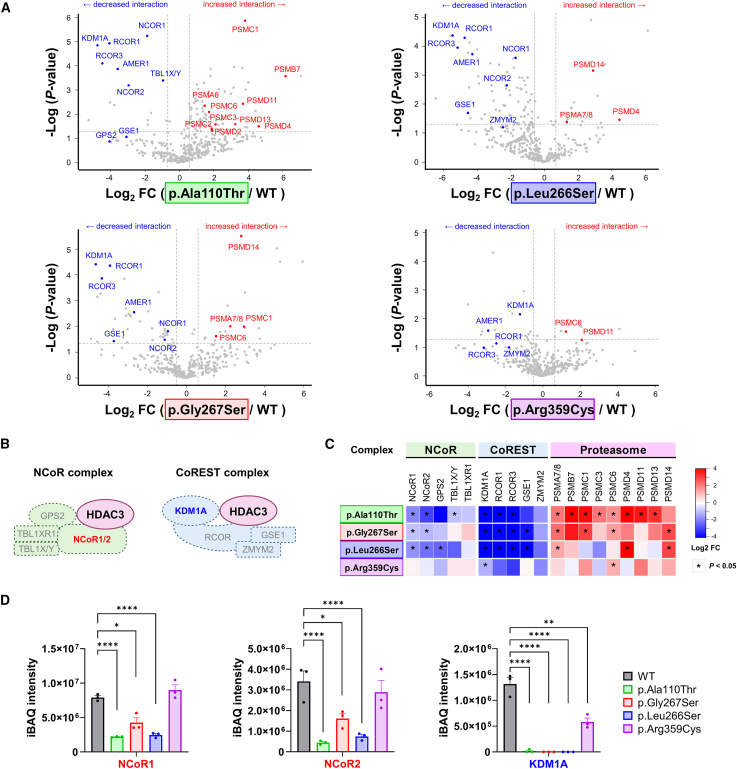
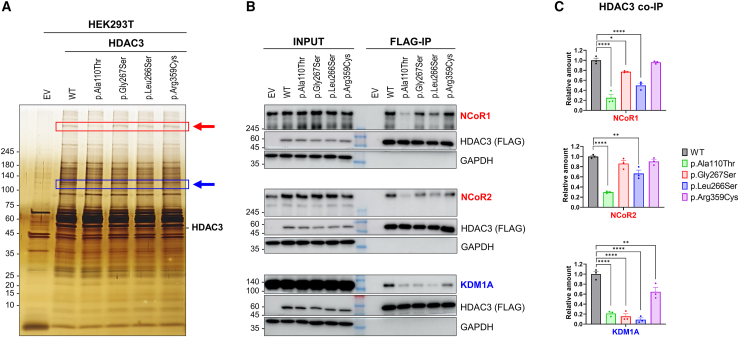
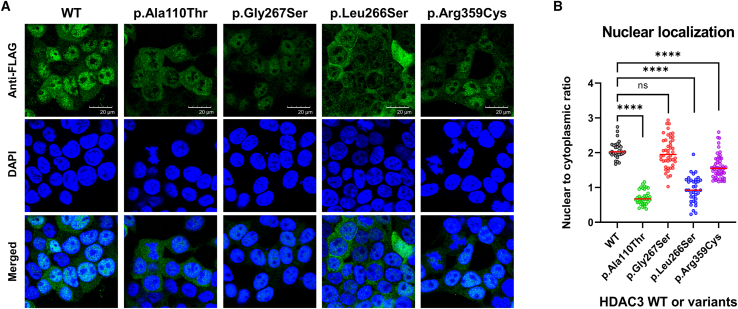
Histone deacetylase 3 (HDAC3) is a crucial epigenetic modulator essential for various developmental and physiological functions. Although its dysfunction is increasingly recognized in abnormal phenotypes, to our knowledge, there have been no established reports of human diseases directly linked to HDAC3 dysfunction. Using trio exome sequencing and extensive phenotypic analysis, we correlated heterozygous de novo variants in HDAC3 with a neurodevelopmental disorder having variable clinical presentations, frequently associated with intellectual disability, developmental delay, epilepsy, and musculoskeletal abnormalities. In a cohort of six individuals, we identified missense variants in HDAC3 (c.277G>A [p.Asp93Asn], c.328G>A [p.Ala110Thr], c.601C>T [p.Pro201Ser], c. 797T>C [p.Leu266Ser], c.799G>A [p.Gly267Ser], and c.1075C>T [p.Arg359Cys]), all located in evolutionarily conserved sites and confirmed as de novo. Experimental studies identified defective deacetylation activity in the p.Asp93Asn, p.Pro201Ser, p.Leu266Ser, and p.Gly267Ser variants, positioned near the enzymatic pocket. In addition, proteomic analysis employing co-immunoprecipitation revealed that the disrupted interactions with molecules involved in the CoREST and NCoR complexes, particularly in the p.Ala110Thr variant, consist of a central pathogenic mechanism. Moreover, immunofluorescence analysis showed diminished nuclear to cytoplasmic fluorescence ratio in the p.Ala110Thr, p.Gly267Ser, and p.Arg359Cys variants, indicating impaired nuclear localization. Taken together, our study highlights that de novo missense variants in HDAC3 are associated with a broad spectrum of neurodevelopmental disorders, which emphasizes the complex role of HDAC3 in histone deacetylase activity, multi-protein complex interactions, and nuclear localization for proper physiological functions. These insights open new avenues for understanding the molecular mechanisms of HDAC3-related disorders and may inform future therapeutic strategies.

Keywords: CoREST; HDAC activity; NCoR; cellular mislocalization; epigenetics; exome sequencing; histone deacetylase 3; neurodevelopmental disorder; proteomics.


Conflict of interest statement

Declaration of interests The authors declare no conflicts of interest.

Figures

None
Graphical abstract
Figure 1
Figure 1
Locus conservation, phenotypic characteristics, and three-dimensional location on the protein structure of HDAC3 variants (A) Genomic locations of identified variants. All variants are missense and situated in highly conserved regions across vertebrate species. The blue bar indicates the presence of the nuclear localization signal (NLS) domain. (B) Phenotypic characteristics of individuals 1 and 2 carrying the p.Ala110Thr and p.Arg359Cys variants, respectively. Both females exhibited facial dysmorphism, profound microcephaly with no abnormal brain MRI findings, and skeletal abnormalities such as joint stiffness, scoliosis, or polysyndactyly (yellow triangle). (C) Three-dimensional structure of the bound form of NCoR2 DAD domain-HDAC3 complex and variant locations on HDAC3 protein (modified from PDB: 4A69). This panel shows the three-dimensional positioning of HDAC3 variants on the protein structure, highlighting the responsible amino acid residues in magenta.
Figure 2
Figure 2
HDAC3 variants near catalytic sites display deficient HDAC activity (A) Western blot analyses were conducted on HEK293T cells transduced with either empty vector (EV), FLAG-tagged wild-type (WT) HDAC3, or selected HDAC3 variants (p.Ala110Thr, p.Gly267Ser, p.Leu266Ser, and p.Arg359Cys) using a lentiviral expression system. The detection of HDAC3; FLAG-HDAC3; acetylated histones H3K9, H3K27, and H3; total H3; NCoR1; NCoR2; and GAPDH (loading control) was visualized. Notably, increased acetylation levels of H3K9, H3K27, and H3 were observed in p.Gly267Ser and p.Leu266Ser variants (red dashed rectangle), indicating a defective deacetylation function. (B) Quantitative analysis of acetylation levels at histone sites H3K9, H3K27, and H3 from (A). The p.Gly267Ser and p.Leu266Ser variants show increased acetylation levels compared to the WT at H3K9, H3K27, and H3, indicating impaired histone deacetylation function. ∗∗p < 0.01, ∗∗∗p < 0.001, ∗∗∗∗p < 0.0001, n = 3/data point. Data are plotted as mean ± SD. (C) HDAC assays were performed using H3K27ac-mononucleosomes or H3/H4Kac-mononucleosomes as substrates at various concentrations (0, 60, 120 nM) in conjunction with 100 nM of acetylated mononucleosomes. The deacetylation activities of complexes comprising either the NCoR1 DAD domain-HDAC3 WT or variant forms were measured for histone H3K27ac, H3ac, and H4ac in triplicate (n = 3/data point). The results are plotted as mean ± SD. The p.Gly267Ser and p.Leu266Ser variants do not result in histone acetylation levels, indicating defective HDAC activity. In contrast, the p.Ala110Thr and p.Arg359Cys variants retain deacetylation activities comparable to the WT form.
Figure 3
Figure 3
Proteomic analysis using co-immunoprecipitation reveals reduced interactions between HDAC3 variants and the subunits of NCoR and CoREST complexes (A) Volcano plots of protein interaction profiles for four selected HDAC3 variants (p.Ala110Thr, p.Gly267Ser, p.Leu266Ser, and p.Arg359Cys) compared to HDAC3 wild-type (WT) in HEK293T cells. The plots highlight important proteins involved in the NCoR and CoREST complexes or the proteasome pathway, with the x axis representing the log2 fold change (FC) and the y axis showing the −log10p value (measured in triplicate for each data point). (B) Schematic presentation of the NCoR and CoREST complexes, with the position of HDAC3 and its interacting subunits within each complex. (C) A heatmap summarizes the log2 FC in protein interactions for HDAC3 variants relative to WT. Each column represents a distinct protein, as highlighted in (A), and each row corresponds to the four tested HDAC3 variants. Blue shades denote decreased, and red shades indicate increased interaction strength. The data show decreased interactions with subunits of the NCoR and CoREST complexes and contrasted with an increased interaction tendency with subunits of the proteasome pathway, illustrating variant-specific effects on HDAC3 function and complex integrity. (D) Bar graphs display quantified protein levels using the intensity-based absolute quantification (iBAQ) method for three major proteins: NCoR1, NCoR2, and KDM1A. The data reveal a consistent reduction in association with the HDAC3 variants for these proteins. p < 0.05, ∗∗p < 0.01, ∗∗∗∗p < 0.0001. Data are plotted as mean ± SD (n = 3/data point).
Figure 4
Figure 4
Impaired interactions of HDAC3 variants with NCoR1/2 and KDM1A (A) Silver-stained SDS-PAGE analysis demonstrating the protein complexes co-immunoprecipitated (IP) with FLAG-tagged HDAC3 from HEK293T cells. Tested conditions include an empty vector (EV), wild type (WT), and HDAC3 variants (p.Ala110Thr, p.Gly267Ser, p.Leu266Ser, and p.Arg359Cys). The band intensities corresponding to the NCoR complex (indicated by red arrow) and KDM1A (indicated by blue arrow) are reduced in the variant forms. Specifically, the p.Ala110Thr shows a remarkable decrease in NCoR complex band intensity (red rectangle), and all variants exhibit diminished KDM1A bands (blue rectangle). (B) Western blot analyses confirm the differential co-immunoprecipitation of NCoR1, NCoR2, and KDM1A with HDAC3 variants, using an anti-FLAG antibody for immunoprecipitation. FLAG-tagged HDAC3 and GAPDH serve as a reference for protein levels and loading control, respectively. (C) Quantification of co-immunoprecipitated NCoR1, NCoR2, and KDM1A, normalized to the WT HDAC3 levels, based on the Western blot data in (B). This panel quantitatively depicts the significant interaction deficits in the p.Ala110Thr and p.Arg359Cys variants with NCoR1, NCoR2, and KDM1A, despite these variants retaining deacetylase activity comparable to WT. p < 0.05, ∗∗p < 0.01, ∗∗∗∗p < 0.0001. Data are plotted as mean ± SD (n = 3/data point).
Figure 5
Figure 5
Differential nuclear localization of HDAC3 variants in HEK293T cells (A) Immunofluorescence analysis of HEK293T cells transduced with wild-type (WT) or HDAC3 variants (p.Ala110Thr, p.Gly267Ser, p.Leu266Ser, and p.Arg359Cys). Cells were stained with an anti-FLAG antibody to visualize HDAC3 or its variants (green) and with DAPI to mark DNA (blue). HDAC3 WT prominently localizes in the nucleus, as shown by intense green fluorescence. In contrast, the p.Ala110Thr and p.Leu266Ser variants show notably weaker nuclear fluorescence and relatively stronger cytoplasmic fluorescence, implying compromised nuclear localization of HDAC3. In addition, the p.Gly267Ser variant exhibits relatively conserved nuclear localization similar to the WT, although the overall nuclear fluorescent intensity was weaker than the WT. (B) Quantitative assessment of nuclear localization. This panel presents the quantification of nuclear versus cytoplasmic fluorescence intensity, expressed as the nuclear-to-cytoplasmic (N/C) ratio, in cells transduced with WT or variant forms of HDAC3. Individual data points correspond to measurements from single cells, with the median value of each variant depicted by a horizontal red line (cell counts of approximately 30–50 cells were used for each condition in the analysis). The N/C ratios for p.Ala110Thr, p.Leu266Ser, and p.Arg359Cys variants are reduced in comparison to the WT, indicating a deficiency in nuclear localization. Conversely, the p.Gly267Ser variant exhibits an N/C ratio similar to the WT, though the broad spread of data points indicates variable localization within the cell population. Statistical significance is indicated by asterisks (∗∗∗∗p < 0.0001).

References

    1. Kuo M.H., Allis C.D. Roles of histone acetyltransferases and deacetylases in gene regulation. Bioessays. 1998;20:615–626. doi: 10.1002/(SICI)1521-1878(199808)20:8<615::AID-BIES4>3.0.CO;2-H. - DOI - PubMed
    1. Yang X.-J., Seto E. HATs and HDACs: from structure, function and regulation to novel strategies for therapy and prevention. Oncogene. 2007;26:5310–5318. doi: 10.1038/sj.onc.1210599. - DOI - PubMed
    1. Gallinari P., Di Marco S., Jones P., Pallaoro M., Steinkühler C. HDACs, histone deacetylation and gene transcription: from molecular biology to cancer therapeutics. Cell Res. 2007;17:195–211. doi: 10.1038/sj.cr.7310149. - DOI - PubMed
    1. Chen H.P., Zhao Y.T., Zhao T.C. Histone Deacetylases and Mechanisms of Regulation of Gene Expression. Crit. Rev. Oncog. 2015;20:35–47. doi: 10.1615/CritRevOncog.2015012997. - DOI - PMC - PubMed
    1. Lee C.-H., Wu J., Li B. Chromatin Remodelers Fine-Tune H3K36me-Directed Deacetylation of Neighbor Nucleosomes by Rpd3S. Mol. Cell. 2013;52:255–263. doi: 10.1016/j.molcel.2013.08.024. - DOI - PMC - PubMed

Substances

LinkOut - more resources