. 2024 Sep 5;31(9):1262-1279.e8.
doi: 10.1016/j.stem.2024.06.015. Epub 2024 Jul 23.

Analyzing embryo dormancy at single-cell resolution reveals dynamic transcriptional responses and activation of integrin-Yap/Taz prosurvival signaling

Affiliations

Analyzing embryo dormancy at single-cell resolution reveals dynamic transcriptional responses and activation of integrin-Yap/Taz prosurvival signaling

Rui Chen et al. Cell Stem Cell. .

Abstract

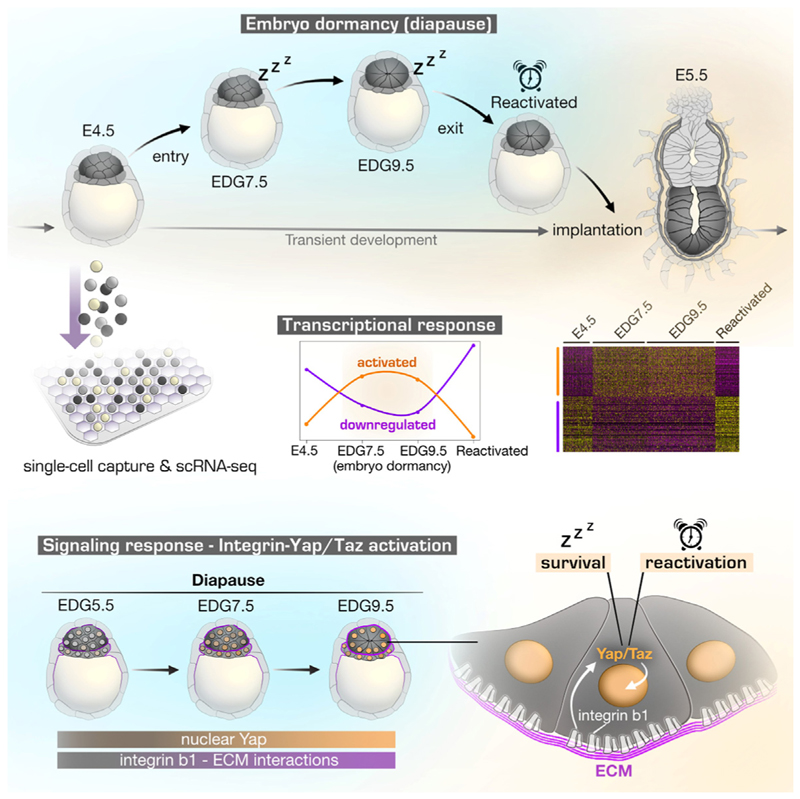
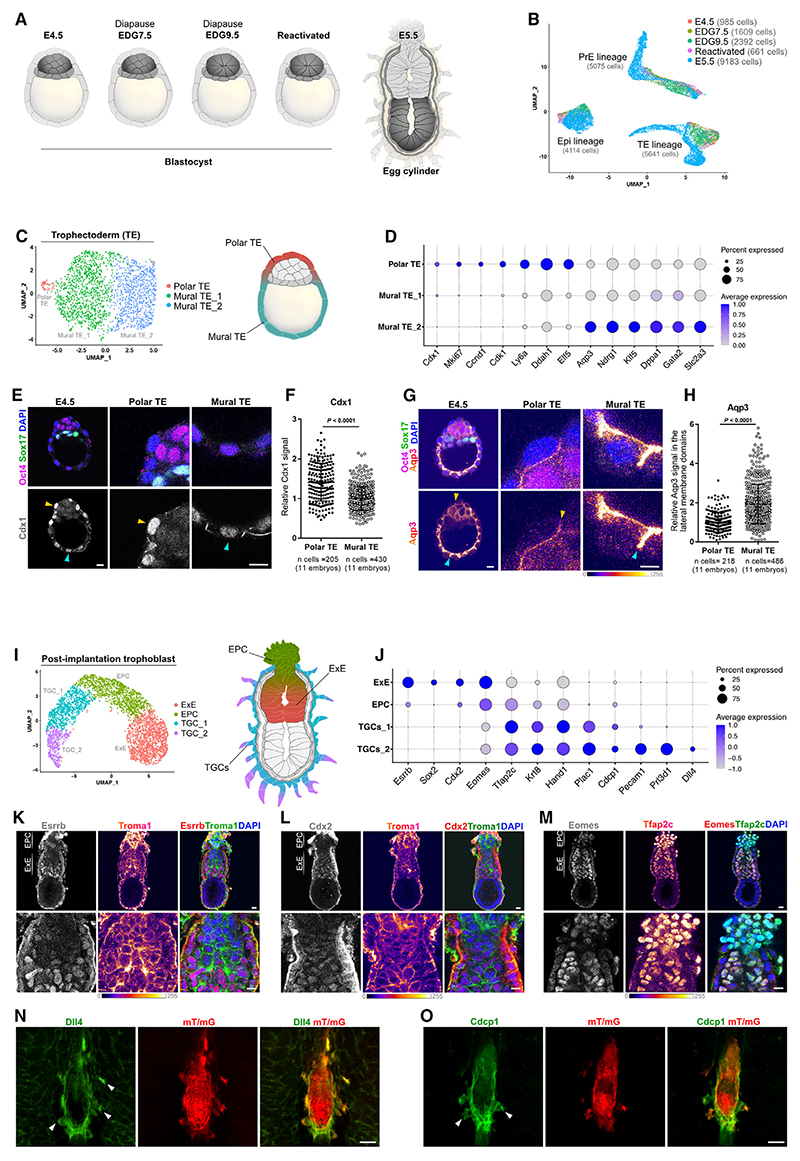
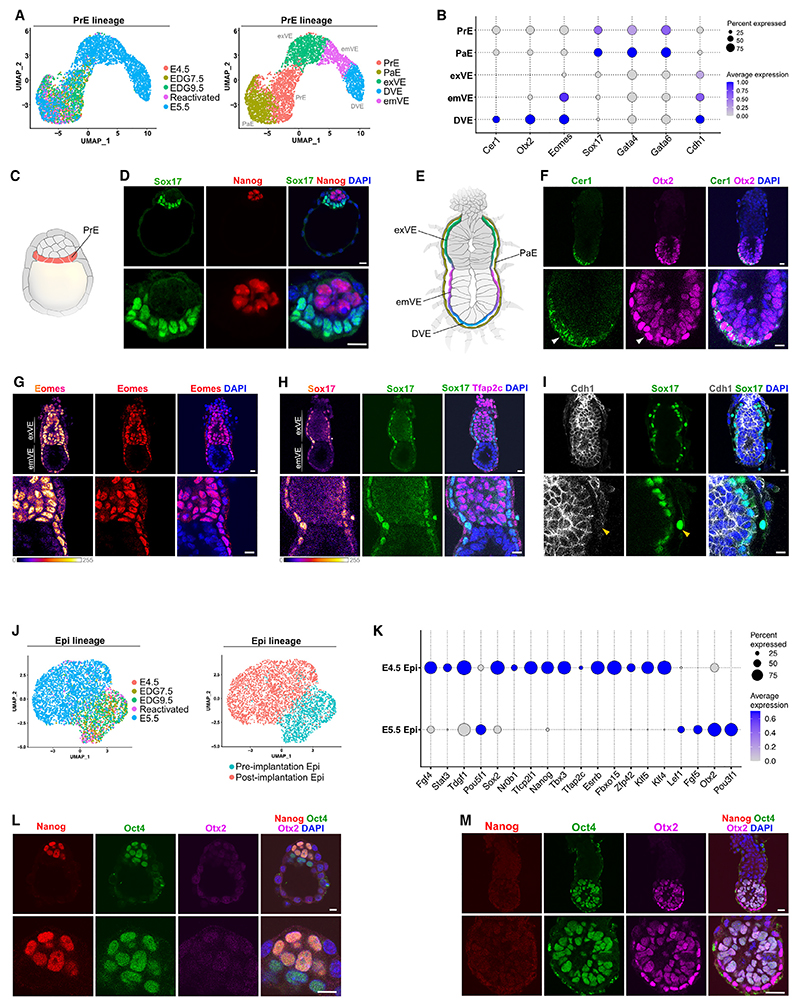
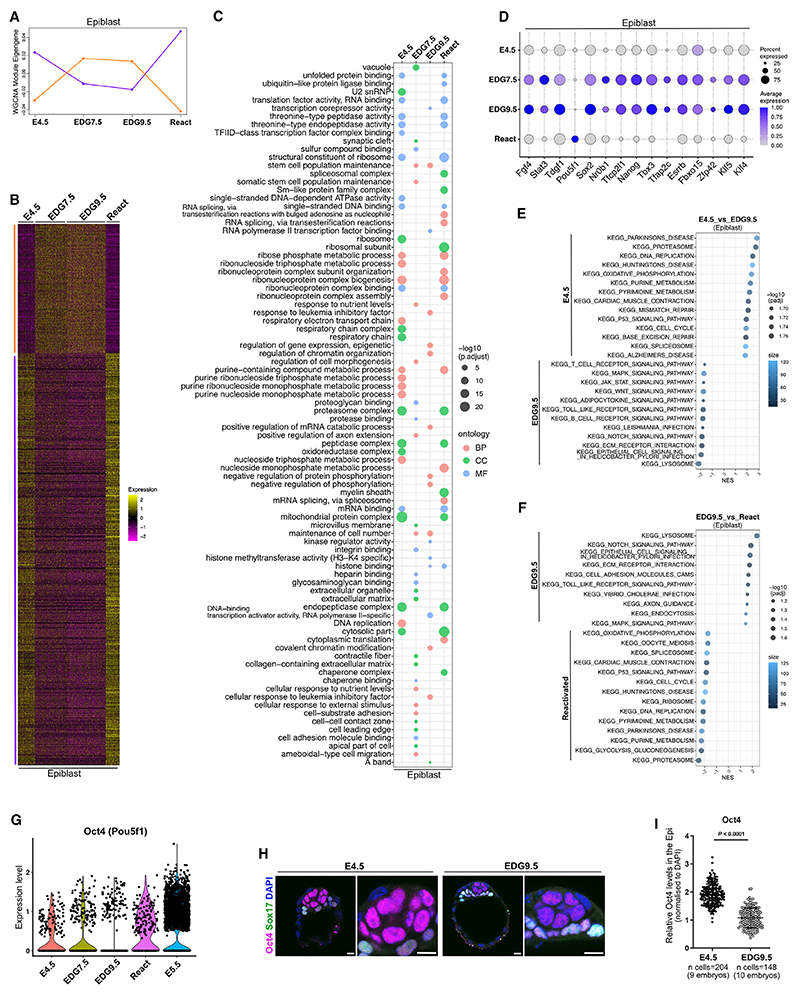
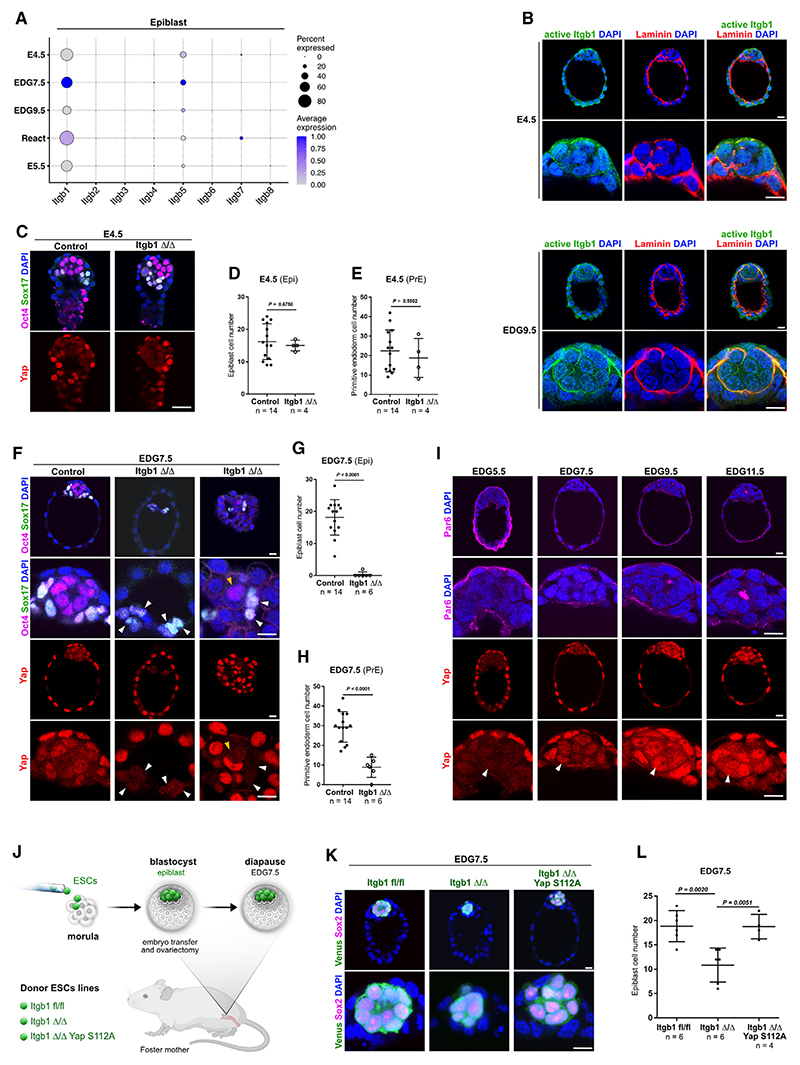
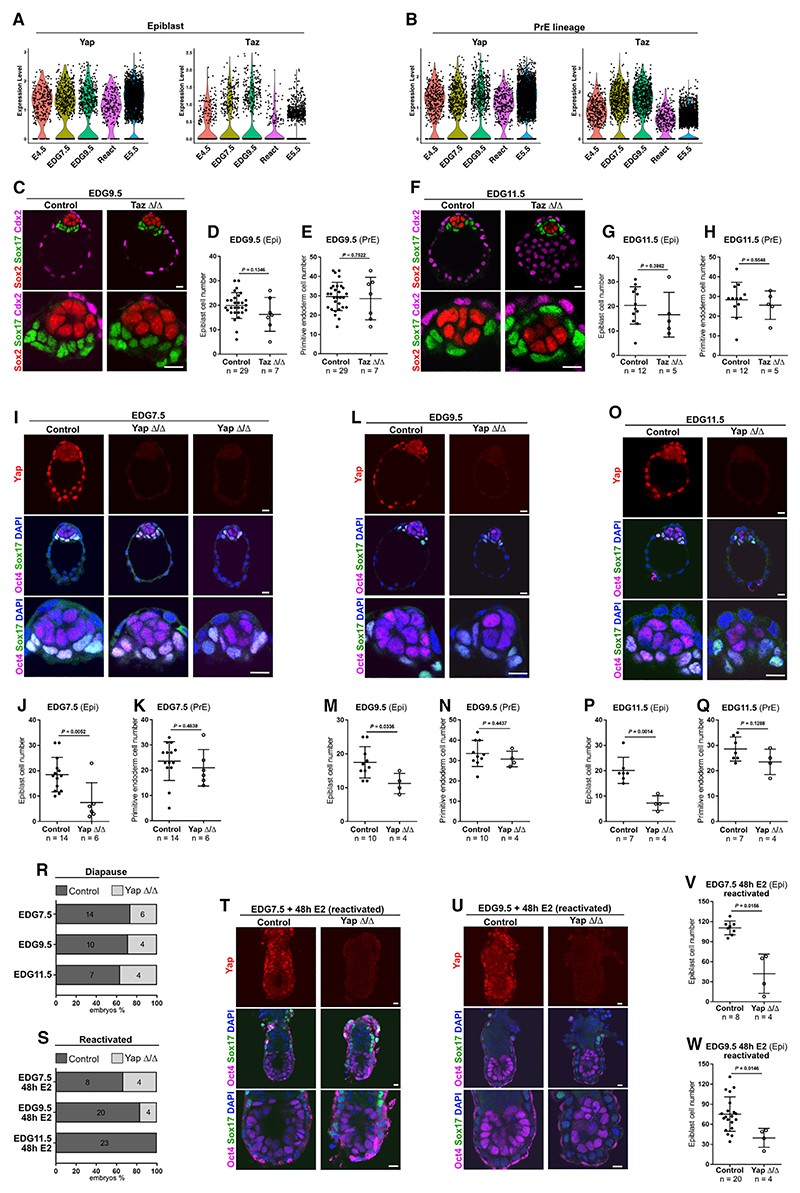
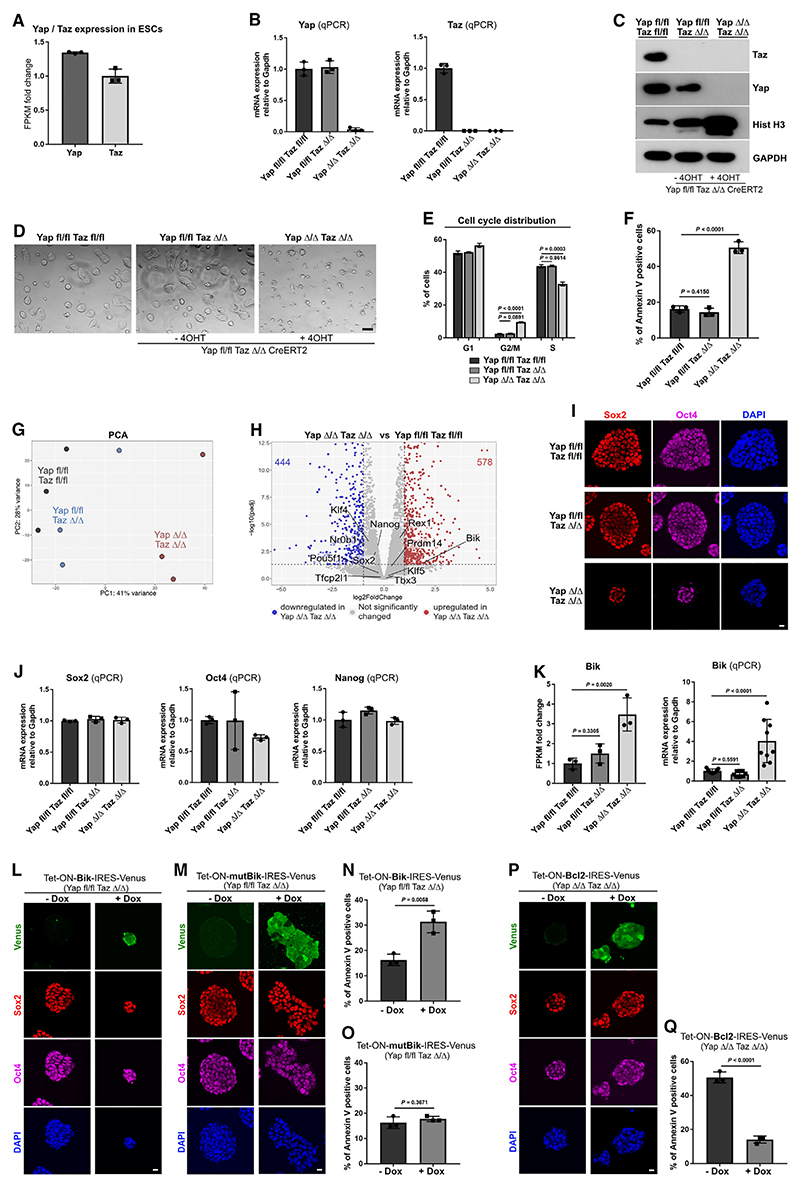
Embryonic diapause is a reproductive adaptation that enables some mammalian species to halt the otherwise continuous pace of embryonic development. In this dormant state, the embryo exploits poorly understood regulatory mechanisms to preserve its developmental potential for prolonged periods of time. Here, using mouse embryos and single-cell RNA sequencing, we molecularly defined embryonic diapause at single-cell resolution, revealing transcriptional dynamics while the embryo seemingly resides in a state of suspended animation. Additionally, we found that the dormant pluripotent cells rely on integrin receptors to sense their microenvironment and preserve their viability via Yap/Taz-mediated prosurvival signaling.

Keywords: Taz; Yap; embryo dormancy; embryonic diapause; embryonic stem cells; epiblast; extracellular matrix; integrin; pluripotency; single-cell RNA sequencing.


Conflict of interest statement

Declaration of interests The authors declare no competing interests.

Figures

Graphical abstract
Graphical abstract
Figure 1
Figure 1. Cellular heterogeneity in the trophoblast lineage
(A) Overview of the sampled developmental time points. (B) UMAP plot of the examined transcriptomes. (C) UMAP plot of the TE cells. (D) Marker genes of the TE subpopulations. (E) Cdx1 expression at E4.5. Yellow arrowheads, polar TE; cyan arrowheads, mural TE. (F) Quantification of relative fluorescence intensity for Cdx1 in the TE nuclei. Data were normalized to the average Cdx1 signal in the mural TE and presented as mean ± SD, n = number of cells, two-tailed unpaired Student’s t test. Three independent experiments. (G) Aqp3 expression at E4.5. Yellow arrowheads, polar TE; cyan arrowheads, the mural TE. (H) Quantification of relative fluorescence intensity for Aqp3 in the lateral membranes of TE at E4.5. Data were normalized to the average Aqp3 signal in the polar TE and presented as mean ± SD, n = number of cells, two-tailed unpaired Student’s t test. Two independent experiments. (I) UMAP plot of the E5.5 trophoblast subpopulations. (J) Marker gene expression in the E5.5 trophoblast. (K) E5.5 embryo stained for Esrrb, Troma1, and DAPI. (L) E5.5 embryo stained for Cdx2, Troma1, and DAPI. (M) E5.5 embryo stained for Eomes, Tfap2c, and DAPI. (N) Staining for tdTomato and Dll4 in E5.5 mT/mG embryo within the maternal tissues. White arrowheads, TGCs. (O) Staining for tdTomato and Cdcp1 in E5.5 mT/mG embryo within the maternal tissues. White arrowheads, TGCs. Scale bars: 10 μm in (E), (G), (K), (L), and (M) and 50 μm in (N) and (O). See also Figure S1.
Figure 2
Figure 2. Cellular heterogeneity in the PrE lineage and pluripotent states transition in the Epi
(A) UMAP plot of the PrE lineage cells (left) and subclustering (right). (B) Marker gene expression in the PrE lineage. (C) Schematic representation of blastocyst with PrE in orange. (D) E4.5 embryo stained for Sox17, Nanog, and DAPI. (E) Schematic representation of E5.5 mouse embryo with annotated DVE, emVE, exVE, and PaE. (F) E5.5 embryo stained for Cer1, Otx2, and DAPI. (G) E5.5 embryo stained for Eomes and DAPI. (H) E5.5 embryo stained for Sox17, Tfap2c, and DAPI. (I) E5.5 embryo stained for Cdh1, Sox17, and DAPI. (J) UMAP plot of the Epi cells. (K) Marker gene expression in the Epi. (L) E4.5 embryo stained for Nanog, Oct4, Otx2, and DAPI. (M) E5.5 embryo stained for Nanog, Oct4, Otx2, and DAPI. Scale bars, 10 μm. See also Figure S1.
Figure 3
Figure 3. Transcriptional dynamics in the Epi
(A) WGCNA identifies two modules of co-expressed genes in the Epi; x axis, developmental stages; y axis, log2-transformed, normalized intensity ratios in each stage. (B) Heatmap plot of 1,127 genes in the two co-expression modules in the Epi. (C) GO enrichment analysis in the Epi. MF, molecular function; BP, biological process; CC, cellular component. (D) Pluripotency marker gene expression. (E) KEGG pathways, E4.5 vs. EDG9.5 Epi. (F) KEGG pathways, EDG9.5 vs. reactivated Epi. (G) Oct4 expression in the Epi. (H) Oct4 expression at E4.5 and EDG9.5. (I) Quantification of relative fluorescence intensity for Oct4 in the Epi nuclei at E4.5 (two independent experiments) and EDG9.5 (three independent experiments) stages. The Epi cells are positive for Oct4 and negative for Sox17. Data were normalized to the average Oct4 signal in the EDG9.5 group and presented as mean ± SD, n = number of cells, two-tailed unpaired Student’s t test. Scale bars, 10 μm. See also Figure S2.
Figure 4
Figure 4. Integrin/Yap signaling during embryo dormancy
(A) Integrin beta subunits expression. (B) E4.5 and EDG9.5 embryos stained for active Itgb1, laminin, and DAPI. (C) E4.5 Itgb1 control and KO embryos stained for Oct4, Sox17, Yap, and DAPI. (D) Epi cell number at E4.5. Three independent experiments. (E) PrE cell number at E4.5. Three independent experiments. (F) EDG7.5 Itgb1 control and KO embryos stained for Oct4, Sox17, Yap, and DAPI. Yellow arrowheads, Epi; white arrowheads, PrE. (G) Epi cell number at EDG7.5. Five independent experiments. (H) PrE cell number at EDG7.5. Five independent experiments. (I) EDG5.5, EDG7.5, EDG9.5, and EDG11.5 embryos stained for Yap, Par6, and DAPI. Yap accumulation in the nuclei of the ICM is marked by arrowheads. (J) Schematic representation of the morula aggregation experiments. (K) EDG7.5 embryos harboring donor cells stained for Venus, Sox2, and DAPI. Separate channels are presented in Figure S4A. (L) Epi cell number in EDG7.5 embryos harboring donor cells. Three independent experiments for Itgb1 fl/fl or Itgb1 Δ/Δ and two independent experiments for Itgb1 Δ/Δ Yap S112A group. (D, E, G, and H) Data represent mean ± SD, n = number of embryos, two-tailed unpaired Student’s t test, p value is presented on the figures; (L) data represent mean ± SD, n = number of embryos, one-way ANOVA with Tukey’s post hoc test, p value is presented on the figures. Scale bars, 10 μm. See also Figures S3 and S4.
Figure 5
Figure 5. Yap/Taz function during embryo dormancy
(A) Yap and Taz expression in the Epi. (B) Yap and Taz expression in the PrE. (C) Taz control and KO EDG9.5 embryos stained for Sox2, Sox17, and Cdx2. (D) Epi cell number in Taz control and KO at EDG9.5. Six independent experiments. (E) PrE cell number in Taz control and KO at EDG9.5. Six independent experiments. (F) Taz control and KO EDG11.5 embryos stained for Sox2, Sox17, and Cdx2. (G) Epi cell number in Taz control and KO at EDG11.5. Four independent experiments. (H) PrE cell number in Taz control and KO at EDG11.5. Four independent experiments. (I) Yap control and KO EDG7.5 embryos stained for Yap, Oct4, Sox17, and DAPI. (J) Epi cell number in Yap control and KO at EDG7.5. Four independent experiments. (K) PrE cell number in Yap control and KO at EDG7.5. Four independent experiments. (L) Yap control (+/+) and KO (Δ/Δ) EDG9.5 embryos stained for Yap, Oct4, Sox17, and DAPI. (M) Epi cell number in Yap control and KO at EDG9.5. Four independent experiments. (N) PrE cell number in Yap control and KO at EDG9.5. Four independent experiments. (O) Yap control and KO EDG11.5 embryos stained for Yap, Oct4, Sox17, and DAPI. (P) Epi cell number in Yap control and KO embryos at EDG11.5. Three independent experiments. (Q) PrE cell number in Yap control and KO at EDG11.5. Three independent experiments. (R) Percentage of Yap control and KO at EDG7.5 (four independent experiments), EDG9.5 (four independent experiments), and EDG11.5 (three independent experiments) The number of embryos is indicated on the graph. (S) Percentage of Yap control and KO after 48 h of E2 administration at EDG7.5 (two independent experiments), EDG9.5 (four independent experiments), or EDG11.5 (four independent experiments). The number of embryos is indicated on the graph. (T) Yap control and KO embryos isolated after 48 h of E2 administration at EDG7.5 and stained for Yap, Oct4, Sox17, and DAPI. (U) Yap control and KO embryos isolated after 48 h of E2 administration at EDG9.5 and stained for Yap, Oct4, Sox17, and DAPI. (V) Epi cell number in Yap control and KO after 48 h of E2 administration at EDG7.5. (W) Epi cell number in Yap control and KO after 48 h E2 administration at EDG9.5 based on Oct4 expression. (D, E, G, H, J, K, M, N, P, Q, V, and W) Data represent mean ± SD, n = number of embryos, two-tailed unpaired Student’s t test, and p value is presented on the figures. Scale bars, 10 μm. See also Figure S4.
Figure 6
Figure 6. Yap/Taz function in ESCs
(A) Yap and Taz expression in ESCs, based on Fan et al. Data represent mean ± SD, n = three technical replicates. (B) qPCR of Yap and Taz expression relative to GAPDH. (C) Western blot analysis of Yap and Taz levels at day 2 of culture. (D) Brightfield images on day 2 of culture. (E) Cell cycle distribution determined by EdU assay. Data represent mean ± SEM, one-way ANOVA with Tukey’s post hoc test, p value is presented on the figures, n = three independent experiments. (F) Annexin V assay at day 2 of culture. (G) Principal component analysis (PCA) of the transcriptomes; n = three independent RNA-seq datasets for each condition. (H) Volcano plot of gene expression. (I) Sox2 and Oct4 expression analysis. (J) qPCR of Sox2, Oct4, and Nanog expression relative to GAPDH. (K) Gene expression of Bik based on the RNA-seq analysis (left) and qPCR relative to GAPDH (right). (L) Control and ectopically expressing Bik Yap fl/fl Taz Δ/Δ ESCs at day 2, stained for Venus, Sox2, Oct4, and DAPI. (M) Control and ectopically expressing mutBik Yap fl/fl Taz Δ/Δ ESCs at day 2, stained for Venus, Sox2, Oct4, and DAPI. (N) Annexin V assay of control and ectopically expressing Bik Yap fl/fl Taz Δ/Δ ESCs at day 2. (O) Annexin V assay of control and ectopically expressing mutBik Yap fl/fl Taz Δ/Δ ESCs at day 2. (P) Control and ectopically expressing Bcl2 Yap Δ/Δ Taz Δ/Δ ESCs at day 2, stained for Venus, Sox2, Oct4, and DAPI. (Q) Annexin V assay of control and ectopically expressing Bcl2 Yap Δ/Δ Taz Δ/Δ ESCs at day 2. (B and J) Data represent mean ± SD, n = three independent experiments for each figure; (N, O, and Q) data represent mean ± SD, two-tailed unpaired Student’s t test, n = three independent experiments for each figure, p value is presented on the figures; (F and K) data represent mean ± SD, one-way ANOVA with Tukey’s post hoc test, n = three independent experiments for each figure, p value is presented on the figures. Scale bars, 10 μm. See also Figures S5 and S6.

Similar articles

Cited by

References

    1. Ma WG, Song H, Das SK, Paria BC, Dey SK. Estrogen is a critical determinant that specifies the duration of the window of uterine receptivity for implantation. Proc Natl Acad Sci USA. 2003;100:2963–2968. doi: 10.1073/pnas.0530162100. - DOI - PMC - PubMed
    1. Renfree MB, Shaw G. Diapause. Annu Rev Physiol. 2000;62:353–375. - PubMed
    1. MacLean Hunter SM, Evans M. Non-surgical method for the induction of delayed implantation and recovery of viable blastocysts in rats and mice by the use of tamoxifen and Depo-Provera. Mol Reprod Dev. 1999;52:29–32. doi: 10.1002/(SICI)1098-2795(199901)52:1<29∷AID-MRD4>3.0.CO;2-2. - DOI
    1. Yoshinaga K, Adams CE. Delayed implantation in the spayed, progesterone treated adult mouse. J Reprod Fertil. 1966;12:593–595. - PubMed
    1. Fan R, Kim YS, Wu J, Chen R, Zeuschner D, Mildner K, Adachi K, Wu G, Galatidou S, Li J, et al. Wnt/beta-catenin/Esrrb signalling controls the tissue-scale reorganization and maintenance of the pluripotent lineage during murine embryonic diapause. Nat Commun. 2020;11:5499. doi: 10.1038/s41467-020-19353-0. - DOI - PMC - PubMed

MeSH terms

Substances