. 2024 Aug;632(8027):1092-1100.
doi: 10.1038/s41586-024-07816-z. Epub 2024 Jul 24.

Neural circuit basis of placebo pain relief

Affiliations

Neural circuit basis of placebo pain relief

Chong Chen et al. Nature. 2024 Aug.

Abstract

Placebo effects are notable demonstrations of mind-body interactions1,2. During pain perception, in the absence of any treatment, an expectation of pain relief can reduce the experience of pain-a phenomenon known as placebo analgesia3-6. However, despite the strength of placebo effects and their impact on everyday human experience and the failure of clinical trials for new therapeutics7, the neural circuit basis of placebo effects has remained unclear. Here we show that analgesia from the expectation of pain relief is mediated by rostral anterior cingulate cortex (rACC) neurons that project to the pontine nucleus (rACC→Pn)-a precerebellar nucleus with no established function in pain. We created a behavioural assay that generates placebo-like anticipatory pain relief in mice. In vivo calcium imaging of neural activity and electrophysiological recordings in brain slices showed that expectations of pain relief boost the activity of rACC→Pn neurons and potentiate neurotransmission in this pathway. Transcriptomic studies of Pn neurons revealed an abundance of opioid receptors, further suggesting a role in pain modulation. Inhibition of the rACC→Pn pathway disrupted placebo analgesia and decreased pain thresholds, whereas activation elicited analgesia in the absence of placebo conditioning. Finally, Purkinje cells exhibited activity patterns resembling those of rACC→Pn neurons during pain-relief expectation, providing cellular-level evidence for a role of the cerebellum in cognitive pain modulation. These findings open the possibility of targeting this prefrontal cortico-ponto-cerebellar pathway with drugs or neurostimulation to treat pain.


Conflict of interest statement

During part of this project, M.J.S. was a consultant for and had a financial interest in Inscopix, the company that makes the miniature microscope used for Ca2+ imaging in this study.

Figures

Fig. 1
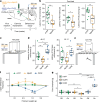
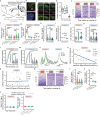
Fig. 1. Expectation of pain relief activates the rACC→Pn pathway.
a, PAC assay and representative traces of mouse locomotion. Pre, pre-conditioning test; Post, post-conditioning test. b, The time spent in chamber 2 (F1,85 = 48.84, P = 3 × 10−8). c, The latency of the first crossing back (F1,85 = 38.45, P = 5 × 10−7). d, The latency preceding first paw licking (left; P = 0.001), rearing (middle; P = 0.028) and jumping (right; P = 0.013) after reaching chamber 2 during the post-test. e, Nocifensive behaviours after the first border crossing during the post-test. The grey highlighted region indicates the estimated duration (~45 s) of PAC-induced pain relief. f, The frequency of licking (left; P = 0.04) and rearing (middle; P = 0.06) and the duration of rearing (right; P = 0.007) during the first 45 s after the first border crossing on the post-test day in e. g, The strategy to label rACC neurons that are active during PAC. Scale bar, 2 mm. h, Image of rACC neuron cell bodies. i, The density of TRAPed ACC neurons (P = 2 × 10−5). n = 12 per group. Scale bars, 100 μm. j, Axon terminals of TRAPed rACC neurons. CPu, caudate putamen; MD, mediodorsal thalamic nucleus; Th, thalamus; VPM, ventral posteromedial thalamic nucleus; ZI, zona incerta. Scale bars, 100 μm. k, The axon terminal density in each area (F1,63 = 131.691, P = 2 × 10−16). n = 9 and 6 (CPu); 7 and 6 (ZI); 5 and 8 (MD); and 6 and 7 (VPM and Pn) in the control and conditioned groups, respectively. Statistical analysis was performed using two-way analysis of variance (ANOVA) with Tukey post hoc test (b, c and k), two-sided Wilcoxon rank-sum tests (d, f and i). For af, n = 9 (control) and 10 (conditioned). For the box plots, the centre lines show the median values, the box limits show the quartiles, and the whiskers show the most extreme datapoints ≤interquartile range from the box edges. For b and c, data are mean ± s.e.m. *P < 0.05, **P < 0.01 and ***P < 0.001. Source Data
Fig. 2
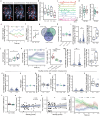
Fig. 2. Elevated activity of rACC→Pn neurons during pain-relief expectation.
a, The strategy to monitor rACC→Pn neuron activity. Scale bar, 2 mm. b, Maximal projection of a Ca2+ video with 82 rACC→Pn neurons. Scale bar, 50 μm. c, z-scored Ca2+ activity for the neurons numbered in b. d, rACC→Pn neuron activity during the first border crossing. e,f, rACC→Pn neuron activity averaged for individual neurons (e; F2,612 = 5.16, P = 0.006; n = 205) and individual mice (f; F2,15 = 15.6, P = 0.0002; n = 6). g, rACC→Pn neuron activity during border crossings on the post-test day. h,i, Averaged rACC→Pn neuron activity for individual neurons (h; F2,954 = 10.13, P = 4 × 10−5; n = 320) and individual mice (i; F2,15 = 16.8, P = 0.0002; n = 6). j, The latency preceding the first border crossing against the averaged signal of rACC→Pn neurons for each mouse, with the linear regression fit. k, Recording (rec.) configuration of rACC→Pn neurons. IN, local interneurons; PN, pyramidal neurons; II/III, layers II and III of ACC. l, EPSCs evoked at different holding potentials. The dot represents the peak AMPAR EPSC; the dashed line indicates the NMDAR EPSC amplitude. m, The AMPAR/NMDAR ratio (P = 0.03). n = 11 (Ctrl) and 10 (Cond.) neurons. n, TBS-induced EPSC amplitude changes. Inset: averaged EPSCs before and after TBS. n = 6 neurons per group. o, Recordings of isolated EPSCs and IPSCs. The arrows indicate the onset of electrical stimulation to onset of EPSCs and IPSCs. p, The EPSC–IPSC conductance ratio (P = 0.005). q, The EPSC–IPSC delay (P = 8 × 10−5). n = 8 (Ctrl) and 10 (Cond.) neurons. Statistical analysis was performed using one-way ANOVA with Tukey post hoc test (e, f, h and i), two-sided Wilcoxon rank-sum tests (m, p and q) and Pearson’s two-sided correlation tests (l). For d and g, neurons are ordered by mean Ca2+ activity for each condition. For the box plots, the centre lines show the median values, the box limits show the quartiles, and the whiskers show the most extreme datapoints ≤interquartile range from the box edges. For n, data are mean ± s.e.m. *P < 0.05, **P < 0.01 and ***P < 0.001. Source Data
Fig. 3
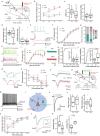
Fig. 3. Optogenetic manipulation of the rACC→Pn pathway affects PAC-induced analgesia and pain behaviours.
a, The strategy and experimental timeline to optogenetically manipulate the activity of the rACC→Pn pathway. Scale bar, 2 mm. b, The latency preceding first paw licking (left; P = 0.005), rearing (middle; P = 0.04) and jumping (right; P = 0.009) during the post-test. n = 10 mice per group. c, The strategy to measure thermal pain using a hot plate while optogenetically activating or inhibiting the rACC→Pn pathway. d, The latency preceding paw withdrawal on a 48 °C plate (left; F2,26 = 10.66, P < 0.001) or 52 °C plate (right; F2,26 = 7.38, P = 0.003). n = 10 (eYFP control), 10 (NpHR) and 9 (ChR2) mice. e, The strategy to measure the mechanical pain threshold with von Frey filaments while optogenetically activating or inhibiting the rACC→Pn pathway. f, Quantification of changes in paw withdrawal frequency in response to six different von Frey filaments induced by optogenetic manipulation of the rACC→Pn pathway (F2,156 = 62.965, P = 2 × 10−16). n = 10 (eYFP control), 10 (NpHR) and 9 (ChR2) mice. g, The pain threshold of mice with or without light stimulation (F2,26 = 25.98, P = 1.3 × 10−9). n = 10 (eYFP control), 10 (NpHR) and 9 (ChR2) mice. Statistical analysis was performed using two-sided Wilcoxon rank-sum tests (b), one-way ANOVA with Tukey post hoc test (d) and two-way ANOVA with Tukey post hoc test (f and g). For the box plots, the centre lines show the median values, the box limits show the quartiles, and the whiskers show the most extreme datapoints ≤interquartile range from the box edges. For f, data are mean ± s.e.m. *P < 0.05, **P < 0.01 and ***P < 0.001. Source Data
Fig. 4
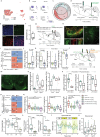
Fig. 4. Oprd1+ Pn neurons and cerebellar Purkinje cells participate in PAC-induced analgesia.
a, The strategy to characterize gene expression in the Pn using single-cell transcriptomics. Scale bar, 1 mm. D, dorsal; L, lateral. b, Pn neurons in low-dimensional uniform manifold approximation and projection (UMAP) space, colour coded by cluster. E, excitatory; I, inhibitory. c, Opioid and cluster-specific gene expression. d, Euler diagram depicting Oprm1 and Oprd1 expression in Pn excitatory neurons. e, Fluorescence in situ hybridization verifying Oprd1 expression by excitatory Pn neurons. Scale bar, 50 µm. f, The strategy to optogenetically manipulate the activity of Oprd1+ neurons in the Pn. Scale bar, 2 mm. g, The latency preceding first paw licking (left; P = 0.01), rearing (middle; P = 0.07) and jumping (right; P = 0.01) during the post-test with photoinhibition of eYFP control versus NpHR mice. n = 8 (eYFP control) and 9 (NpHR) mice. h, The strategy to monitor Purkinje cell activity using a miniscope. Scale bar, 2 mm. i, The mean projection of a Ca2+ video with 89 Purkinje cells. In total, 40 cross-day-aligned Purkinje cells were classified into clusters 1 or 2. Scale bar, 100 μm. j, Ca2+ trace of 5 Purkinje cells in each cluster. k, Purkinje cell activity during the first border crossing. For each cluster, neurons are ordered by mean Ca2+ activity during the last day of conditioning. l,m, Cluster 1 Purkinje cell activity averaged for individual neurons (l; F2,171 = 23.63, P = 8.6 × 10−10; n = 58) and individual mice (m; F2,15 = 13.94, P = 0.0003; n = 6). Statistical analysis was performed using two-sided Wilcoxon rank-sum tests (g) and one-way ANOVA with Tukey post hoc test (l and m). For the box plots, the centre lines show the median values, the box limits show the quartiles, and the whiskers show the most extreme datapoints ≤interquartile range from the box edges. *P < 0.01 and ***P < 0.001. Source Data
Extended Data Fig. 1
Extended Data Fig. 1. Validation of an animal model for placebo analgesia investigation.
a, Experimental timeline to examine whether PAC-induced preference for chamber 2 is due to pain relief expectation. b, Latency for mice to cross back to chamber 1 for the first time (left; P = 1) and the proportion of time mice spent in chamber 2 (right; P = 0.91) while setting both chambers at 30 °C on the post-test day. n = 10 mice in each group. c, Experimental timeline to examine the timescale of PAC-induced analgesia (top). Comparison of the chamber preference and nociceptive behaviours of mice 1 (Day 7), 3 (Day 10), and 7 (Day 14) days after the conditioning phase of PAC (bottom). n = 10 in each group. d, Experimental timeline for the PAC assay (left) with naloxone injection during the post-test to test the dependency of PAC-induced pain relief on the endogenous opioid system. e, Latency for mice to cross back to chamber 1 for the first time (left; F(1,37) = 1.54, P = 0.66) and the proportion of time mice spent in chamber 2 (right; P = 0.22) after saline (red) or naloxone (purple) injection on the post-test day. n = 10 mice in each group. f, Latency preceding first paw licking (left; P = 0.007), rearing (middle; P = 0.07), and jumping (right; P = 0.007) behaviour after reaching chamber 2 on the post-test day for saline- or naloxone-injected mice. n = 10 mice in each group. g, Experimental timeline for the PAC assay (left) with naloxone injection during the conditioning phase to test the dependency of PAC-associated learning on the endogenous opioid system. h, Latency for mice to cross back to chamber 1 for the first time (left; P = 0.07) and the proportion of time mice spent in chamber 2 (right; P = 0.02) after saline (yellow) or naloxone (blue) injection on the post-test day. n = 10 mice in each group. i, Latency preceding first paw licking (left; P = 0.91), rearing (middle; P = 0.01), and jumping (right; P = 0.14) behaviour after reaching chamber 2 on the post-test day for saline- or naloxone-injected mice. n= 10 mice in each group. j, Experimental timeline to examine chemical pain sensitivity of mice during the post-test. k, Boxplots of the proportion of time mice spent in chamber 2 (left) and the duration of attending behaviours during the whole formalin test (right) in Ctrl and Cond groups. n = 4, 6 mice in Ctrl and Cond. l, Similar to (k), but for the first 3 min after formalin injection (P = 0.005 for time spent in chamber 2 and P = 0.03 for attending duration). n = 4, 6 mice in Ctrl and Cond. m, Experimental timeline to examine mechanical, thermal, and chemical pain sensitivity of mice after the conditioning phase of PAC. n, Boxplots of the mechanical (left), thermal (middle), and chemical (right) pain sensitivity after the conditioning phase of PAC, measured with von Frey, Hargreaves, and formalin injection, respectively. n = 10 mice in each group. o, Experimental timeline and strategy to examine the nocifensive behaviours of mice after confining them in either chamber 1 or chamber 2 by blocking the opening between chambers. p, Latency preceding first paw licking (left), rearing (middle), and jumping (right) behaviours of mice confined in chamber 1 (purple) and chamber 2 (red) on the post-test day. n = 5 mice in each group. q, Experimental timeline for the PAC with female mice. r, Boxplots of the latency for female mice to cross back to chamber 1 for the first time (left) and the proportion of time mice spent in chamber 2 (right) in Ctrl and Cond groups. n = 10 mice in each group. s, Latency preceding first paw licking (left; P = 0.01), rearing (middle), and jumping (right; P = 0.07) behaviour after reaching chamber 2 on the post-test day for female mice in Ctrl and Cond groups. n = 10 mice in each group. Two-sided Wilcoxon rank-sum test was used in (b), (f), (i), (k), (l), and (s); two-way ANOVA, Tukey post-hoc test in (e) and (h). In boxplots, horizontal lines represent median; boxes, quartiles; whiskers, most extreme data points ≤ interquartile range from box edges; and single points, data from individual cells or mice. Source Data
Extended Data Fig. 2
Extended Data Fig. 2. Monosynaptic connection between rACC and Pn.
a, Schematic illustration of the viral strategy to trace projections from the rACC and motor cortex to the Pn. b, Injection sites in the motor cortex (top), rACC (middle), and the overlay (bottom). Scale bars, 500 μm. c, Projections from the rACC and motor cortex to the Pn. Note that the infected neurons in the motor cortex and rACC do not overlap and that the rACC only targets the rostral part of the Pn. Scale bars, 100 μm. d, Schematic illustration of the viral strategy to identify the brain areas that project to the Pn. SL1, stem-loop 1. e, Representative photomicrographs of labelled Pn projection neurons in several brain areas. M1, primary motor cortex; ACC, anterior cingulate cortex; S1, primary somatosensory cortex; S2, secondary somatosensory cortex; V1, primary visual cortex; CeA, central nucleus of the amygdala; Crus I, crus I of the ansiform lobule; Sp5I, interpolar nucleus. Scale bars, 100 μm. f, Schematic illustration of the strategy to test the synaptic connections between ACC projection neurons and neurons in the Pn. g, Confocal micrograph of two Pn neurons filled with biocytin during recording and labelled using a fluorescent conjugate of streptavidin. Scale bar, 50 μm. h, Average EPSC (black) of a Pn neuron holding at −70 mV evoked by photostimulation of rACC fibres. Adding CNQX (10 μM) in the perfusion solution abolished the EPSCs (red; left). EPSCs in a Pn neuron evoked by photostimulation of rACC fibres (top). TTX (1 μM) abolishes this response (middle), while 4-AP (1 mM) restores the response blocked by TTX (red, bottom).
Extended Data Fig. 3
Extended Data Fig. 3. PAC increases the activity of rACC→Pn neurons.
a, Cross-day alignment of rACC→Pn neurons across Pre, Cond, and Post phases of PAC using TRACKER. Neurons matched across 3 days are outlined in blue. Scale bar, 50 μm. b, Boxplot of the number of detected rACC→Pn neurons during Pre (grey), Cond (green), and Post (blue) phases, and the number of cross-day-aligned neurons (red). n = 6 mice. c, Z-scored activity traces (coloured traces) for the 10 neurons in (a). Raster traces show the binarized patterns of activity for each neuron. d, Mice with intracranial virus injection, GRIN lens implantation, and miniature microscope mounting (Mini) showed no difference in total walking distance and average movement speed versus mice without these manipulations (Ctrl) during PAC. n = 17 and 6 mice in Ctrl and Mini groups. e, Average Ca2+ activity of rACC→Pn neurons during first border crossing as a function of time in Pre (red), day 5 (green), and day 6 (blue). Note that their activity increased progressively during the conditioning phase of PAC. f, Line graph showing the progressively increased activity of rACC→Pn neurons during the conditioning phase of PAC. n = 6 mice in each group. g, Venn diagram showing cross-day-aligned rACC→Pn neurons that show increased activity in pairwise comparisons between Pre, Cond, and Post. h, Boxplots of the proportion of cross-day-aligned rACC→Pn neurons that show increased activity in pairwise comparisons between Pre, Cond, and Post. n = 6 mice. i, Discriminability index (d’) calculated between first crossing and crossing back for Ca2+ traces, averaged for individual neurons (left; P = 2 × 10−7; n = 233) and individual mice (right; P = 0.03; n = 6). j, Average firing rate of rACC→Pn neurons during first border crossing in Pre (cyan), Cond (green) and Post (blue; one-way ANOVA, Tukey post-hoc test, F(2,15) = 5, P = 0.022; n = 6 mice). k, Average firing rate as a function of time of rACC→Pn neurons during first border crossing in Pre (cyan), Cond (green) and Post (blue). l, Average firing rate of rACC→Pn neurons during first border crossing (red), first crossing back (green) and last border crossing (blue) on post-test day (one-way ANOVA, Tukey post-hoc test, F(2,15) = 16.8, P = 0.001; n = 6 mice). m, Discriminability index (d’) calculated between first crossing and crossing back for firing rate, averaged for individual neurons (left; two-sided Wilcoxon matched-pairs signed-rank test, P = 0.004; n = 233 neurons) and for individual mice (right; two-sided Wilcoxon matched-pairs signed-rank test, P = 0.07; n = 6). n, Control for (i, left) with randomized border crossing time. o, Control for Fig. 2f with randomized border crossing time. p, Control for (i, right) with randomized border crossing time. q, Control for (j) with randomized border crossing time. r, Control for (m, left) with randomized border crossing time. s, Control for (m, right) with randomized border crossing time. t, Boxplots of the correlation coefficient between the activity of rACC→Pn neurons and the velocity of mice during PAC with real neuronal activity trace (red) or randomly shuffled traces (green). n = 6 mice in each group. u, Scatterplot depicting the relationship between the Ca2+ activity of rACC→Pn neurons and the velocity of mice, specifically during periods of high neuronal activity in the pre-test. Shaded area represents the 95% confidence interval. v, Similar to (u), but specifically for periods during which mice display high moving velocity in the pre-test. Shaded area represents the 95% confidence interval. w, Average Ca2+ activity of rACC→Pn neurons over time during the first border crossing, illustrated in a longer time scale for Pre (cyan), Cond (green), and Post (blue). Note that the activity of rACC→Pn neurons decreases after reaching chamber 2 in Cond and Post. n = 6 in each group. Shaded area represents mean ± SEM. Pearson's two-sided correlation test in (u, v). In boxplots, horizontal lines represent median; boxes, quartiles; whiskers, most extreme data points ≤ interquartile range from box edges; and single points, data from individual cells or mice. Data in (f), and shaded area in (k) and (w) are mean ± SEM.
Extended Data Fig. 4
Extended Data Fig. 4. rACC IT neurons are not activated during pain relief expectation.
a, Strategy and experimental timeline to record IT neuron activity in the rACC during PAC using in vivo Ca2+ imaging. b, Maximal projection of a Ca2+ video with 37 IT neurons. Scale bar, 50 μm. c, Z-scored activity traces (coloured traces) of the 10 example IT neurons outlined in (b). d, Boxplot of the number of detected IT neurons during Pre (grey), Cond (green), and Post (blue) phases, and the number of cross-day-aligned neurons (red; n = 3 mice). e, Activity of cross-day-aligned IT neurons (n = 133 cells from 3 mice) during first border crossing in Pre (left), Cond (middle) and Post (right) phases of PAC. Neurons are ordered according to their mean Ca2+ activity for each day. f, Averaged activity of IT neurons during first border crossing at the level of individual neurons in Pre (grey), Cond (green) and Post (blue) phases of PAC (one-way ANOVA, Tukey post-hoc test, F(2,396) = 2.19, P = 0.113; n = 133 neurons). g, Similar to (f), averaged for individual mice. h, Fisher information calculated between first crossing and crossing back for Ca2+ traces, averaged for individual neurons (two-sided Wilcoxon matched-pairs signed-rank test, P = 0.03; n = 133 neurons). i, Similar to (h), averaged for individual mice. n = 3 mice. j, Activity of cross-day-aligned IT neurons (n = 218 from 3 mice) during first border crossing (left), first crossing back (middle), and last border crossing (right) on post-test day. Neurons are ordered according to their mean Ca2+ activity for each condition. k, Averaged activity of IT neurons during first border crossing (red), first crossing back (green), and last border crossing (blue) at the level of individual cells on the post-test day (one-way ANOVA, Tukey post-hoc test, F(2,651) = 5.41, P = 0.004; n = 218 neurons). l, Similar to (k), for individual mice. n = 3 mice. m, Average firing rate of IT neurons during first border crossing in Pre (cyan), Cond (green), and Post (blue) phases of PAC. n = 3 mice. n, Average firing rate of rACC→Pn neurons during first border crossing (red), first crossing back (green), and last crossing (blue) on the post-test day. n = 3 mice. In boxplots, horizontal lines represent median; boxes, quartiles; whiskers, most extreme data points ≤ interquartile range from box edges; and single points, data from individual neurons or mice.
Extended Data Fig. 5
Extended Data Fig. 5. Ca2+ dynamics of rACC→Pn neurons during thermal and mechanical pain.
a, Strategy to measure innocuous mechanical, noxious mechanical, or noxious heat responses while monitoring the Ca2+ activity of rACC→Pn neurons. b, Average silhouette width plotted for cluster numbers k from 1 to 10. Dashed line indicates the number of clusters corresponding to the maximal silhouette width. c, Averaged response (10 trials) of individual neurons upon each stimulation. Dashed lines (red) indicate the time point of stimulation (n = 335, 238, and 284 neurons for innocuous mechanical, noxious mechanical and noxious heat, respectively). Red and blue bars represent the cluster to which each neuron belongs (cluster 1 or cluster 2, respectively). d, Average activity of neurons in response to innocuous mechanical, noxious mechanical and noxious heat for cluster 1 (left) and 2 (right). e, Average activity of individual neurons in response to innocuous mechanical, noxious mechanical and noxious heat in cluster 1 (left; one-way ANOVA, Tukey post-hoc test, F(2,286) = 20.26, P = 1.1 × 10−8; n = 124, 92, and 73 neurons for innocuous mechanical, noxious mechanical and noxious heat, respectively) and 2 (right; one-way ANOVA, Tukey post-hoc test, F(2,565) = 16.73, P = 5.1 × 10−6; n = 211, 146, and 211 neurons for innocuous mechanical, noxious mechanical and noxious heat, respectively). Note that innocuous mechanical stimuli induced an increase in the activity of neurons in cluster 1, but a decrease in the activity of neurons in cluster 2. f, Average Ca2+ activity of rACC→Pn neurons during innocuous mechanical (red), noxious mechanical (green), and noxious heat (blue; n = 5 mice). g, Similar to (c), with cross-session-aligned neurons (n = 118 neurons). h, Similar to (d), with cross-session-aligned neurons. i, Similar to (e), with cross-session-aligned neurons (cluster 1; left; one-way ANOVA, Tukey post-hoc test, F(2,67) = 3.9, P = 0.02; n = 25, 20, and 25 neurons for innocuous mechanical, noxious mechanical and noxious heat; cluster 2; right; one-way ANOVA, Tukey post-hoc test, F(2,281) = 3.2, P = 0.04; n = 93, 98, and 93 neurons for innocuous mechanical, noxious mechanical and noxious heat). j, Similar to (f), with cross-session-aligned neurons. k, Heatmap of rACC→Pn neuron activity relative to licking (left) and rearing (right) behaviours in the post-test of PAC. l, Average Ca2+ activity of rACC→Pn neurons during licking (red) and rearing (green). n = 6 mice. In boxplots, horizontal lines represent median; boxes, quartiles; whiskers, most extreme data points ≤ interquartile range from box edges; and single points, data from individual cells or mice. Shaded area in (d, f, h, j, l) represents mean ± SEM.
Extended Data Fig. 6
Extended Data Fig. 6. PAC alters the excitation and inhibition balance of rACC→Pn neurons.
a, Strategy to label Pn-projecting rACC neurons for electrophysiological recording. b, Time mice spent in chamber 2 during days 3–6 of PAC. n = 7, 8 in Ctrl and Cond groups. c, Boxplots of the resting membrane potential (RMP; left; P = 0.37) and the input resistance (right; P = 0.44) of rACC→Pn neurons from Ctrl and Cond mice. n = 14, 16 neurons in Ctrl and Cond groups, respectively. d, Boxplots of the peak amplitude (left; P = 0.85) and half-duration of the action potentials (right; P = 0.39). n = 14, 16 neurons in Ctrl and Cond groups, respectively. e, Action potential firing pattern of rACC→Pn neurons from littermate control (cyan) and PAC-conditioned mice (red). f, Action potential firing frequency evoked by different levels of injected current. n = 14 neurons/group. g, Percentage of rACC→Pn neurons displaying different numbers of spikelets in the first action potential. n = 14 neurons in Ctrl and 16 in Cond. h, Traces of the action potential firing pattern evoked by 1-s current injection (black, bottom) in tdTomato-negative (non rACC→Pn) neurons from Ctrl (green, top) and Cond (purple, middle) mice. i, Plot of the action potential firing frequency evoked by different levels of injected current (two-way ANOVA, Tukey post-hoc test, F(1,255) = 10.61, P = 0.001; n = 11, 22 neurons in Ctrl and Cond groups, respectively). j, Example traces of sEPSCs in a rACC→Pn neuron holding at −70 mV from a Ctrl mouse (cyan, top) and a Cond mouse (red, bottom). k, Cumulative histograms of sEPSC frequency from Ctrl (cyan) and Cond (red) mice. Inset: boxplot of sEPSC frequency (P = 0.56; n = 11 neurons in each group). l, Cumulative histograms of sEPSC amplitude from Ctrl (cyan) and Cond (red) mice. Inset: boxplot of the sEPSC peak amplitude (P = 0.028; n = 11 neurons in each group). m, Example traces of two EPSCs evoked at 50-ms intervals from Ctrl (cyan, top) and Cond (red, bottom) mice. n, Paired-pulse ratio as a function of Δt (20, 50, 100, 200, 500 ms) between two stimuli (two-way ANOVA, Tukey post-hoc test, F(1,87) = 0.37, P = 0.54) of the inputs to rACC→Pn neurons from Ctrl (cyan) and Cond (red) mice. n = 8, 11 in Ctrl and Cond groups. o, Recordings of mixed EPSCs and IPSCs while holding rACC→Pn neurons at −30 mV from Ctrl (cyan, top) and Cond (red, bottom) mice. Because the holding potential is between the reversal potentials for excitatory and inhibitory events, EPSCs are inwardly directed and IPSCs outwardly directed. p, Strategy to express excitatory opsin (ChR2) in PV+ interneurons and label the Pn-projecting rACC neurons for electrophysiological recording. q, Example trace of the action potential firing from a PV+ interneuron in the rACC (top) evoked by current injection (bottom). r, Whole-cell recording configuration to analyse the feedforward inhibition from PV+ interneurons to rACC→Pn neurons. A blue light (494 nm, 1 ms) was given to evoke neurotransmitter release from PV+ interneurons. s, Example trace showing a light-evoked IPSC (blocked by 10 μM SR-95531) in one rACC→Pn neuron from a control mouse. Blue bar indicates the time point of light stimulation. t, Boxplots of 20–80% rise time (left; P = 0.96) and half-duration (right; P = 0.65) of IPSCs from Ctrl (cyan) and Cond (red) mice. n = 8 neurons in each group. u, Paired-pulse ratio as a function of Δt between two light stimulations (20, 50, 100, 200, 500 ms) of the inhibitory inputs from PV+ interneurons to rACC→Pn neurons (two-way ANOVA, Tukey post-hoc test, F(1,65) = 0.018, P = 0.89) from Ctrl (cyan) and Cond (red) mice. n = 7 for each group. v, Light-evoked individual IPSCs (grey), and average IPSC (cyan or red) from Ctrl (top) and Cond (bottom) mice. Blue bar indicates the time point of light stimulation and dashed line indicates the IPSC onset of the neuron from the Ctrl group. Inset: average IPSCs at expanded time scale. w, Boxplots of the amplitude (left; P = 0.02) and latency (right; onset to onset; P = 0.01) of light-evoked IPSCs from Ctrl (cyan) and Cond (red) mice. n = 8 cells in each group. Two-sided Wilcoxon rank-sum test was used in (c), (d), (i), (j), (f) and (w). In boxplots, horizontal lines represent median; boxes, quartiles; whiskers, most extreme data points ≤ interquartile range from box edges; and single points, data from individual cells. Data in (b, f, i, n, u) are mean ± SEM. Source Data
Extended Data Fig. 7
Extended Data Fig. 7. Photoexcitation of the rACC→Pn pathway enhances PAC-induced analgesia.
a, Strategy (top, left) and timeline (bottom, left) to optogenetically activate the rACC→Pn pathway during PAC. Illustration of bilateral implantation of cannula in the Pn (right). Dashed lines indicate cannula location. Scale bar, 500 μm. b, Timeline of the PAC assay, integrating optogenetics. c, Boxplots of the latency preceding first paw licking (two-sided Wilcoxon rank-sum test, P = 0.03; left), rearing (two-sided Wilcoxon rank-sum test, P = 0.24; middle), and jumping (two-sided Wilcoxon rank-sum test, P = 0.51; right). n = 10 in eYFP and 9 in ChR2 groups. d, Boxplot of the change in falling latency of mice during the rotarod test with and without photomanipulation of the rACC→Pn pathway (one-way ANOVA, Tukey post-hoc test, F(2,26) = 1.43, P = 0.25). n = 10 in eYFP, 10 in NpHR, and 9 in ChR2 groups. e, Quantification of the change in paw withdrawal frequency in response to 6 different von Frey filaments during optogenetic manipulation of the rACC→Pn pathway (two-way ANOVA, Tukey post-hoc test, F(2,156) = 55.18, P = 2 × 10−16). n = 10 in eYFP control, 10 in NpHR, and 9 in ChR2 groups. *P < 0.05 and ***P < 0.001. In boxplots, horizontal lines represent median; boxes, quartiles; whiskers, most extreme data points ≤ interquartile range from box edges; and single points, data from individual cells or mice. Data in (d) are mean ± SEM. Source Data
Extended Data Fig. 8
Extended Data Fig. 8. Oprd1+ Pn neurons mediate PAC-induced analgesia.
a, UMAP plot of Pn neuron clusters with data from two single-cell RNA-seq platforms. 10x: 10x Chromium 3′ v3; SS: SMART-seq v4. b, UMAPs illustrating single-cell expression patterns of neuronal genes. c, Euler diagram showing coexpression of excitatory neuron marker genes and Oprd1 in Pn neurons. d, Strategy to confirm the connection between rACC projection neurons and Oprd1+ Pn neurons using an AAV1-Cre virus that exhibits anterograde transsynaptic spread properties. e, Fluorescence in situ hybridization (FISH) experiments show that the eGFP+ neurons are also Oprd1+. Scale bar, 50 μm. f, Boxplot of the overlay ratio of eGFP and DAPI signals. g, Strategy to label neurons that have a monosynaptic connection with Oprd1+ neurons in the Pn in a retrograde manner using G-deleted mutant rabies virus (RVdG). h, Left top: Coronal section from the Pn of Oprd1Cre mice injected with AAV helpers (red) and RVdG (green). Arrows indicate examples of co-infected starter cells (yellow). Left bottom panels show a magnified view of the dashed box shown in the left top panel. Scale bars, 50 μm (left top) and 20 μm (left bottom). Right: Representative images of GFP-labelled neurons in the ACC. Cg1, cingulate area 1; Cg2, cingulate area 2. Scale bar, 50 μm. i, Strategy and experimental timeline to optogenetically manipulate the activity of Oprd1+ neurons in the Pn during the conditioning phase of PAC. j, Boxplot of the latency preceding first border crossing during the post-test after photoinhibition of eYFP control (green) versus NpHR (blue) mice during the conditioning phase (P = 0.04; n = 10 for each group). k, Boxplots of the latency preceding first paw licking (left; P = 0.06), rearing (middle), and jumping (right; P = 0.05) on the post-test day after photoinhibition of eYFP control (green) versus NpHR (blue) mice during the conditioning phase of PAC. n = 10 for each group. l, Strategy to express inhibitory opsin specifically in the Oprd1+ Pn neurons that receive rACC inputs using an AAV1 virus. m, Representative coronal section of the Pn showing Oprd1+ neurons that express the inhibitory opsin eNpHR. Scale bar: 100 µm. n, Boxplot of the latency for mice to cross back to chamber 1 for the first time (left), and the proportion of time mice spent in chamber 2 (right) with photoinhibition of eYFP control (green) versus NpHR (red) mice on the post-test day. n = 8 in eYFP and 6 in NpHR groups. o, Boxplots of the latency preceding first paw licking (left; P = 0.02), rearing (middle), and jumping (right) on the post-test day with photoinhibition of eYFP control (green) versus NpHR (blue) mice. n = 8 in eYFP and 6 in NpHR groups. p, Experimental timeline for the PAC assay (left) with both µ- and δ-opioid receptor antagonists injection during the post-test to examine which opioid receptor contributes to PAC-induced pain relief. q, Boxplots of the latency preceding first paw licking (left), rearing (middle), and jumping (right) on the post-test day for mice injected with saline, naltrindole (δ-opioid receptor antagonist), or β-funaltrexamine (µ-opioid receptor antagonist). Note that injection of either naltrindole or β-funaltrexamine abolished PAC-induced analgesia. n = 10 for each group. r, Boxplot of the pain threshold of Oprd1Cre mice with eYFP (cyan) or NpHR (brown) injection in the von Frey assay with or without light stimulation (F(1,30) = 7.988, P = 0.008; n = 8 in eYFP control and 9 in NpHR groups). s, Boxplot of the latency preceding paw withdrawal on a 48 °C plate (P = 0.003; left) or 52 °C plate (P = 0.04; right). n = 8 in eYFP control and 9 in NpHR groups. t, Photoinhibition of Oprd1+ Pn neurons does not significantly affect locomotion in the open-field test (F(1,28) = 0.356, P = 0.55; n = 8 in eYFP and 9 in NpHR groups). u, Photoinhibition of Oprd1+ Pn neurons does not affect the latency of mice to fall during the rotarod test (F(1,30) = 0.03, P = 0.984; n = 8 in eYFP and 9 in NpHR groups). Two-sided Wilcoxon rank-sum test was used in (j), (k), (o) and (s); two-way ANOVA with Tukey post-hoc test in (n), (r), (t), and (u). In boxplots, horizontal lines represent median; boxes, quartiles; whiskers, most extreme data points ≤ interquartile range from box edges; and single points, data from individual mice. Data in (t) are mean ± SEM. Source Data
Extended Data Fig. 9
Extended Data Fig. 9. Classification of Purkinje cell subpopulations during PAC.
a, Strategy to label Oprd1+ Pn neuron outputs. b, Cerebellar sections showing projections from Oprd1+ Pn neurons. Scale bars: 50 μm (top), 20 μm (bottom). c, Cerebellar sections showing projections in lobule VI, Crus I, and Crus II. Scale bars, 200 μm. d, Boxplot of the number of Purkinje cells detected in each mouse during the Pre (grey), Cond (green), and Post (blue) phases of PAC, and the number of cross-day-aligned neurons (red). n = 6 mice. e, Activity of cross-day-aligned Purkinje cells in cluster 1 (n = 58 neurons from 6 mice) and cluster 2 (n = 218 neurons from 6 mice) during the first border crossing, first crossing back, and the last border crossing on the post-test day. Neurons are ordered according to their cluster and mean Ca2+ activity during the first border crossing. f, Averaged activity of Purkinje cells within each cluster during first border crossing (red), first crossing back (green), and last border crossing (blue) on the post-test day at the level of individual neurons. g, Similar to (f), for individual mice. h, Averaged activity of Purkinje cells in cluster 2 during first border crossing at the level of individual neurons in the Pre (grey), Cond (green), and Post (blue) phases of PAC (F(2,651) = 10.28, P = 4 × 10−5; n = 218 neurons). i, Similar to (h), but at the level of individual mice (F(2,15) = 7.13, P = 0.006; n = 6 mice). j, Ca2+ spike frequency of cluster 1 Purkinje cells during first border crossing (F(2,171) = 13.43, P = 3.8 × 10−6). k, similar to (j), for cluster 2 Purkinje cells (two-sided Wilcoxon signed-rank test; n = 218 neurons). l, Cumulative histograms of Ca2+ spike amplitudes from cluster 1 Purkinje cells. Inset: Average amplitude of spikes >3 z-score (P = 0.0001, n = 75, 93, 178 in Pre, Cond, Post). m, similar to (l), but for cluster 2 Purkinje cells. n, Averaged waveforms of extracted Ca2+ spikes with amplitudes exceeding 3 z-scored ΔF/F for Purkinje cells in cluster 1 (left) and cluster 2 (right) during the Pre, Cond, and Post phases of PAC. Traces are aligned by the time point of their peak. o, Scatterplot of the latency preceding first border crossing against averaged signal of Purkinje cells in cluster 1 during day 3 (Pre), day 5, day 6 (Cond), and day 7 (Post) of PAC for each mouse. Data points were fit by linear regression. p, Similar to (o), for Purkinje cells in cluster 2. q, Purkinje cell activity during first border crossing (left), first crossing back (middle), and last border crossing (right) during the post-test. Neurons are ordered by mean activity during the first border crossing. r, s, Activity of Purkinje cells averaged for individual neurons (r) (F(2,2079) = 11.91, P = 1.3 × 10−6; n = 694) and individual mice (s) (F(2,15) = 13.1, P = 0.0004; n = 6). t, Control for Fig. 4l and (r) with randomized border crossing time. One-way ANOVA with Tukey post-hoc test was used in (f-m) and (r-t). In boxplots, horizontal lines represent median; boxes, quartiles; whiskers, most extreme data points ≤ interquartile range from box edges; and single points, data from individual cells or mice. Shaded area in (n) represents mean ± SEM.

References

    1. Harrington, A. The Cure Within: A History of Mind-Body Medicine (W. W. Norton & Company, 2008).
    1. Putnam, H. The Threefold Cord: Mind, Body, and World (Columbia Univ. Press, 1999).
    1. Bingel, U. et al. The effect of treatment expectation on drug efficacy: imaging the analgesic benefit of the opioid remifentanil. Sci. Transl. Med.3, 70ra14 (2011). - PubMed
    1. Colloca, L. & Benedetti, F. Placebo analgesia induced by social observational learning. Pain144, 28–34 (2009). - PubMed
    1. Fields, H. L. How expectations influence pain. Pain159, S3–S10 (2018). - PubMed

MeSH terms

Substances