. 2024 Jul 24;15(1):6256.
doi: 10.1038/s41467-024-50354-5.

NMNAT2 is a druggable target to drive neuronal NAD production

Affiliations

NMNAT2 is a druggable target to drive neuronal NAD production

James R Tribble et al. Nat Commun. .

Erratum in

  • Author Correction: NMNAT2 is a druggable target to drive neuronal NAD production.
    Tribble JR, Jöe M, Varricchio C, Otmani A, Canovai A, Habchi B, Daskalakis E, Chaleckis R, Loreto A, Gilley J, Wheelock CE, Jóhannesson G, Wong RCB, Coleman MP, Brancale A, Williams PA. Tribble JR, et al. Nat Commun. 2024 Sep 17;15(1):8143. doi: 10.1038/s41467-024-52439-7. Nat Commun. 2024. PMID: 39289370 Free PMC article. No abstract available.

Abstract

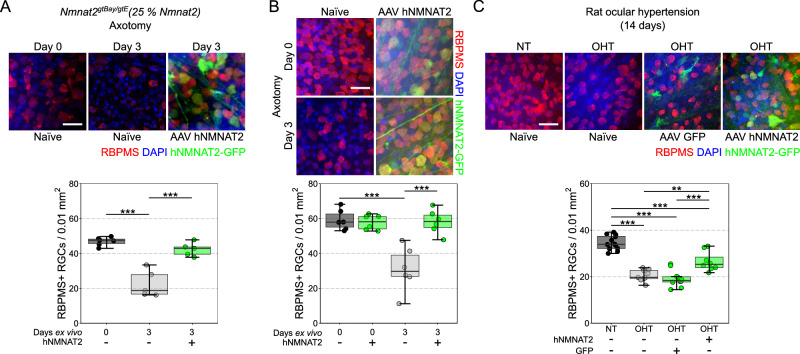
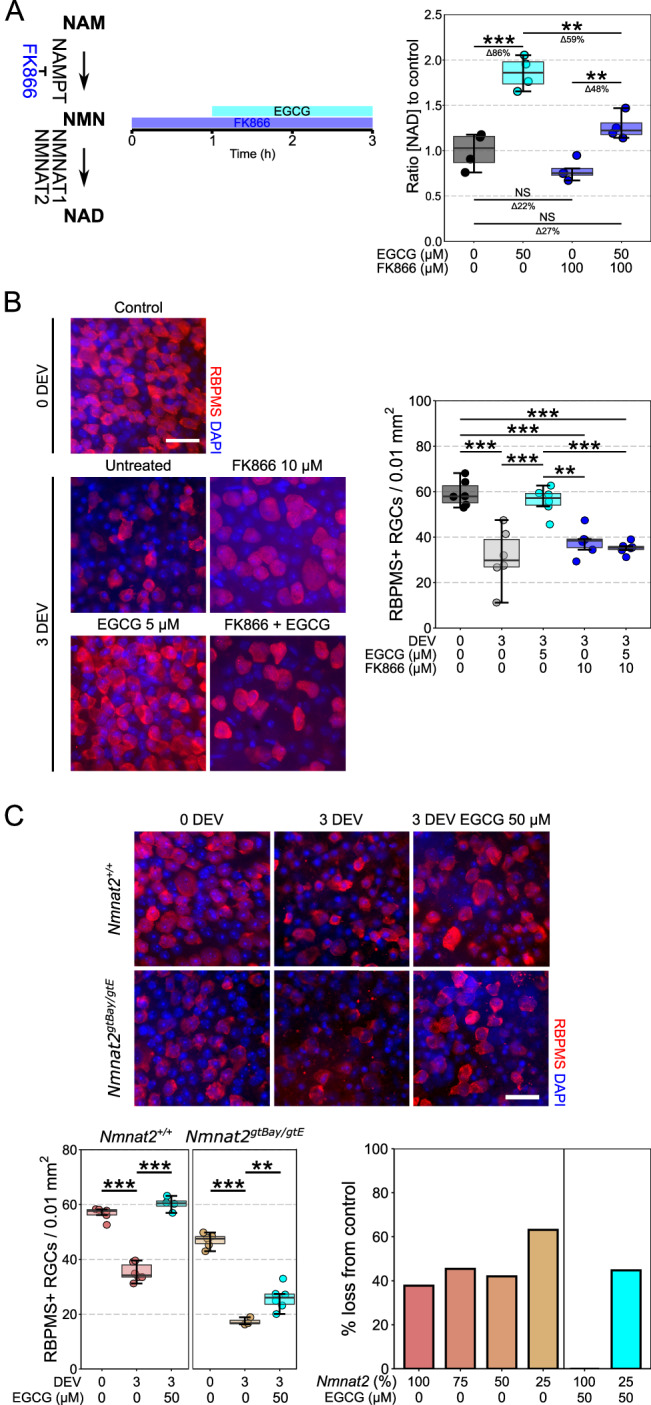
Maintenance of NAD pools is critical for neuronal survival. The capacity to maintain NAD pools declines in neurodegenerative disease. We identify that low NMNAT2, the critical neuronal NAD producing enzyme, drives retinal susceptibility to neurodegenerative insults. As proof of concept, gene therapy over-expressing full length human NMNAT2 is neuroprotective. To pharmacologically target NMNAT2, we identify that epigallocatechin gallate (EGCG) can drive NAD production in neurons through an NMNAT2 and NMN dependent mechanism. We confirm this by pharmacological and genetic inhibition of the NAD-salvage pathway. EGCG is neuroprotective in rodent (mixed sex) and human models of retinal neurodegeneration. As EGCG has poor drug-like qualities, we use it as a tool compound to generate novel small molecules which drive neuronal NAD production and provide neuroprotection. This class of NMNAT2 targeted small molecules could have an important therapeutic impact for neurodegenerative disease following further drug development.


Conflict of interest statement

PAW is an inventor on an awarded US patent held by The Jackson Laboratory for nicotinamide treatment in glaucoma (“Treatment and prevention of ocular neurodegenerative disorder”, US11389439B2). PAW, MJ, CV, and AB are inventors on a submitted patent held by Mim Neurosciences AB for novel NMNAT2-targeting small molecules. All other authors declare that they have no competing interests.

Figures

Fig. 1
Fig. 1. NMNAT2 expression is highly variable across the visual system tissues and within retinal ganglion cell populations, and declines following injury.
A Nmnat2 expression is highly variable between individual BXD mice (note logarithmic scales) across RGC relevant tissues (whole eye, n = 157; retina, n = 55; midbrain, n = 37 animals). It is important to note that these data are from different datasets and experiments and therefore should not be used for comparison across tissues, only within tissues. B In the retina, this variability is not related to the number of RGCs (Spearman’s rank correlation, shaded area = 95% CI) and the variance in Nmnat2 expression is significantly greater than for RGC markers Pou4f1, Rbpms, and Tubb3 (Pitman-Morgan test of variance for paired samples, two-sided). Both the founder strains (B6 and D2) are represented in these data and neither of these strains have the most upper or lower values (D2 = 10.69, B6 = 11.09, min for series = 10.23, max for series = 11.29 RMA gene level). C This variability in Nmnat2 increases with age (<200 days, n = 157 or >350 days, n = 187). D NMNAT2 expression in human retina is also highly variable between individuals (left, n = 50; right, n = 105). E Within the cell types of the retina, RGCs demonstrate the greatest average expression of NMNAT2 by single cell and single nucleus RNA-sequencing (red = highest expression, peach = lowest, dot plot scaled by % of expressing cells within types; AC amacrine cell, BP bipolar cell, HC horizontal cell, RPE retinal pigment epithelium) data from and. Even within these individual RGCs, NMNAT2 expression is highly variable (n = 74 RGCs for scSeq, n = 2039 RGCs for NucSeq). F In D2 mice (a chronic, age-related mouse model of glaucoma), Nmnat2 expression declines in whole ONH at a pre/early-degenerative time point (stage 3) and in retina declines in late disease (stage 4) relative to DBA/2J-GpnmbR150X (for ONH, Group 1 (n = 8), Group 2 (n = 8), Group 3 (n = 6), Group 4 (n = 4), Group 5 (n = 4) where expression is compared to n = 5 D2-Gpnmb + ; in the retina, Group 1 (n = 8), Group 2 (n = 9), Group 3 (n = 3), Group 4 (n = 10); expression is compared to n = 8 D2-Gpnmb +). In sorted RGCs from D2 retina, this decline in Nmnat2 is detectable at an early, pre-degenerative time point in RGCs with high RNA dysregulation (Group 1 (n = 9 age-matched D2-Gpnmb+ and n = 6 D2s), Group 2 (n = 6 D2s), Group 3 (n = 10 D2s), Group 4 (n = 4 D2s). Data in F from,, significance as FDR). G This is replicated under the isolated glaucomatous insults of ocular hypertension (whole optic nerves from rat inducible model following 7 days of high IOP (OHT), n = 6; and normotensive controls, n = 7) and following direct RGC injury through axotomy (whole retina in retinal explant model, 12 h culture ex vivo following axotomy, n = 5; or controls, n = 5; two-sided Student’s t-test). For AC: TPM transcripts per million, RMA robust multiarray analysis, QUANT quantile, RPKM reads per kilobase of exon per million. Data in AF were generated through screening publicly available datasets (see Methods). *P < 0.05, **P < 0.01, ***P < 0.001, NS = non-significant (P > 0.05). For box plots, the centre hinge represents the median with upper and lower hinges representing the first and third quartiles; whiskers represent 1.5 times the interquartile range.
Fig. 2
Fig. 2. Reduction of NMNAT2 increases retinal ganglion cell susceptibility to injury.
A Crossing mice heterozygous for Nmnat2 gene-trap alleles gtBay (predicted 50% silencing) or gtE (predicted 100% silencing) allowed Nmnat2 titration. In these mice, retinal Nmnat2 was depleted to (observed vs. expected based on allele penetrance) 80% (expected 75%; Nmnat2gtBay/+, n = 10), 39% (expected 50%; Nmnat2gtE/+, n = 12), or 10% (expected 25%; Nmnat2gtBay/gtE, n = 12) of normal levels relative to wild type controls (100%; Nmnat2+/+, n = 10). B RGC density was significantly lower in Nmnat2gtBay/gtE retina than in Nmnat2+/+ retina at 3 months without further change at 6 months (indicating a developmental loss). By 12 months of age, Nmnat2gtBay/gtE mice had significantly fewer RGCs than at 3 and 6 months, and this is stable to 22 months (indicating an additional early age-related decline). For Nmnat2+/+: 3 months, n = 6; 6 months, n = 8; 12 months, n = 8; 22 months, n = 8; for Nmnat2gtBay/gtE: 3 months, n = 6; 6 months, n = 8; 12 months, n = 8; 22 months, n = 6. Scale bar = 20 µm. C RGC density was significantly reduced in all Nmnat2 gene-trap allele mouse strains at 3 days ex vivo following RGC axotomy (RBPMS = specific marker of RGCs in the retina) relative to naïve controls (0 days ex vivo), and this was greatest in Nmnat2gtBay/gtE mice supporting a threshold of Nmnat2 loss beyond which RGC susceptibility to injury is increased (Day 0: Nmnat2+/+, n = 6; Nmnat2+/gtBay, n = 6; Nmnat2+/gtE, n = 6; Nmnat2gtBay/gtE, n = 6; Day 3: Nmnat2+/+, n = 8; Nmnat2+/gtBay, n = 6; Nmnat2+/gtE, n = 7; Nmnat2gtBay/gtE, n = 5; scale bar = 20 µm). For B and C, *P < 0.05, **P < 0.01, ***P < 0.001, NS = non-significant (P > 0.05); One-way ANOVA with Tukey’s HSD. For box plots, the centre hinge represents the median with upper and lower hinges representing the first and third quartiles; whiskers represent 1.5 times the interquartile range.
Fig. 3
Fig. 3. Gene therapy delivery of human NMNAT2 is strongly neuroprotective to retinal ganglion cells.
A Overexpression of hNMNAT2 robustly protects against RGC loss in Nmnat2gtBay/gtE (25%) retinas maintained for 3 days ex vivo following axotomy, rescuing the RGC sensitization phenotype of these mice (Day 0: Nmnat2gtBay/gtE, n = 6; Day 3: Nmnat2gtBay/gtE, n = 6; Nmnat2gtBay/gtE + hNMNAT2, n = 5; scale bar = 20 µm). B Overexpression of hNMNAT2 in C57BL/6J mice confers complete protection against RGC loss at 3 days ex vivo (n = 6 retinas for all conditions). C In the rat ocular hypertension (OHT) model, which recapitulates many features of human glaucoma, significant RGC loss occurs following 14 days of elevated intraocular pressure (OHT) relative to controls (NT, normotensive). Transfection (3 weeks prior to OHT onset) and expression of GFP alone (AAV GFP) does not significantly alter RGC survival, but RGC survival is significantly enhanced with hNMNAT2 expression. This demonstrates that in a complex disease (with many neurodegenerative mechanisms) NMNAT2 gene therapy provides moderate neuroprotection to RGCs (NT n = 12 eyes, OHT n = 9 eyes, OHT AAV GFP n = 10 eyes, OHT hNMNAT2 n = 8 eyes). Scale bars = 25 µm in all images. For A, B and C, *P < 0.05, **P < 0.01, ***P < 0.001, NS non-significant (P > 0.05); One-way ANOVA with Tukey’s HSD. For box plots, the centre hinge represents the median with upper and lower hinges representing the first and third quartiles; whiskers represent 1.5 times the interquartile range.
Fig. 4
Fig. 4. EGCG increases NAD and provides a robust neuroprotection following retinal ganglion cell injury.
A EGCG increases NAD in a dose-dependent manner in dissociated cortical neurons, with 50 nM the lowest dose to give a significant increase in NAD compared to untreated controls (each condition assessed in a sample from the same biological replicate; n = 4). B EGCG increases NAD in a time dependent manner in dissociated cortical neurons. EGCG was first added to the 6-h samples (and maintained throughout), 2 h later EGCG was added to the 4-h sample, etc. The 0-time sample was incubated for 6 h in media without EGCG. An increased cell viability in the samples treated with EGCG at an earlier time point may also contribute to the 5-fold increase in NAD (each condition assessed in a sample from the same biological replicate; n = 4). C EGCG significantly increased NAD in neuron-enriched tissue (cortex; n = 4 per condition) but not in neuron-low tissues (spleen, muscle, and liver; n = 4 per condition) suggesting a specificity towards Nmnat2 over Nmnat1. D EGCG dissolved in the culture media robustly protects against RGC death at 3 days ex vivo (3 DEV) following axotomy in comparison to untreated controls (n = 6, all conditions) (interventional treatment). E In the rat OHT model, prophylactic oral EGCG provided a modest neuroprotection relative to untreated controls at 40 mg/kg/d (n = 12), but not at 20 mg/kg/d (n = 7), although this was improved in combination with hNMNAT2 (n = 11). F In postmortem retinal punches (n = 10 donor retinas) maintained ex vivo for 7 days (7 DEV) significant RGC loss occurs which is significantly reduced by EGCG (or nicotinamide, NAM, the precursor for NAD through the NAD-salvage pathway) relative to uncultured controls (0 DEV), supporting the human utility of neuroprotection by EGCG (each condition assessed in a sample from the same biological replicate, n = 10). The prolonged postmortem time (24–48 h) results in significant RGC loss, and so in this context EGCG is able to provide interventional neuroprotection to an already degenerating system. Scale bars = 25 µm in D, E and 50 µm in F. *P < 0.05, **P < 0.01, ***P < 0.001, NS non-significant (P > 0.05); Student’s t-test to control for A, B, and C; One-way ANOVA with Tukey’s HSD for D, E, and F. For box plots, the centre hinge represents the median with upper and lower hinges representing the first and third quartiles; whiskers represent 1.5 times the interquartile range.
Fig. 5
Fig. 5. EGCG improves neuronal resilience to rotenone injury.
A Primary retinal neuron cultures were established from P2-3 C57BL/6J mouse pups and grown for 10 days. At day 11, neurons were stressed with rotenone (1 µM) or remained vehicle treated controls (DMSO) in the presence of EGCG (5 µM) or controls (n = 6 wells per condition) for 1 day. Rotenone caused a significant decrease in neuron density and total neurite length which was prevented by EGCG treatment. B Mice were either treated with EGCG (or untreated) for 1 week prior to receiving an intravitreal injection of 10 mM rotenone or DMSO only (vehicle). RBPMS density was assessed 1 day after intravitreal injection. Rotenone injection resulted in a significant loss of RGCs in untreated mice ( ~40%) which was significantly mitigated by EGCG treatment ( ~20% loss). DMSO only n = 6 retinas, Rotenone only n = 8 retinas, DMSO EGCG n = 9 retinas, Rotenone EGCG n = 8 retinas. Scale bar = 25 µm for B. For A and B, *P < 0.05, **P < 0.01, ***P < 0.001, NS = non-significant (P > 0.05); One-way ANOVA with Tukey’s HSD. For box plots, the centre hinge represents the median with upper and lower hinges representing the first and third quartiles; whiskers represent 1.5 times the interquartile range.
Fig. 6
Fig. 6. EGCG increases NAD and provides neuroprotection through an NMN and NMNAT2-dependent mechanism.
A Addition of FK866 (an NAMPT inhibitor which reduces the levels of NMN available to NMNAT2) significantly decreases the capacity of EGCG to produce additional NAD (n = 4 cortex for all conditions). B In the retinal axotomy model addition of FK866 does not significantly alter RGC survival compared to untreated controls. However, the neuroprotective effect of EGCG was completely abolished in the presence of FK866, suggesting that in the context of a RGC injury, EGCG’s neuroprotective effect is derived through an NMN-dependent mechanism (n = 6, all conditions). C Supporting this, in Nmnat2+/+ mice (100% Nmnat2) EGCG provides complete neuroprotection at 3 DEV (n = 4), but in Nmnat2gtBay/gtE mice (25% Nmnat2, n = 6), the neuroprotective effects of EGCG are significantly diminished (44% RGC loss, which is comparable to untreated Nmnat2+/+, Nmnat2+/gtBay, and Nmnat2+/gtE mice). This suggests that the neuroprotective effects of EGCG work through an NMNAT2-dependent mechanism. Scale bars = 25 µm in B and C. For A, B, and C, *P < 0.05, **P < 0.01, ***P < 0.001, NS = non-significant (P > 0.05); One-way ANOVA with Tukey’s HSD. For box plots, the centre hinge represents the median with upper and lower hinges representing the first and third quartiles; whiskers represent 1.5 times the interquartile range.
Fig. 7
Fig. 7. EGCG provides a basis for generating novel NAD-producing compounds.
A An NMNAT2 homology model using NMNAT1 and NMNAT3 was further refined using loop-modelling software (DaReUS-Loop) to refine a low homology domain in the central region of the protein (green). Molecular dynamic simulations demonstrated that the protein reached a stable conformation after 100 ns. The final generated protein conformations demonstrated greater reliability (ERRAT, VERIFY 3D, PROVE, and Z-score). B Three potential druggable binding pockets (independent of the NMN catalytic pocket) were identified. The docking pose of EGCG was well accommodated in these three different druggable pockets with corresponding ΔG scores < −40 kcal/mol (left). Only one ligand-protein complex (Site 1; orange) could maintain a stable conformation over a 500 ns molecular dynamic simulation (right), demonstrating in silico evidence that EGCG can directly bind to NMNAT2. C Given its poor drug-like properties, EGCG was used as a tool compound to identify novel NAD-producing compounds. The EGCG structure was truncated in series to identify a biologically active core which was then used in a scaffold-hopping strategy. D An iterative synthesis and NAD-testing (luminometry of dissociated cortex neurons) pipeline was established to identify and test NAD-producing compounds. A number of compounds with greater efficacy than EGCG at producing NAD were identified (n = 4/condition; statistical testing in Supplementary Data 1). Outliers denoted by black circles. *P < 0.05, **P < 0.01, ***P < 0.001, NS non-significant (P > 0.05). For box plots, the centre hinge represents the median with upper and lower hinges representing the first and third quartiles; whiskers represent 1.5 times the interquartile range.
Fig. 8
Fig. 8. Generation of NAD-salvage pathway specific compounds that drive NAD production and provide neuroprotection.
A We selected 10 compounds for further testing based on their NAD-producing capacity (structures shown in comparison to EGCG). B For 9 of the 10 top compounds, FK866 suppressed the NAD-boosting effect, demonstrating that these drugs retained a mechanism of action through the NAD-salvage pathway (n = 4 cortex for all conditions; fold change in NAD comparable to normal controls, denoted by red space; fold change comparable to FK866 treated normal controls, denoted by black space; statistical testing in Supplementary Data 2). C Compounds were tested for NAD modifying capacity in dissociated cortex, liver, muscle, and spleen (n = 4 for all conditions). An NAD-boosting effect in neuron-low tissue was only demonstrated for 2 compounds (51, 56) with both increasing NAD in muscle by <1.2 fold relative to untreated controls. A reduction in NAD relative to control was identified for 3 compounds in neuron-low tissue, with compound 21 and 55 reducing NAD in spleen to ~0.8 fold, and compound 54 reducing NAD in muscle to ~0.9 fold. Results are normalized to untreated controls of matched tissue type. D The compounds were used to generate a structure-activity relationship model which identified favourable (green, at C2) and unfavourable (purple) hydrophobic regions which affect the activity, and negative electrostatics regions (blue, at C1) which are crucial for NAD-boosting activity. E Five of the top ten compounds were tested for neuroprotective capacity in a retinal explant model. Compounds 54 and 55 (from group 5) demonstrated a significant protection of RGCs, demonstrating the potential of these compounds to provide neuroprotection (n = 6 retina/condition). Scale bar = 20 µm. For B, C, and E, *P < 0.05, **P < 0.01, ***P < 0.001, NS non-significant (P > 0.05), Student’s t-test to control. For box plots, the centre hinge represents the median with upper and lower hinges representing the first and third quartiles; whiskers represent 1.5 times the interquartile range.

References

    1. Verdin, E. NAD+ in aging, metabolism, and neurodegeneration. Science350, 1208–1213 (2015). - PubMed
    1. Tham, Y. C. et al. Global prevalence of glaucoma and projections of glaucoma burden through 2040: a systematic review and meta-analysis. Ophthalmology121, 2081–2090 (2014). - PubMed
    1. Williams, P. A. et al. Vitamin B-3 modulates mitochondrial vulnerability and prevents glaucoma in aged mice. Science355, 756–760 (2017). - PMC - PubMed
    1. Harder, J. M. et al. Disturbed glucose and pyruvate metabolism in glaucoma with neuroprotection by pyruvate or rapamycin. Proc. Natl Acad. Sci. USA117, 33619–33627 (2020). - PMC - PubMed
    1. Tribble, J. R. et al. Midget retinal ganglion cell dendritic and mitochondrial degeneration is an early feature of human glaucoma. Brain Commun.1, fcz035 (2019). - PMC - PubMed

MeSH terms

LinkOut - more resources