Randomized Controlled Trial
. 2024 Jul 24;14(1):305.
doi: 10.1038/s41398-024-03030-7.

Examining immune-inflammatory mechanisms of probiotic supplementation in depression: secondary findings from a randomized clinical trial

Affiliations
Randomized Controlled Trial

Examining immune-inflammatory mechanisms of probiotic supplementation in depression: secondary findings from a randomized clinical trial

Lukas Sempach et al. Transl Psychiatry. .

Abstract

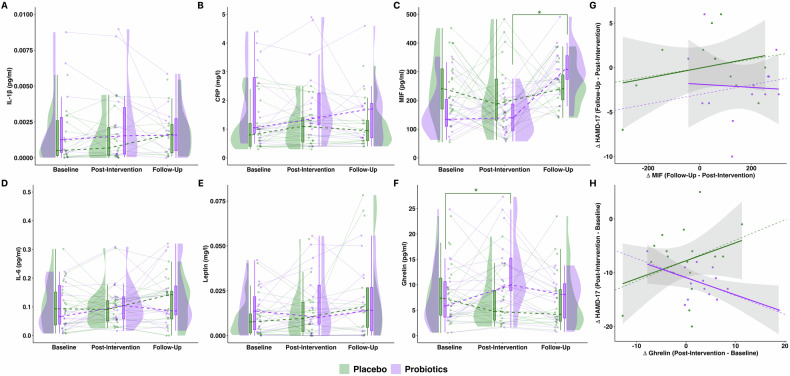
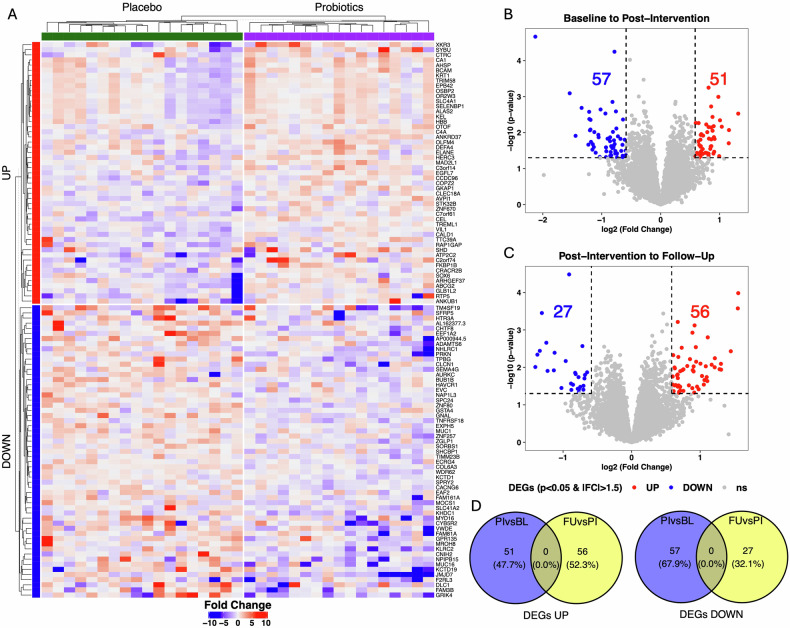
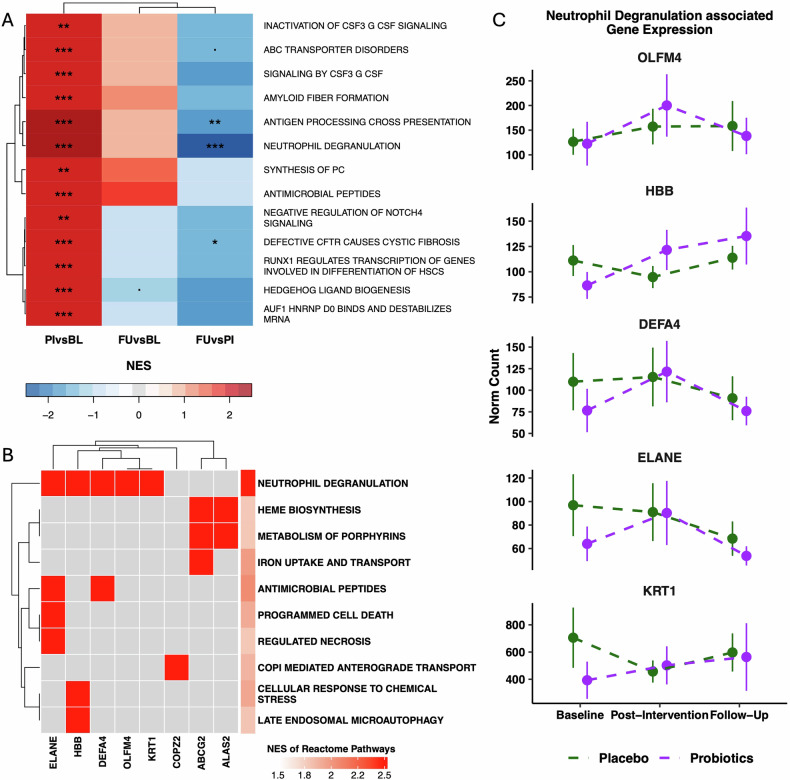
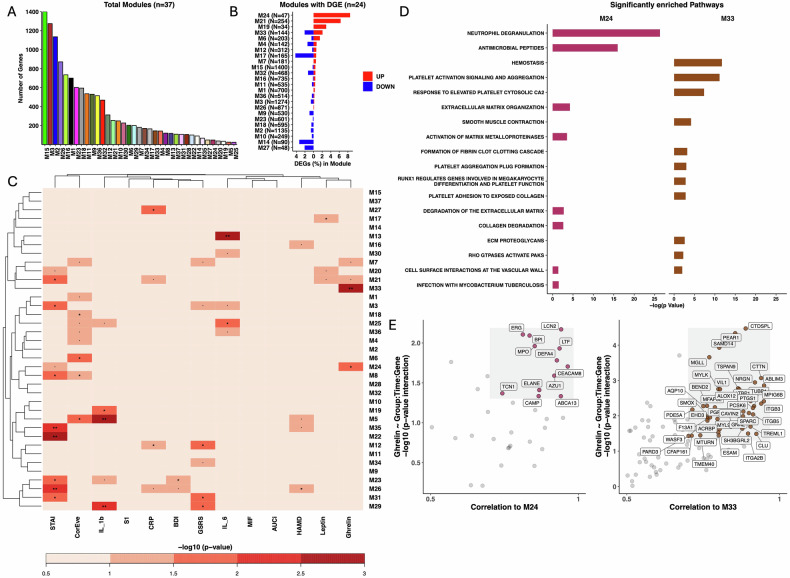
We recently indicated that four-week probiotic supplementation significantly reduced depression along with microbial and neural changes in people with depression. Here we further elucidated the biological modes of action underlying the beneficial clinical effects of probiotics by focusing on immune-inflammatory processes. The analysis included a total of N = 43 participants with depression, from which N = 19 received the probiotic supplement and N = 24 received a placebo over four weeks, in addition to treatment as usual. Blood and saliva were collected at baseline, at post-intervention (week 4) and follow-up (week 8) to assess immune-inflammatory markers (IL-1β, IL-6, CRP, MIF), gut-related hormones (ghrelin, leptin), and a stress marker (cortisol). Furthermore, transcriptomic analyses were conducted to identify differentially expressed genes. Finally, we analyzed the associations between probiotic-induced clinical and immune-inflammatory changes. We observed a significant group x time interaction for the gut hormone ghrelin, indicative of an increase in the probiotics group. Additionally, the increase in ghrelin was correlated with the decrease in depressive symptoms in the probiotics group. Transcriptomic analyses identified 51 up- and 57 down-regulated genes, which were involved in functional pathways related to enhanced immune activity. We identified a probiotic-dependent upregulation of the genes ELANE, DEFA4 and OLFM4 associated to immune activation and ghrelin concentration. These results underscore the potential of probiotic supplementation to produce biological meaningful changes in immune activation in patients with depression. Further large-scale mechanistic trials are warranted to validate and extend our understanding of immune-inflammatory measures as potential biomarkers for stratification and treatment response in depression. Trial Registration: www.clinicaltrials.gov , identifier: NCT02957591.


Conflict of interest statement

The authors declare no competing interests.

Figures

Fig. 1
Fig. 1. Blood concentration levels of IL-1β, CRP, MIF, IL-6, Leptin, Ghrelin in the probiotics and placebo groups from baseline to post-intervention (week 4) and follow-up assessment (week 8), and the association between changes in Ghrelin and MIF concentrations to changes in HAMD-17 scores.
Concentration levels in AF are presented as boxplots of Median [IQR], association in G and H are presented as Pearson’s correlation (solid line) and partial correlation (dotted line) controlled for (age, sex, BMI). In AF significant group × time interactions are depicted (*p ≤ 0.05). A Trajectory of IL-1β blood concentration levels throughout the study. B Trajectory of CRP concentration levels throughout the study. C Trajectory of MIF concentration levels throughout the study, indicative of a significant increase from post-intervention to follow-up in the probiotics group. D Trajectory of IL-6 concentration levels throughout the study. E Trajectory of leptin concentration levels throughout the study. F Trajectory of ghrelin concentration levels throughout the study, indicative of a significant increase from baseline to post-intervention in the probiotics group. G Association between changes in MIF concentration levels and HAMD-17 scores from post-intervention to follow-up for both study group. Placebo group (Pearson’s correlation: r = 0.27, p = 0.4; partial correlation: r = 0.23, p = 0.55). Probiotics group (Pearson’s correlation: r = −0.06, p = 0.86; partial correlation: r = 0.17, p = 0.64). H Association between changes in ghrelin concentration levels and HAMD-17 scores from baseline to post-intervention for both study group. Placebo group (Pearson’s correlation: r = 0.3, p = 0.22; partial correlation: r = 0.35, p = 0.20). Probiotics group (correlation: r = −0.58, p = 0.03; partial correlation: r = −0.63, p = 0.04).
Fig. 2
Fig. 2. Gene expression changes from baseline to post-intervention (week 4) and follow-up assessment (week 8) in the probiotics compared to placebo groups.
Differentially expressed genes (DEGs) were defined as |fold-change| > 1.5 and p value < 0.05. A Heatmap of differential gene expression (DGE) from baseline to post-intervention assessment in the probiotics compared to placebo groups. Genes and participants are clustered based on Euclidean distance using complete linkage method. Participants are additionally split according to their treatment groups. Genes are additionally split according to their increasing (UP) or decreasing (DOWN) expression. B DEGs in the probiotics compared to placebo group between the timepoints baseline to post-intervention. C DEGs in the probiotics compared to placebo group between the timepoints post-intervention to follow-up. D Overlap of UP and DOWN DEGs in the probiotics compared to placebo groups between the study periods baseline to post-intervention (PIvsBL) and post-intervention to follow-up (FUvsPI).
Fig. 3
Fig. 3. Gene set enrichment analysis of DGE associated with probiotics compared to the placebo groups.
A Comparison of enrichment profiles of REACTOME pathways between the baseline (BL), post-intervention (week 4; PI), and follow-up (week 8; FU) assessment. Significantly upregulated pathways between PI and BL, in probiotics compared to placebo groups were filtered for display (adjusted p ≤ 0.01 and |NES| > 2). Color of cells indicates the NES. Corresponding BH-adjusted p values are also indicated (*p ≤ 0.05, **p ≤ 0.01, ***p ≤ 0.001). B Core enriched DEGs for GSEA enriched REACTOME pathways at post-intervention vs baseline. C Trajectories of norm count of core enriched DEGs throughout the study period associated to the pathway neutrophil degranulation. Norm counts are present as M (SE), axes have been edited according to respective norm count for clearer interpretation.
Fig. 4
Fig. 4. Association between biological/clinical measures and probiotics-induced DEGs from baseline to post-intervention assessment (week 4).
A Effect of group x time x gene expression interaction on the biological/clinical measures assessed by LMM. The color scale represents -log scaled ANOVA p-values. Significant interactions are depicted (*p ≤ 0.05, **p ≤ 0.01, ***p ≤ 0.001). B Association between the change of ghrelin and significantly associated genes (*p ≤ 0.05) from baseline to post-intervention for both study group. Only DEGs with a significant association to ghrelin are presented. Associations were assessed as Pearson’s correlation (solid line) and partial correlation (dotted line) controlled for (age, sex, BMI). ELANE: Placebo group (correlation: r = −0.42, p = 0.1; partial correlation: r = −0.69, p = 0.01). Probiotics group (correlation: r = 0.32, p = 0.28; partial correlation: r = 0.7, p = 0.02). TREML1: Placebo group (correlation: r = 0.08, p = 0.75; partial correlation: r = 0.061, p = 0.83). Probiotics group (correlation: r = −0.51, p = 0.07; partial correlation: r = −0.6, p = 0.07).
Fig. 5
Fig. 5. Co-expressed gene modules identification and their association to the probiotics intervention and changes in biological/clinical measures.
A Identification of co-expressed gene modules based on a weighted gene co-expression network analysis. Colors are randomly assigned to facilitate module identification. B Percentage of probiotics-induced DEGs in modules. N next to module indicates absolute number of DEGs in modules. C Effect of group × time × ME (“module eigengene”) interaction on the biological/clinical measures assessed by LMM. The color scale represents −log scaled ANOVA p-values. Significant interactions are depicted (*p ≤ 0.05, **p ≤ 0.01, ***p ≤ 0.001). D Significantly enriched REACTOME pathways in modules associated to ghrelin. BH-adjusted p values for the enrichment test (*p ≤ 0.05). E Identification of genes with a high Module Membership (correlation to ME) and association to ghrelin (LMM assessed significant group × time × gene expression) in M24 and M33.

References

    1. Rotenstein LS, Ramos MA, Torre M, Bradley Segal J, Peluso MJ, Guille C, et al. Prevalence of depression, depressive symptoms, and suicidal ideation among medical students: a systematic review and meta-analysis. JAMA. 2016;316:2214. 10.1001/jama.2016.17324 - DOI - PMC - PubMed
    1. Abbafati C, Abbas KM, Abbasi M, Abbasifard M, Abbasi-Kangevari M, Abbastabar H, et al. Global burden of 369 diseases and injuries in 204 countries and territories, 1990–2019: a systematic analysis for the Global Burden of Disease Study 2019. The Lancet. 2020;396:1204–22.10.1016/S0140-6736(20)30925-9 - DOI - PMC - PubMed
    1. Rush AJ, Trivedi MH, Wisniewski SR, Nierenberg AA, Stewart JW, Warden D, et al. Acute and longer-term outcomes in depressed outpatients requiring one or several treatment steps: a STAR*D Report. Am J Psychiatry. 2006;163:1905–17. 10.1176/ajp.2006.163.11.1905 - DOI - PubMed
    1. Zhang Q, Chen B, Zhang J, Dong J, Ma J, Zhang Y, et al. Effect of prebiotics, probiotics, synbiotics on depression: results from a meta-analysis. BMC Psychiatry. 2023;23. 10.1186/S12888-023-04963-X. - PMC - PubMed
    1. Chahwan B, Kwan S, Isik A, van Hemert S, Burke C, Roberts L. Gut feelings: a randomised, triple-blind, placebo-controlled trial of probiotics for depressive symptoms. J Affect Disord. 2019;253:317–26. 10.1016/j.jad.2019.04.097 - DOI - PubMed

Publication types

Associated data