. 2024 Jul 24;15(1):6191.
doi: 10.1038/s41467-024-50095-5.

Therapeutic strategy for spinal muscular atrophy by combining gene supplementation and genome editing

Affiliations

Therapeutic strategy for spinal muscular atrophy by combining gene supplementation and genome editing

Fumiyuki Hatanaka et al. Nat Commun. .

Abstract

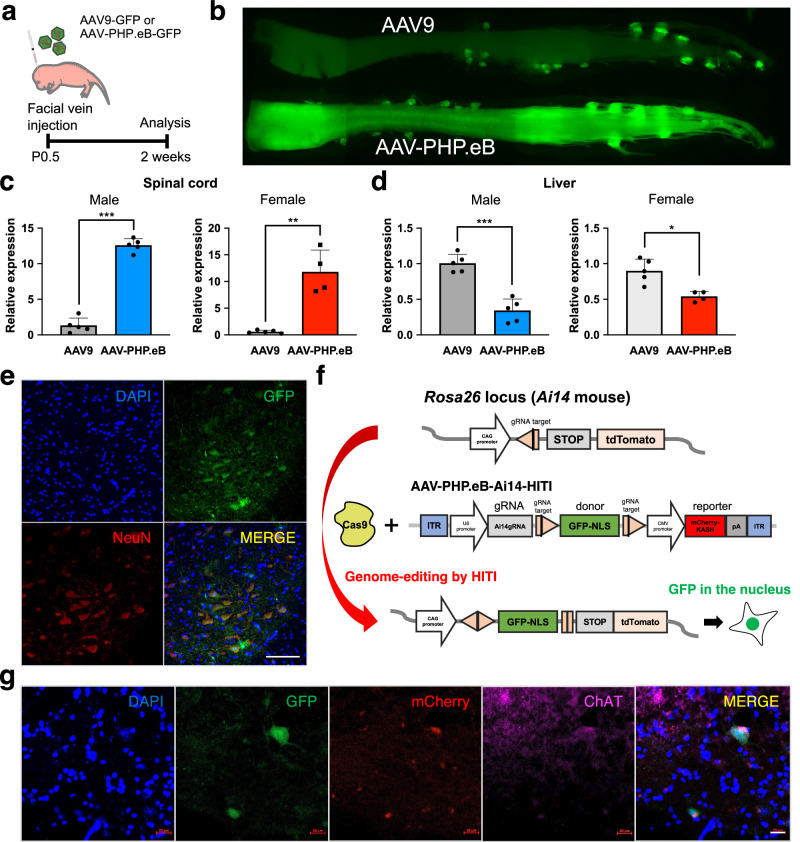
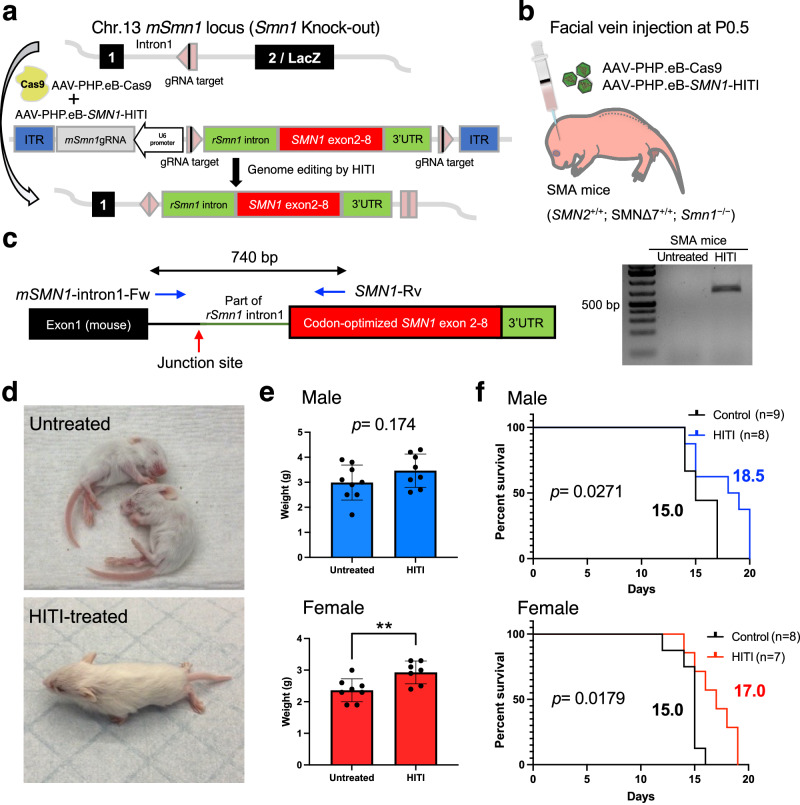
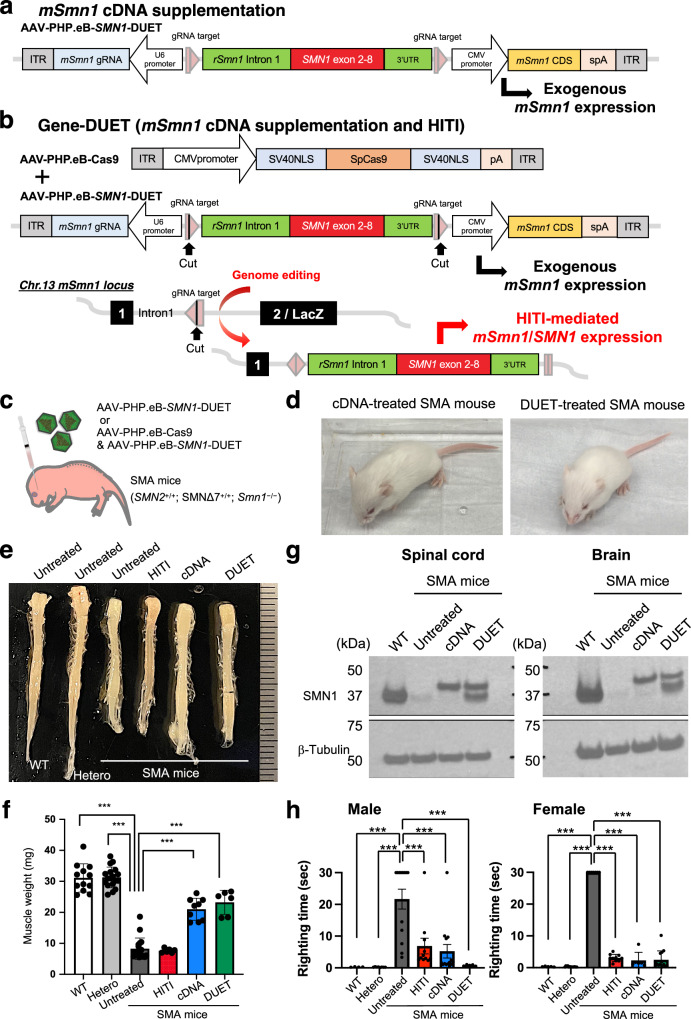
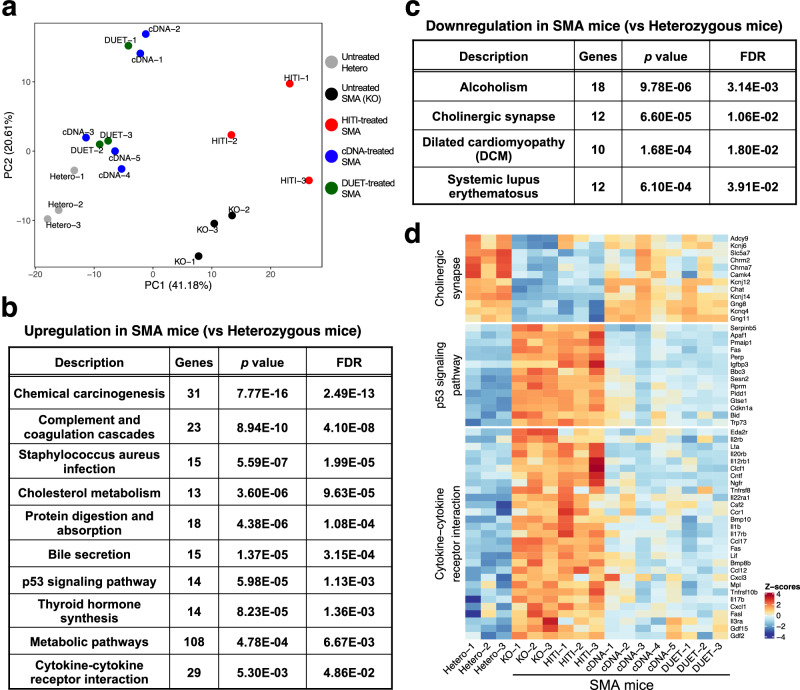
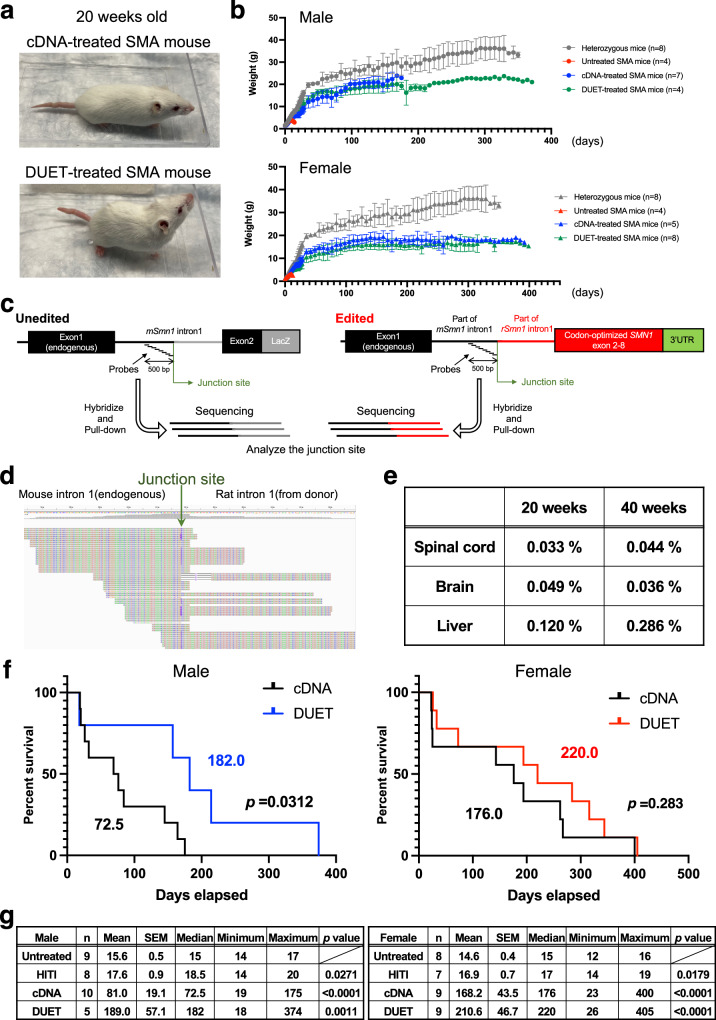
Defect in the SMN1 gene causes spinal muscular atrophy (SMA), which shows loss of motor neurons, muscle weakness and atrophy. While current treatment strategies, including small molecules or viral vectors, have shown promise in improving motor function and survival, achieving a definitive and long-term correction of SMA's endogenous mutations and phenotypes remains highly challenging. We have previously developed a CRISPR-Cas9 based homology-independent targeted integration (HITI) strategy, enabling unidirectional DNA knock-in in both dividing and non-dividing cells in vivo. In this study, we demonstrated its utility by correcting an SMA mutation in mice. When combined with Smn1 cDNA supplementation, it exhibited long-term therapeutic benefits in SMA mice. Our observations may provide new avenues for the long-term and efficient treatment of inherited diseases.


Conflict of interest statement

F.H., Y.T., C.R.E and J.C.I.B. are employees of Altos labs. The other authors declare no competing interests.

Figures

Fig. 1
Fig. 1. AAV-mediated in vivo genome editing in spinal cord.
a AAV-GFP reporter (1 × 1011GC) was administered via facial vein injection at P0.5 in WT mice. b GFP expression in the spinal cord of AAV9-GFP and AAV-PHP.eB-GFP injected mice. c, d RT-qPCR analysis for the expression of Gfp in the spinal cords (c) and livers (d) in AAV9-GFP and AAV-PHP.eB-GFP injected mice 3 weeks after the injections. Male mice (AAV9-GFP, n = 5; AAV-PHP.eB-GFP, n = 5) are shown on the left and female mice (AAV9-GFP, n = 5; AAV-PHP.eB-GFP, n = 4) are shown on the right. Data are represented as mean ± S.D. ***p < 0.0001, **p = 0.0004, *p = 0.0051, a two-sided unpaired Student’s t test. e Representative fluorescent imaging of the spinal cord section in AAV-PHP.eB-GFP injected mouse. Scale bar, 1 mm. f Schematic of AAV construct for knock-in GFP-NLS downstream of the CAG promoter in the Rosa26 locus of Ai14 mouse. Pink pentagon, Cas9/gRNA target sequence. Black line within the pink pentagon, Cas9 cleavage site. g Representative immunofluorescence images of GFP in the AAV-injected spinal cord section. The GFP signal in the nuclei was merged with mCherry and ChAT. Scale bar, 20 μm. Source data are provided as a Source Data file.
Fig. 2
Fig. 2. HITI-mediated gene correction of SMA mice.
a Schematic of gene correction in SMA mice (SMN2+/+; SMNΔ7+/+; Smn1−/−). gRNA is expressed under the U6 promoter. Rat Smn1 intron, optimized mouse exon 2–8 and rat 3’UTR is sandwiched by Cas9/gRNA target sequence. The Cas9/gRNA creates a DSB at target sites and releases the donor. The donor sequence is integrated into the target site by NHEJ-based repair. Pink pentagon, Cas9/gRNA target sequence. Black line within the pink pentagon, Cas9 cleavage site. b AAVs (1 × 1011GC of each AAV) were systemically delivered via the facial vein in neonatal SMA mice. Body weight and life span were recorded after the injection. c The region between mouse intron1 and inserted rat intron1-optimized exon can be detected only in HITI-treated SMA sample by PCR. Blue arrows denote the location of the primers. Red arrow denotes the location of the junction site. d Gross morphology of untreated SMA mice (upper) and HITI-treated SMA mouse (lower) at 2 weeks old. e Body weight comparison between untreated and HITI-treated SMA mice of 12 days old with the males depicted on the top (Untreated, n = 9; HITI-treated, n = 8), and the females depicted on the bottom (Untreated, n = 8; HITI-treated, n = 7). Data are represented as mean ± S.D. **p = 0.0096, a two-sided unpaired Student’s t test. f Survival rate comparison between untreated and HITI-treated SMA mice with the males depicted on the top, and the females depicted on the bottom. n is the number of animals per group. Log-rank (Mantel–Cox) test was used for survival curves. The p value and median survival are indicated for all curves. Source data are provided as a Source Data file.
Fig. 3
Fig. 3. Gene-DUET strategy for SMA mice.
a, b Schematic representation of AAV-SMN1-DUET. Mouse Smn1 (mSmn1) is expressed under CMV promoter. gRNA is expressed under the U6 promoter. Rat Smn1 intron, optimized mouse exon 2–8 and rat 3’UTR is sandwiched by Cas9/gRNA target sequence. Pink pentagon, Cas9/gRNA target sequence. Black line within the pink pentagon, Cas9 cleavage site. Only mSmn1 is expressed without Cas9 (a) and both mSmn1 and gene-corrected mSmn1/SMN1 are expressed in the presence of Cas9 (b). c AAVs (1 × 1011GC of AAV-SMN1-DUET or 2 × 1011GC in total at an equal dose of AAV-SMN1-DUET and AAV-SpCas9) were systemically delivered via the facial vein in neonatal SMA mice. d Gross morphology of cDNA-treated SMA mouse (left) and DUET-treated SMA mouse (right) at 2 weeks old. e Gross morphology of the spinal cord in male WT, heterozygous, SMA mice with no treatment or each treatment at 2 weeks old. Scale bar, 1 mm. f Weight of the quadriceps femoris muscle in WT mice (n = 12), heterozygous mice (n = 18) and SMA mice with no treatment (n = 18) or HITI (n = 6), cDNA (n = 9) and DUET (n = 6) treatments. Both cDNA and DUET treatments improved muscle atrophy in SMA mice. Data are represented as mean ± S.D. ***p < 0.0001, a two-sided unpaired Student’s t test (vs untreated SMA mice). g Western blot analyses were conducted to assess SMN1 expression. The upper band represents exogenous mSMN1 expression, and the lower band represents endogenous or HITI-mediated SMN1 expression in the spinal cords (left) and brains (right) of 2 weeks old WT and SMA mice with no treatment or subjected to cDNA and DUET treatments. WT mice were utilized as a reference for endogenous mouse SMN1 expression. β-Tubulin served as a loading control. h On the left, the righting ability of male WT mice (n = 4), heterozygous mice (n = 8), and SMA mice with no treatment (n = 13) or HITI (n = 11), cDNA (n = 14), and DUET (n = 5) treatments is depicted. On the right, the righting ability of female WT mice (n = 5), heterozygous mice (n = 13), and SMA mice with no treatment (n = 7) or HITI (n = 10), cDNA (n = 6), and DUET (n = 14) treatments is shown. Data are represented as mean ± S.E.M. ***p < 0.005, a two-sided unpaired Student’s t test. Source data are provided as a Source Data file.
Fig. 4
Fig. 4. Molecular correction via cDNA and DUET treatments in SMA mice.
a PCA analysis of RNA-seq in the spinal cords from untreated heterozygous mice (gray) and SMA mice with no treatment (black) or HITI (red), cDNA (blue) and DUET (green) treatments 2 weeks after the injections. b, c Pathways of upregulation (b) and downregulation (c) in SMA mice compared to heterozygous mice by gene-set enrichment analyses. Dysregulated genes were identified using the R package DESeq2, which employs the Wald test. The Wald test used in DESeq2 is inherently two-sided, testing for both upregulated and downregulated genes. To account for multiple comparisons, the Benjamini–Hochberg method was applied to control the false discovery rate (FDR). d Heatmap for cholinergic synapse, p53 signaling pathway and cytokine-cytokine receptor interaction in the spinal cord from untreated heterozygous mice and SMA mice with no treatment or each treatment. Both cDNA and DUET treatments improved these molecular dysfunctions in the spinal cord of SMA mice.
Fig. 5
Fig. 5. Synergistic benefits of the Gene-DUET strategy.
a Gross morphology of cDNA-treated SMA mouse (upper) and DUET-treated SMA mouse (lower) at 20 weeks old. b Body weight through time in untreated heterozygous mice and SMA mice with no treatment or each treatment. Gray, red, blue and green line denotes untreated heterozygous mice, untreated SMA mice, cDNA-treated SMA mice and DUET-treated SMA mice respectively. Male mice (circles) are shown on the top and female mice (triangles) are shown on the bottom. n is the number of animals per group. c Schematic of the target enrichment-genome sequencing. Customized probes were designed by 500 bp upstream from the junction site. Green arrow indicates Cas9 cleavage site. d Screenshot of representative edited reads around the junction site (green arrow) in Integrative Genomics Viewer (IGV). e Target enrichment-genome sequencing analysis of the on-target genomic edits compared to unedited genome in the spinal cords, brains and livers from 20 and 40 weeks old DUET-treated SMA mice. f Survival rate between cDNA- and DUET- treated SMA mice with males (left) and females (right). Log-rank (Mantel–Cox) test was used for survival curves. The p value and median survival are indicated for all curves. g Summary of survival analysis. Data of untreated or treated SMA mice are shown in the table. Male mice are shown on the left and female mice are shown on the right. n is the number of animals per group. The Mean, SEM, minimum and maximum of survival days per group are indicated. Log-rank (Mantel–Cox) test was used for statistical analysis between no treatment and each treatment. The test was conducted as a two-sided analysis, and no adjustments were made for multiple comparisons. Source data are provided as a Source Data file.

References

    1. Chaytow, H., Huang, Y.-T., Gillingwater, T. H. & Faller, K. M. E. The role of survival motor neuron protein (SMN) in protein homeostasis. Cell Mol. Life Sci.75, 3877–3894 (2018). 10.1007/s00018-018-2849-1 - DOI - PMC - PubMed
    1. Aragon-Gawinska, K., Mouraux, C., Dangouloff, T. & Servais, L. Spinal Muscular Atrophy Treatment in Patients Identified by Newborn Screening—A Systematic Review. Genes14, 1377 (2023). 10.3390/genes14071377 - DOI - PMC - PubMed
    1. Butchbach, M. E. R. Copy Number Variations in the Survival Motor Neuron Genes: Implications for Spinal Muscular Atrophy and Other Neurodegenerative Diseases. Front. Mol. Biosci.3, 7 (2016). 10.3389/fmolb.2016.00007 - DOI - PMC - PubMed
    1. Hua, Y. et al. Antisense correction of SMN2 splicing in the CNS rescues necrosis in a type III SMA mouse model. Genes Dev.24, 1634–1644 (2010). 10.1101/gad.1941310 - DOI - PMC - PubMed
    1. Mendell, J. R. et al. Single-Dose Gene-Replacement Therapy for Spinal Muscular Atrophy. N. Engl. J. Med.377, 1713–1722 (2017). 10.1056/NEJMoa1706198 - DOI - PubMed

Substances