. 2024 Jul 24;14(1):17040.
doi: 10.1038/s41598-024-67673-8.

Causal computations of supplementary motor area on spatial impulsivity

Affiliations

Causal computations of supplementary motor area on spatial impulsivity

Alberto Carpio et al. Sci Rep. .

Abstract

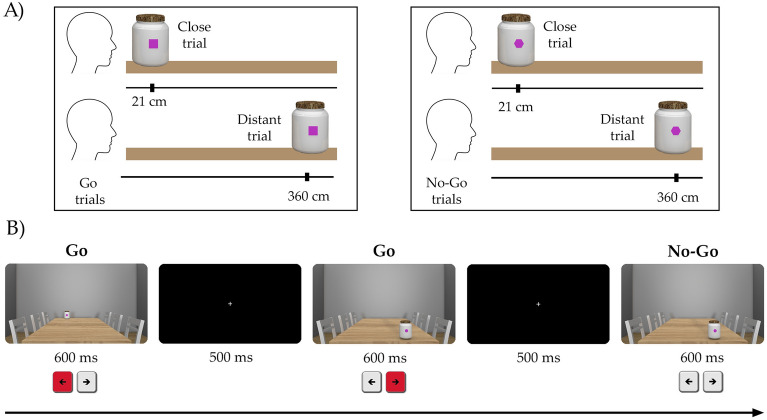
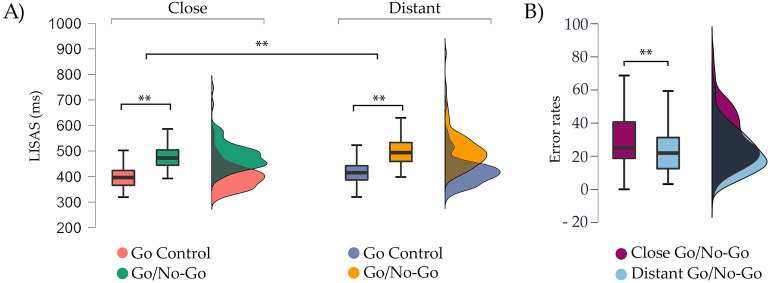
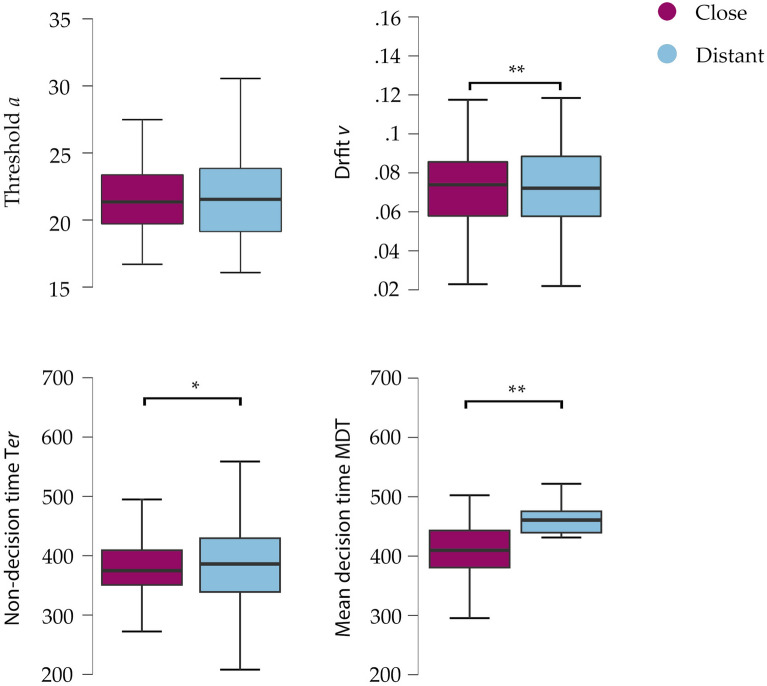
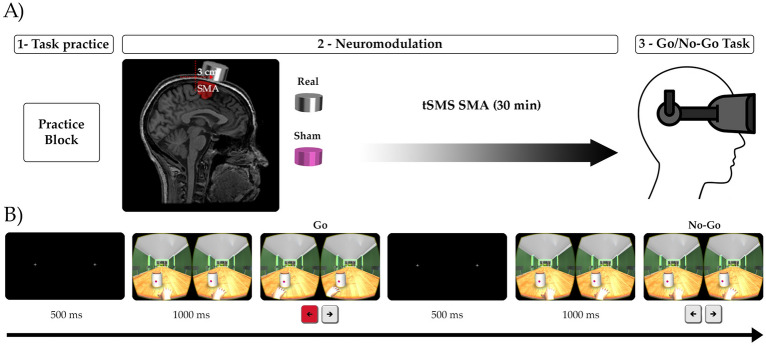
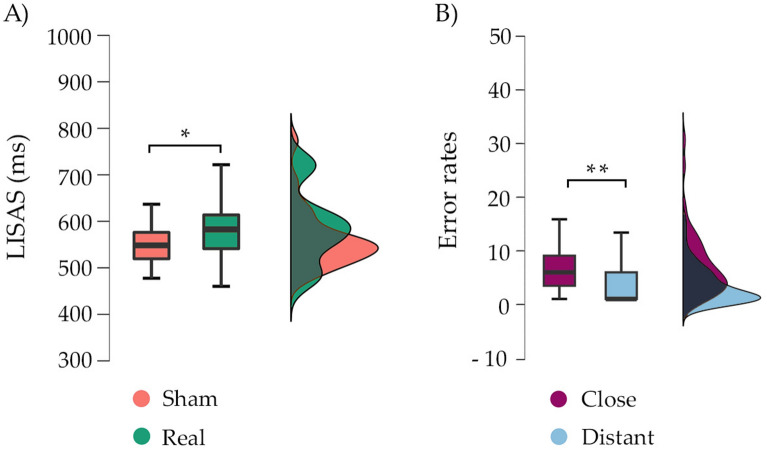
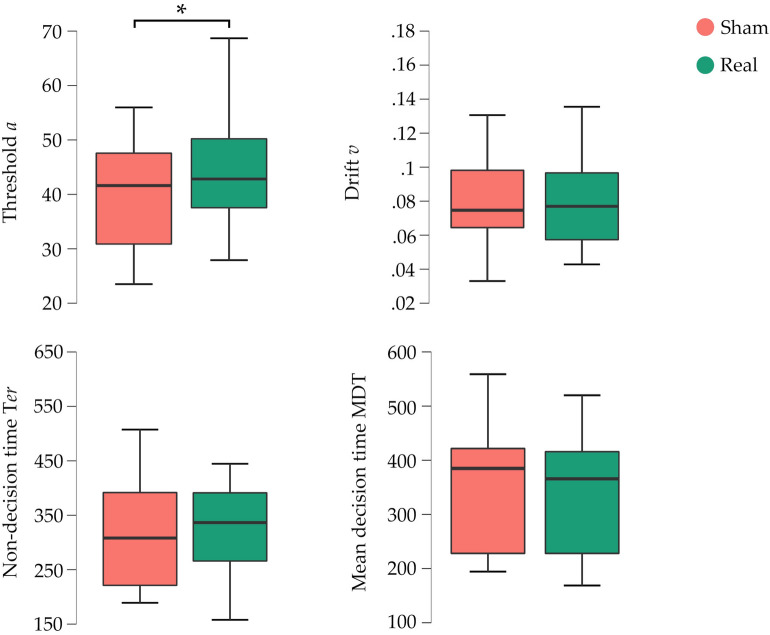
Spatial proximity to important stimuli often induces impulsive behaviour. How we overcome impulsive tendencies is what determines behaviour to be adaptive. Here, we used virtual reality to investigate whether the spatial proximity of stimuli is causally related to the supplementary motor area (SMA) functions. In two experiments, we set out to investigate these processes using a virtual environment that recreates close and distant spaces to test the causal contributions of the SMA in spatial impulsivity. In an online first experiment (N = 93) we validated and measured the influence of distant stimuli using a go/no-go task with close (21 cm) or distant stimuli (360 cm). In experiment 2 (N = 28), we applied transcranial static magnetic stimulation (tSMS) over the SMA (double-blind, crossover, sham-controlled design) to test its computations in controlling impulsive tendencies towards close vs distant stimuli. Reaction times and error rates (omission and commission) were analysed. In addition, the EZ Model parameters (a, v, Ter and MDT) were computed. Close stimuli elicited faster responses compared to distant stimuli but also exhibited higher error rates, specifically in commission errors (experiment 1). Real stimulation over SMA slowed response latencies (experiment 2), an effect mediated by an increase in decision thresholds (a). Current findings suggest that impulsivity might be modulated by spatial proximity, resulting in accelerated actions that may lead to an increase of inaccurate responses to nearby objects. Our study also provides a first starting point on the role of the SMA in regulating spatial impulsivity.

Keywords: Impulsivity; Spatial cognition; Supplementary motor area; Transcranial static magnetic stimulation; Virtual reality.


Conflict of interest statement

The authors declare no competing interests.

Figures

Figure 1
Figure 1
Experimental paradigm used in the experiment 1: (A) Distance manipulation. Pots could appear close (21 cm) or distant (360 cm) from the subject. Go/No-Go task conditions: at the beginning of the task, the subjects were informed which geometric figure would be the go and no-go. In this example, the go trials would be the squares and the no-go trials would be the hexagons. (B) Single trial examples of the task. Example that included two go trials (distant-left and close-right), and one no-go trial (close-right). Ms milliseconds.
Figure 2
Figure 2
Experiment 1 results: (A) Comparison in LISAS (ms) for close (left) and distant (right) stimuli between the go control (left) and go/no-go (right) tasks. A main effect of condition and distance is shown. (B) Comparison of the error rates (commission errors) between close and distant stimuli in the go/no-go task. A higher percentage of close errors were found compared to distant. The median is represented by the central mark within each boxplot, with the edges of the boxplot depicting the 25 and 75th percentiles. The whiskers extend to the minimum and maximum values within 1.5 times the interquartile range from the edges. Statistical significance is denoted by **p < .001.
Figure 3
Figure 3
Main effects of stimulation on the EZ-diffusion parameters. Higher values were found for distant stimuli in the parameters v, Ter and MDT. No differences were found for the parameter a. The median is represented by the central mark within each boxplot, with the edges of the boxplot depicting the 25 and 75th percentiles. The whiskers extend to the minimum and maximum values within 1.5 times the interquartile range from the edges. Statistical significance is denoted by *p < .05.
Figure 4
Figure 4
Paradigm design and neuromodulation procedure in experiment 2. (A) The image depicts a T1-weighted magnetic resonance image (MRI) in standard space, with a magnet positioned precisely over the average SMA target. The SMA target is located 3 cm anterior to Cz. Participants received double-blind cross-over stimulation (real or sham) during 30 min over the SMA. Once completed, they performed the go/no-go task using a virtual reality. (B) Example of the go/no-go task as seen in the virtual reality device. This image is perceived as unique and with depth thanks to the virtual reality glasses. The participant was required to respond to the pot by pressing either the left or right bottoms or abstaining from responding altogether. For this experiment, the task was executed with a peripheral control using a joystick and button pad (DualShock 4 controller for PlayStation 4).
Figure 5
Figure 5
Behavioural findings of experiment 2. (A) A general increment in LISAS (ms) for real compared to sham is found; (B) Comparison of the percentage of commission errors generated by close vs distant stimuli, showing a higher percentage of errors in the close condition compared to distant. The median is represented by the central mark within each boxplot, with the edges of the boxplot depicting the 25 and 75th percentiles. The whiskers extend to the minimum and maximum values within 1.5 times the interquartile range from the edges. Statistical significance is denoted by *p < .05, **p < .001.
Figure 6
Figure 6
Main effects of stimulation on the EZ-diffusion parameters. A main effect of threshold (a) was found showing a higher value for real stimulation compared to sham. The median is represented by the central mark within each boxplot, with the edges of the boxplot depicting the 25 and 75th percentiles. The whiskers extend to the minimum and maximum values within 1.5 times the interquartile range from the edges. Statistical significance is denoted by *p < .05.

References

    1. Botvinick, M. & Plaut, D. C. Doing without schema hierarchies: A recurrent connectionist approach to normal and impaired routine sequential action. Psychol. Rev.111, 395–429 (2004). 10.1037/0033-295X.111.2.395 - DOI - PubMed
    1. Stein, M., Fey, W., Koenig, T., Oehy, J. & Moggi, F. Context-specific inhibition is related to craving in alcohol use disorders: A dangerous imbalance. Alcohol. Clin. Exp. Res.42, 69–80 (2018). 10.1111/acer.13532 - DOI - PubMed
    1. Lloyd, D., Morrison, I. & Roberts, N. Role for human posterior parietal cortex in visual processing of aversive objects in peripersonal space. J. Neurophysiol.95, 205–214 (2006). 10.1152/jn.00614.2005 - DOI - PubMed
    1. Westbrook, A. & Frank, M. Dopamine and proximity in motivation and cognitive control. Curr. Opin. Behav. Sci.22, 28–34 (2018). 10.1016/j.cobeha.2017.12.011 - DOI - PMC - PubMed
    1. Bassolino, M., Finisguerra, A., Canzoneri, E., Serino, A. & Pozzo, T. Dissociating effect of upper limb non-use and overuse on space and body representations. Neuropsychologia70, 385–392 (2015). 10.1016/j.neuropsychologia.2014.11.028 - DOI - PubMed

LinkOut - more resources