. 2024 Jul 24;14(1):17097.
doi: 10.1038/s41598-024-68062-x.

Gnao1 is a molecular switch that regulates the Rho signaling pathway in differentiating neurons

Affiliations

Gnao1 is a molecular switch that regulates the Rho signaling pathway in differentiating neurons

Ryoji Taira et al. Sci Rep. .

Abstract

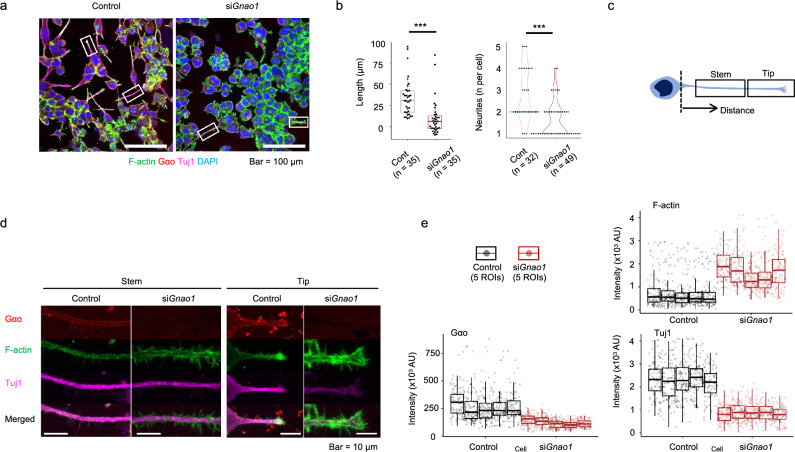
GNAO1 encodes G protein subunit alpha O1 (Gαo). Pathogenic variations in GNAO1 cause developmental delay, intractable seizures, and progressive involuntary movements from early infancy. Because the functional role of GNAO1 in the developing brain remains unclear, therapeutic strategies are still unestablished for patients presenting with GNAO1-associated encephalopathy. We herein report that siRNA-mediated depletion of Gnao1 perturbs the expression of transcripts associated with Rho GTPase signaling in Neuro2a cells. Consistently, siRNA treatment hampered neurite outgrowth and extension. Growth cone formation was markedly disrupted in monolayer neurons differentiated from iPSCs from a patient with a pathogenic variant of Gαo (p.G203R). This variant disabled neuro-spherical assembly, acquisition of the organized structure, and polarized signals of phospho-MLC2 in cortical organoids from the patient's iPSCs. We confirmed that the Rho kinase inhibitor Y27632 restored these morphological phenotypes. Thus, Gαo determines the self-organizing process of the developing brain by regulating the Rho-associated pathway. These data suggest that Rho GTPase pathway might be an alternative target of therapy for patients with GNAO1-associated encephalopathy.

Keywords: GNAO1; Developmental and epileptic encephalopathy; Differentiation; Molecular pathway; Organoids; Rho-associated kinase.


Conflict of interest statement

The authors declare no competing interests.

Figures

Figure 1
Figure 1
RNA sequencing for Gαo-depleted Neuro2a cells. (a) Box-dot plot shows the relative expression of Gnao1 mRNA to actin-β (Actb) in Neuro 2a cells after treatment with siRNA against Gnao1 (siGnao1) or control siRNA. P = 0.100 (n = 3 each group; Wilcoxon’s rank-sum test). (b) Volcano plots for genes detected by RNA sequencing. Green lines indicate the cut-off levels: log2 (Fold Change) > 1 or < − 1; p < 0.05 (− log10 [p-value] > 1.301). Among the 1891 genes with a significant increase (red) or decrease (blue) in expression, the top 10 genes with high—log10 (p-values) were annotated. (c) Heat map clustering of rMATS data for the 2948 transcripts differentially expressed in siGnao1 and control siRNA-treated Neuro2a cells. The color gradient indicates a Z score > 0 (red: high) and < 0 (blue: low) for the expression of each transcript. (d) A Reactome pathway analysis on rMATS data. Bar plots represent p-values for over-representation (blue), the number (white) and percentage (%, orange) of genes annotated in each category. Red circles indicate the categories associated with Rho GTPase signaling. (e) GSEA for RhoA and RhoB GTPase cycle pathways in the Reactome. The expression of genes in these categories did not deviate from either the upregulated or downregulated side.
Figure 2
Figure 2
Morphological analyses of Gαo-depleted Neuro2a cells. (a) An overview of control (left) and Gαo-depleted (right: siGnao1) Neuro2a cells. Merged images of F-actin (phalloidin, green), Gαo (red), Tuj1 (magenta), and DAPI (blue) are shown. The boxes indicate the regions of interest provided in Panel d. (b) Quantitative data on the length (nm) of neurites and number (counts per cell). Median values are shown as horizontal lines (light blue) on the violin plots. ***p < 0.001. (c) Schematic representation of the stem and tip portions of one neurite. The distance represents the length from the soma-neurite junction to the point of fluorescence measurement. (d) Three-channel images of the stem (left) and tip (right) regions of the neurites. (e) Quantitative measurements of F-actin, Gαo, and TUJ1 signals in panel d. Data from control (black) and siGnao1-treated Neuro2a cells (brown) are shown in box-dot plots. All p < 0.001 (siGnao1 vs. control; Kruskal–Wallis test, n = 5 [ROIs] for each group). The distance and fluorescence intensity are labelled on the X and Y axes, respectively. AU, arbitrary unit.
Figure 3
Figure 3
Morphology of neuro-spheroids and neuronal growth cones. (a) Phase-contrast images of neuro-spheroids (arrows) from days 1 to 15. HA, iPSCs from a healthy adult; KO, Gαo-knockout iPSCs from the same individual as HA; PT, iPSCs from a patient with p.G203R variant. (b) Quantitative results of HA, KO, and PT-derived neuro-spheroids. Box-dot plots are line-connected with the mean values of spheroid size at indicated days of differentiation. ***p < 0.001 (HA vs. PT) and p = 0.484 (HA vs. KO), Steel–Dwass’ multiple comparison test (n = 6). Six independent spheroids were used for this analysis. (c) Confocal images of growth cones in monolayer neurons differentiated from HA, KO, and PT-derived iPSCs. (d) A schematic diagram of the Sholl analysis. Segmented filopodia are depicted as red dots on green protrusions, extending from a growth cone (lamellipodia). The red dots are counted as the number of filopodia at a defined radius (μm). (e) A Sholl analysis of growth cones in the HA, KO, and PT- derived neurons. Box-dot plots are line-connected with mean values of the number of filopodia at the indicated radius. P > 0.05 (HA vs. KO) and **p < 0.01 (HA vs. PT); Steel–Dwass’ test (n = 3). Three independent organoids were analyzed.
Figure 4
Figure 4
Morphological analyses of cortical organoids. (a) Immunofluorescence images of organoids from a healthy adult (HA), GNAO1-knockout (KO), and patient (PT, p.G203R)-derived iPSCs. Organoids on day 60 of differentiation were used in this study. HA and KO organoids clearly developed VZ structures (arrows). PT-derived organoids showed a disordered VZ structure. (b) High- magnification images of the ventricular zone (VZ) and cortical plate (CP) in HA, KO, and PT-derived organoids. The dashed lines indicate the boundaries between the VZ and CP layers. Values indicate the circularity index of each VZ. (c) Quantitative results of VZ and CP thickness. *p < 0.05 (Wilcoxon’s rank-sum test). The thicknesses of the VZ and CP were unmeasurable in the PT organoids. For C-E, three independent organoids per group were subjected to analysis. (d) A circularity analysis of the VZ in HA, KO, and PT-derived organoids. *p < 0.05 (Kruskal–Wallis test). (e) Box-dot plots for the NeuN/FoxG1 signal ratio in the VZ. Small dots represent the value in each ROI (n = 621 [HA], 406 [KO] and 628 [PT]). *p < 0.05 and ***p < 0.001 (Kruskal–Wallis test).
Figure 5
Figure 5
Aberrant phosphorylation of MLC2 in patient-derived organoids. (a) Immunofluorescence signals of pMLC2 (red) and MAP2 (magenta) in healthy adult (HA), GNAO1-knockout (KO), and patient-derived (PT) organoids after 60 days of differentiation. Nuclei were counterstained with DAPI (blue). The rectangles in the left panels indicate the regions selected for higher magnification (right panels). Solid lines indicate the positions of the optical sections for the quantitative measurement of pMLC2 and MAP2 signals across the CP and VZ layers. Dashed lines denote the boundaries of the CP and VZ layers. (b) Box-dot plots for pMLC (upper) and MAP2 (lower) signals in HA, KO, and PT organoids. ***p < 0.001 (Steel–Dwass’ multiple comparison, n = 6 for each group). Six optical sections are shown with yellow lines (DAPI, panel a), from which 360–390 ROIs (single pixel) were randomly selected. AU, arbitrary unit. Three independent organoids per group were subjected to this analysis.
Figure 6
Figure 6
Restoring the growth and differentiation of patient-derived organoids by Rho kinase inhibitor. (a) Phase-contrast images of patient (PT)-derived neuro-spheroids (arrows) after treatment with 50, 100 and 250 μM Y27632. Microscopic images were captured at the indicated time points (days 1–15). (b) Aria size of spheroids (μm2) on the indicated days of treatment. Box-dot plots are line-connected with the mean values of spheroid size at indicated days of differentiation. **p < 0.01, ***p < 0.001 (n = 6, Steel–Dwass’ multiple comparison [50 μM vs. 100 μM] and [50 μM vs. 250 μM]). Six independent spheroids were used for this analysis. (c) Immunofluorescence images of PT organoids treated with 50, 100, and 250 μM Y27632. Organoids were cryo-sectioned 15 days after treatment with Y27632. The dashed lines indicate the VZ region. Arrowheads indicate that round-shaped VZ structures were recovered after treatment with 100 μM Y27632. (d) NeuN/FoxG1 ratio in the VZ of PT organoids treated with 50, 100, and 250 μM Y27632. Small dots represent the value in each ROI (n = 1,106 [50 μM], 1,357 [100 μM] and 1438 [250 μM]) ***p < 0.001 (Kruskal–Wallis test). Three independent organoids were analyzed.

References

    1. Kim, S. Y. et al. Spectrum of movement disorders in GNAO1 encephalopathy: In-depth phenotyping and case-by-case analysis. Orphanet. J. Rare Dis.15, 343. 10.1186/s13023-020-01594-3 (2020). 10.1186/s13023-020-01594-3 - DOI - PMC - PubMed
    1. Larasati, Y. A. et al. Restoration of the GTPase activity and cellular interactions of Galpha(o) mutants by Zn(2+) in GNAO1 encephalopathy models. Sci. Adv.8, eabn9350. 10.1126/sciadv.abn9350 (2022). 10.1126/sciadv.abn9350 - DOI - PMC - PubMed
    1. Nakamura, K. et al. De Novo mutations in GNAO1, encoding a Galphao subunit of heterotrimeric G proteins, cause epileptic encephalopathy. Am. J. Hum. Genet.93, 496–505. 10.1016/j.ajhg.2013.07.014 (2013). 10.1016/j.ajhg.2013.07.014 - DOI - PMC - PubMed
    1. Perez-Duenas, B. et al. The genetic landscape of complex childhood-onset hyperkinetic movement disorders. Mov. Disord.37, 2197–2209. 10.1002/mds.29182 (2022). 10.1002/mds.29182 - DOI - PMC - PubMed
    1. Saitsu, H. et al. Phenotypic spectrum of GNAO1 variants: Epileptic encephalopathy to involuntary movements with severe developmental delay. Eur. J. Hum. Genet.24, 129–134. 10.1038/ejhg.2015.92 (2016). 10.1038/ejhg.2015.92 - DOI - PMC - PubMed

MeSH terms