. 2024 Sep;31(9):1170-1183.
doi: 10.1038/s41418-024-01346-x. Epub 2024 Jul 25.

MTGR1 is required to maintain small intestinal stem cell populations

Affiliations

MTGR1 is required to maintain small intestinal stem cell populations

Sarah P Short et al. Cell Death Differ. 2024 Sep.

Abstract

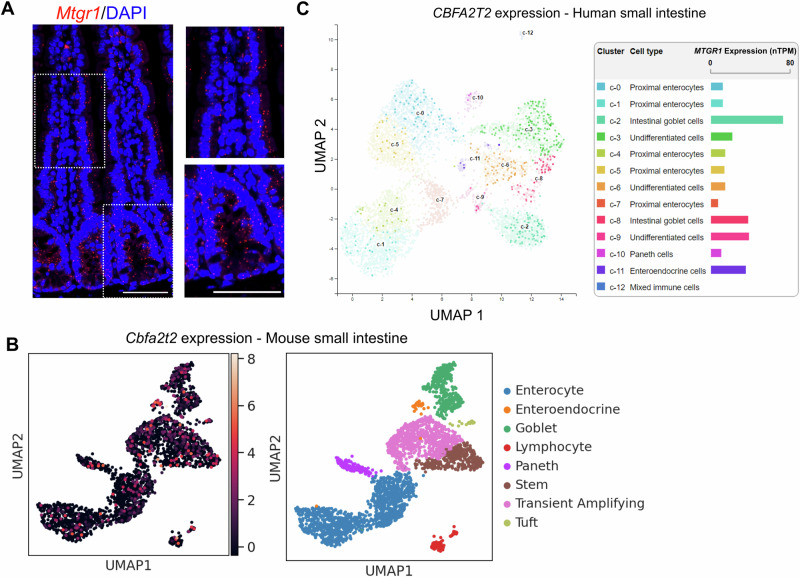
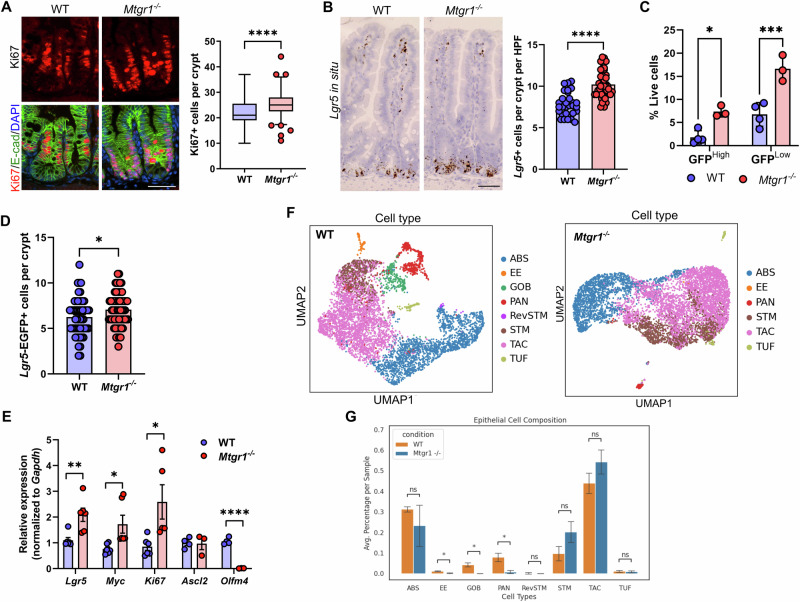
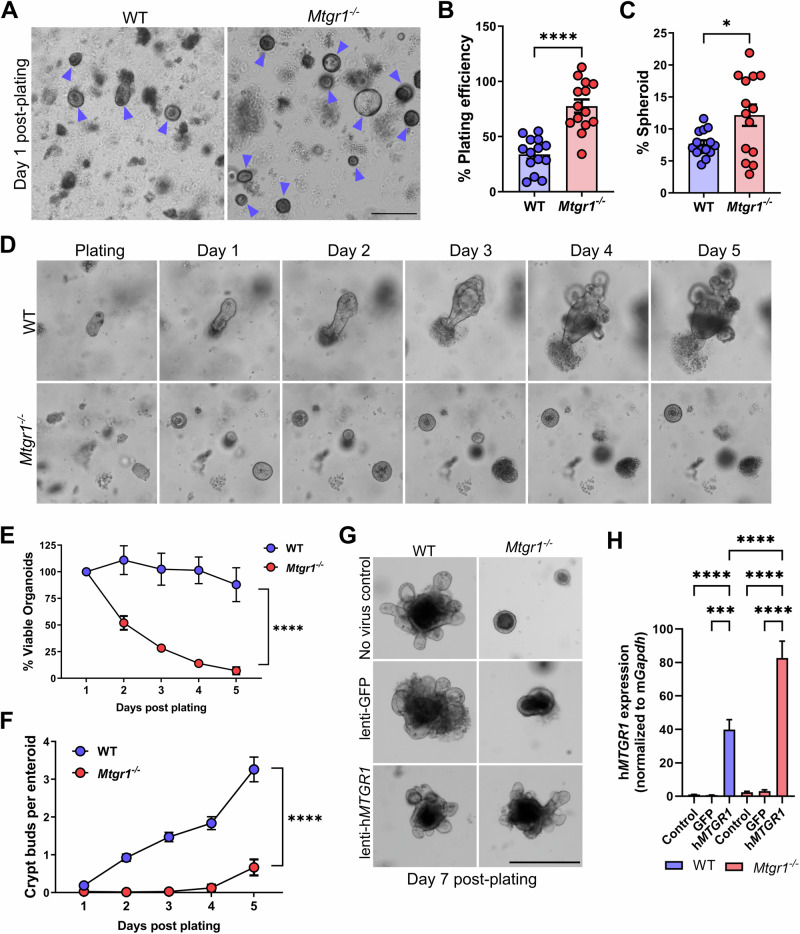
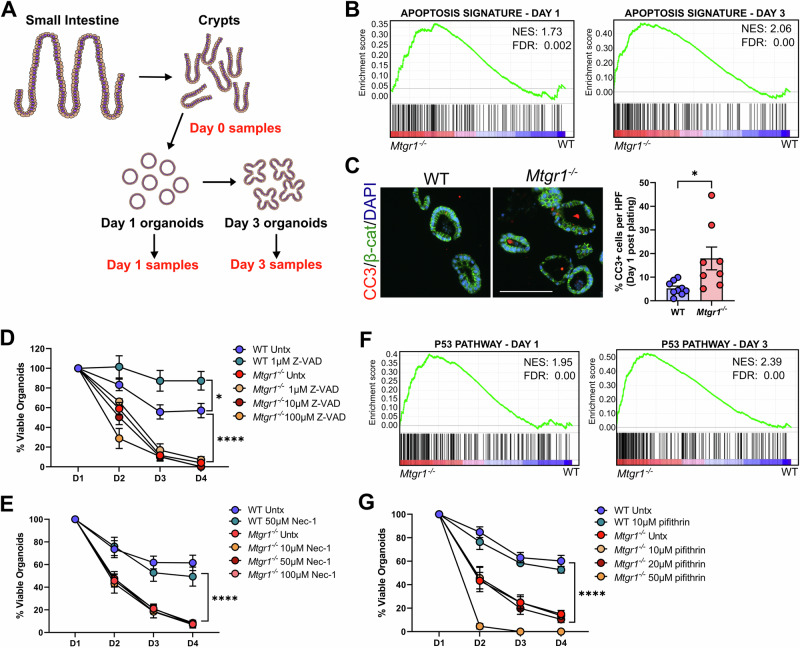
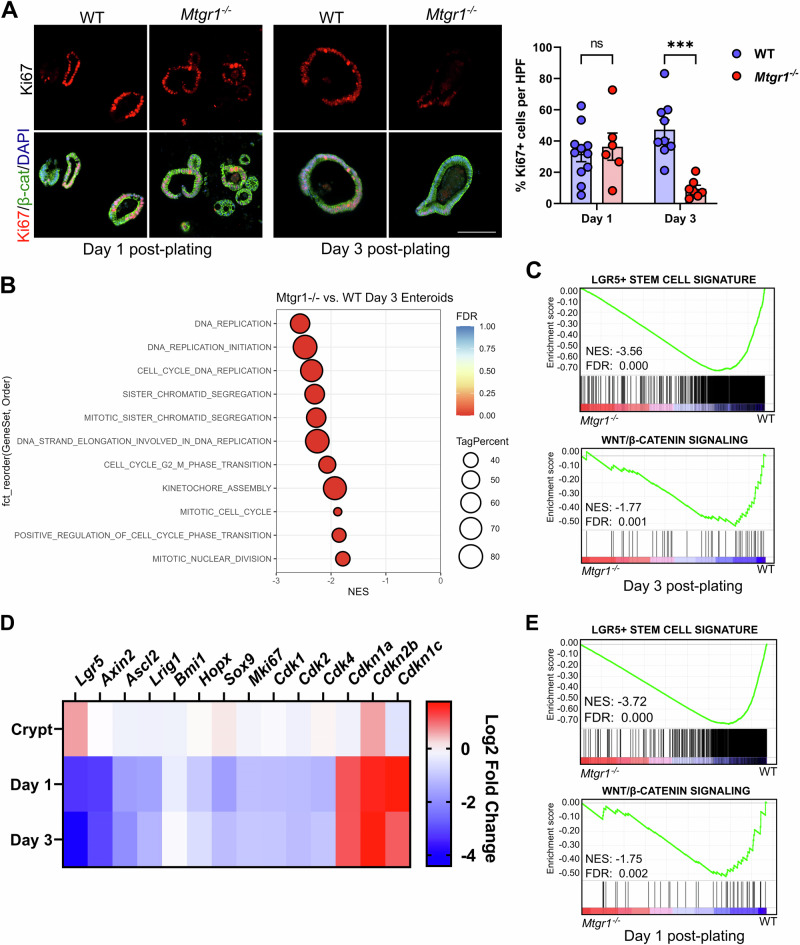
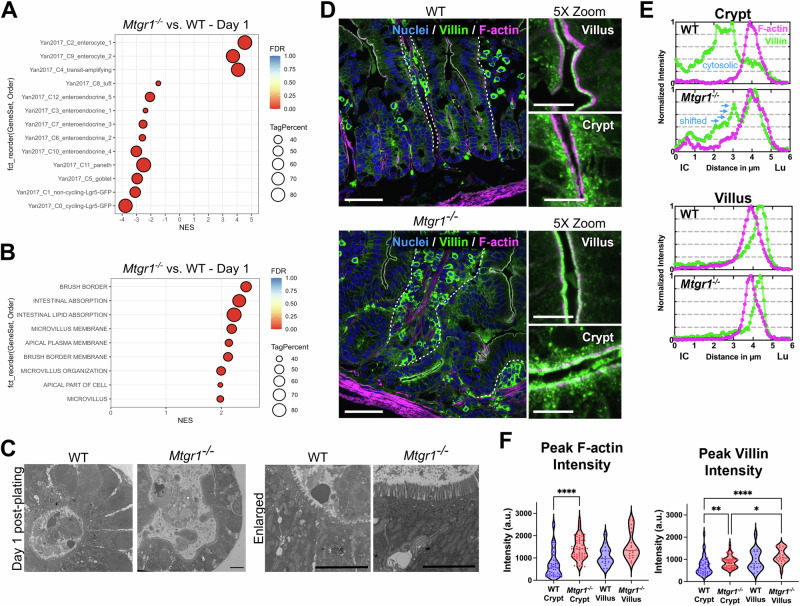
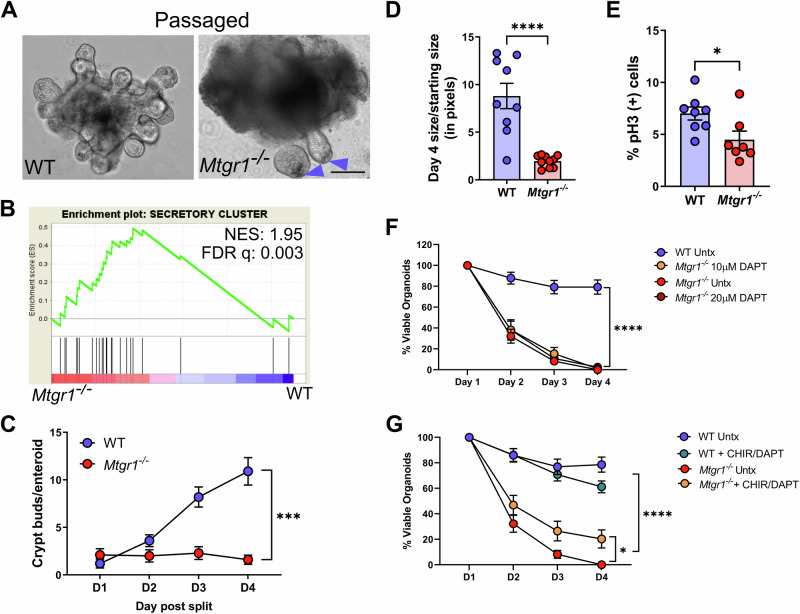
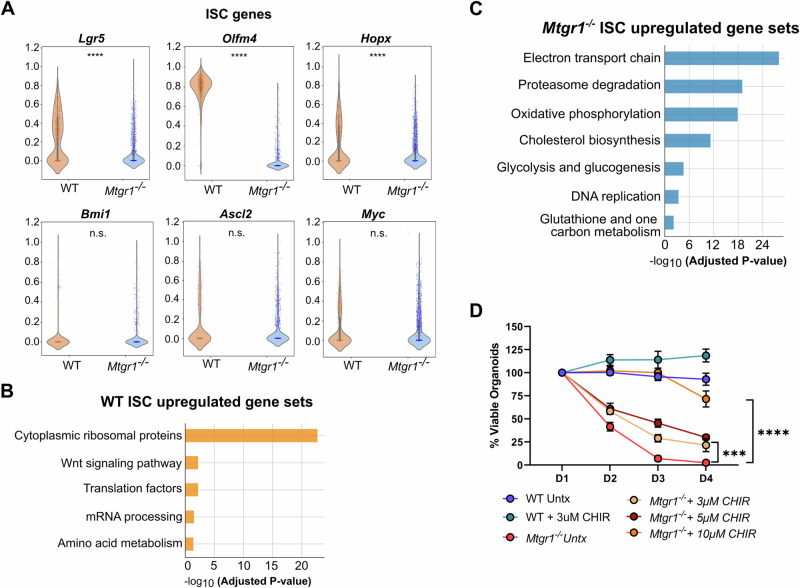
Undifferentiated intestinal stem cells (ISCs) are crucial for maintaining homeostasis and resolving injury. Lgr5+ cells in the crypt base constantly divide, pushing daughter cells upward along the crypt axis where they differentiate into specialized cell types. Coordinated execution of complex transcriptional programs is necessary to allow for the maintenance of undifferentiated stem cells while permitting differentiation of the wide array of intestinal cells necessary for homeostasis. Previously, members of the myeloid translocation gene (MTG) family have been identified as transcriptional co-repressors that regulate stem cell maintenance and differentiation programs in multiple organ systems, including the intestine. One MTG family member, myeloid translocation gene related 1 (MTGR1), has been recognized as a crucial regulator of secretory cell differentiation and response to injury. However, whether MTGR1 contributes to the function of ISCs has not yet been examined. Here, using Mtgr1-/- mice, we have assessed the effects of MTGR1 loss specifically in ISC biology. Interestingly, loss of MTGR1 increased the total number of cells expressing Lgr5, the canonical marker of cycling ISCs, suggesting higher overall stem cell numbers. However, expanded transcriptomic and functional analyses revealed deficiencies in Mtgr1-null ISCs, including deregulated ISC-associated transcriptional programs. Ex vivo, intestinal organoids established from Mtgr1-null mice were unable to survive and expand due to aberrant differentiation and loss of stem and proliferative cells. Together, these results indicate that the role of MTGR1 in intestinal differentiation is likely stem cell intrinsic and identify a novel role for MTGR1 in maintaining ISC function.


Conflict of interest statement

The authors declare no competing interests.

Figures

Fig. 1
Fig. 1. MTGR1 is widely expressed in the small intestine.
A Mtgr1 mRNA assessed by RNAScope in the WT small intestine. Results representative of 3 independent experiments. Dotted lines indicate inset areas. Scale bar = 100 µm. B Uniform manifold approximation and projections (UMAPs) showing Mtgr1 (Cbfa2t2) expression in the murine ileum by scRNA-sequencing (left) and associated cell clusters (right). n = 2 mice. C Human MTGR1 (CBFA2T2) expression was queried from the Human Protein Atlas scRNA-sequencing data. MTGR1 expression is visualized by UMAP (left) and bar graphs (right) in various intestinal cell types.
Fig. 2
Fig. 2. MTGR1 loss increases ISC number and deregulates intestinal stem cell programs.
A Immunofluorescent staining for Ki67 (red), E-cadherin (green), and nuclei (DAPI, blue) in the small intestine of 8–12-week-old WT and Mtgr1−/− mice. n = 4 mice per genotype, >20 high-powered fields (HPFs) per mouse. B Lgr5 mRNA expression was visualized in the WT and Mtgr1−/− small intestine by RNAscope. n = 4 WT and 3 Mtgr1−/− mice, 12 HPFs per mouse. C Mtgr1−/− mice were intercrossed with the Lgr5-cre-EGFP reporter strain and isolated crypt cells were stratified by Lgr5-EGFP expression through FACS. n = 4 WT and 3 Mtgr1−/− mice. D Lgr5-EGFP assessed by immunofluorescence. Quantification shows the number of GFP positive cells in each reporter positive crypt, per mouse. n = 9 mice per genotype. E q-RT-PCR of stem cell markers Lgr5, Myc, Ki67, Ascl2, and Olfm4 in intestinal crypt isolates from Mtgr1−/− and WT mice (n = 3–6 mice per genotype). Results were normalized to Gapdh and represented as fold change over WT expression. F UMAPs depicting cell types as determined from scRNA-sequencing results from WT and Mtgr1−/− intestinal cells and (G) numerical representation. n = 3 WT and 2 Mtgr1−/− duodenal samples. ABS absorptive, EE enteroendocrine, GOB goblet, PAN Paneth, RevSTM revival stem, STM stem, TAC transit amplifying cell, TUF tuft. *P < 0.05, **P < 0.01, ***P < 0.001, ****P < 0.0001, Mann–Whitney test (A, D, select E), Student’s t test (B, select E), or two-way ANOVA with Sidak’s multiple comparison test (C), Scale bars = 100 µm.
Fig. 3
Fig. 3. MTGR1 loss increases initial plating efficiency but is not compatible with enteroid survival.
A Crypts were isolated from WT and Mtgr1−/− mice and plated as intestinal enteroids. Representative images of enteroids at day 1 post-plating with enteroids marked by blue arrows. Scale bar = 200 µm (left), (AE) representative of 4 independent experiments. B Quantification of overall plating efficiency (enteroids established divided by crypts plated) and (C) percentage of enteroids with cystic morphology calculated per well at day 1 post-plating. n = 14 wells per genotype. D 5-day timelapse imaging of WT and Mtgr1−/− enteroids. E Average enteroid viability post-plating, shown as the percent viable enteroids remaining from day 1. n = averaged 4 independent experiments per genotype. F Quantification of crypt budding post-plating. n = 75, 67, 74, 68, and 26 WT enteroids and n = 136, 121, 70, 16, and 6 Mtgr1−/− enteroids. G WT and Mtgr1−/− crypts were transduced with lentiviral GFP or human MTGR1 and plated to allow enteroid formation. Representative images at day 7 post-infection/plating. Scale bars = 500 µm. H Transduced enteroids were collected at day 7 post-infection for mRNA analysis of human MTGR1. Results were normalized to Gapdh and shown as fold change over WT non-transduced controls. n = 2–3 independent experiments for addback studies. *P < 0.05, **P < 0.01, ***P < 0.001, ****P < 0.0001, Student’s t test (B, C), two-way ANOVA (E, F), or one-way ANOVA (H).
Fig. 4
Fig. 4. MTGR1-dependent enteroid loss cannot be rescued by inhibition of cell death pathways.
A Schematic of RNA-sequencing experiment of crypts and enteroids. n = 3 mice per genotype per timepoint. B GSEA of “Hallmark” collection apoptosis-related genes in Mtgr1−/− enteroids at day 1 (left) and day 3 (right) post-plating. NES = normalized enrichment score. C Enteroids were fixed and embedded at day 1 post-plating, and apoptotic cells were marked by immunofluorescent staining against cleaved caspase-3 (CC3, red). β-catenin (green) and DAPI (blue) were used for co-staining. Quantification shown as percent CC3-positive cells per high powered field (HPF). Scale bar = 200 µm. n = 9 WT and 8 Mtgr1−/− HPFs. D Enteroids were plated and overlaid with media containing indicated concentrations of the caspase inhibitor, Z-VAD-FMK, or (E) the necrosis inhibitor, necrostatin. Enteroids were counted daily and normalized to day 1 numbers. n = 6 wells per condition. F GSEA of “Hallmark” collection p53 pathway-related genes in Mtgr1−/− enteroids at day 1 (left) and day 3 (right) post-plating. G Enteroids were plated and overlaid with media containing the p53 inhibitor, pifithrin, as indicated. n = 6 WT and 12 untreated, 9 (10 µm), 10 (20 µm), and 3 (50 µm) Mtgr1−/− enteroid wells. *P < 0.05, ****P < 0.0001, Student’s t test (C) or two-way ANOVA (D, E, G), significance indicated by FDR q value (B, F).
Fig. 5
Fig. 5. MTGR1 loss decreases proliferation and stem cell-associated gene expression during enteroid maturation.
A WT and Mtgr1−/− enteroids were fixed at day 1 and day 3 post-plating and proliferative cells were marked via immunohistochemistry for Ki67 (red). β-catenin (green) and DAPI (blue) were used for co-staining. Quantification shown as percent Ki67-positive cells per high powered field (HPF). Scale bar = 200 µm. n = 11 or 9 WT and 6 or 7 Mtgr1−/− HFPs per timepoint. B Gene set enrichment analysis (GSEA) of day 3 RNA-sequencing results using cell cycle-related gene sets queried from the Gene Ontology collection. NES = normalized enrichment score. Tag % = the percentage of gene hits before (for positive ES) or after (for negative ES) the peak in the running ES, indicating the percentage of genes contributing to the ES. C GSEA of day 3 RNA-sequencing results with intestinal stem cell- (top) and Wnt-associated (bottom) gene sets. D Heatmap of RNA-sequencing results of stem cell, cyclin dependent kinases, and cyclin-dependent kinase inhibitors from crypt, day 1, and day 3 results. Represented as the Log2 fold change of Mtgr1−/− results as compared to WT at that timepoint. E GSEA of day 1 RNA-sequencing results with intestinal stem cell- (top) and Wnt-associated (bottom) gene sets. ns = nonsignificant, ***P < 0.001, Student’s t test (A), significance indicated by FDR q value (B, C, E).
Fig. 6
Fig. 6. MTGR1 loss promotes absorptive differentiation.
A Gene set enrichment analysis (GSEA) of Mtgr1−/− day 1 enteroid RNA-sequencing results using gene sets representing intestinal epithelial cell types. NES = normalized enrichment score. Tag % = the percentage of gene hits before (for positive ES) or after (for negative ES) the peak in the running ES, indicating the percentage of genes contributing to the ES. Significance indicated by FDR q value. B GSEA of day 1 Mtgr1−/− RNA-sequencing results using gene sets representing microvilli and brush border biology queried from the Gene Ontology collection at day 1 post plating. C Representative electron microscopy images from WT and Mtgr1−/− day 1 enteroid samples, n = 2 per genotype. Scale bar = 5 µm. D Representative confocal images from WT and Mtgr1−/− mouse duodenal tissue stained with DRAQ5 (blue, nuclei), Villin (green), and phalloidin (F-actin, magenta). Dotted lines designate basal epithelial border on villi. Enlarged images (5x zoom) highlight crypt and villus surfaces. Main panel scale bars 50 µm, 5× zoom scale bars 10 µm. E Representative normalized line scans showing F-actin (magenta) and Villin (green) intensities. Line scans are oriented from intracellular (IC, distance = 0) to the intestinal lumen (Lu). F Quantification of peak F-actin intensity (left) and peak Villin intensity (right) on crypt and villus epithelial surfaces. Data represents peak background subtracted intensity from a minimum of 15 line-scans obtained from at least 5 separate crypts/villi and tissue from 3 separate mice. *P < 0.05, **P < 0.01, ****P < 0.0001. Significance indicated by FDR q value (A, B) or Kruskal–Wallis test (F).
Fig. 7
Fig. 7. Secretory differentiation promotes, but does not rescue, survival of Mtgr1 null enteroids.
A Representative images showing passaged WT enteroids and Mtgr1−/− enteroids. Passaged WT and Mtgr1−/− enteroids both had discernable Paneth cells in the crypt base (arrows). Scale bar = 200 µm. B Gene set enrichment analysis (GSEA) of passaged Mtgr1−/− enteroids against secretory cell associated genes. NES normalized enrichment score. Significance indicated by FDR q value. C Quantification of crypt buds per passaged enteroid post-split, n = 10 enteroids per genotype. D Passaged enteroids were imaged at day 1 and day 4 post-passage and enteroid area measured via ImageJ. Change in size was calculated by dividing day 4 measurements by those taken at day 1. n = 10 enteroids per genotype. E Passaged Mtgr1−/− enteroids were fixed and stained with phospho-histone H3 (pH3) to mark proliferative cells. Quantification shown as percent pH3-positive cells per high powered field (HPF). n = 8 WT and 7 Mtgr1−/− HPFs. F Enteroids were plated and overlaid with media containing indicated concentrations of the gamma secretase inhibitor, DAPT. Enteroids were counted daily and normalized to day 1 numbers. n = 7 WT and 8 Mtgr1−/− wells per condition. G WT and Mtgr1−/− enteroids were plated and supplemented with 3 µM of CHIR-99021 (CHIR) and 10 µM DAPT. Enteroids were counted daily and normalized to day 1 numbers. n = 8 wells per condition. Enteroid numbers were assessed daily and normalized to day 1 results. *P < 0.05, ***P < 0.001, ****P < 0.0001, significance indicated by FDR q value (B), two-way ANOVA (C, F, G), and Student’s t test (D, E).
Fig. 8
Fig. 8. Deficient Mtgr1−/− ISCs can be rescued by high Wnt stimulation.
A ISC cells identified by scRNA-seq were queried for expression of ISC associated genes. B ISC-specific transcriptomic signatures were assessed by GSEA using the WikiPathways_2019_Mouse collection. Subset of statistically significant gene sets/pathways shown here (all significant pathways shown in Supplementary Fig. 7) for WT and (C) Mtgr1−/− ISCs. D WT and Mtgr1−/− enteroids were plated with the indicated amounts of CHIR. Enteroid numbers were assessed daily and normalized to day 1 results. n = 7 WT and 10 Mtgr1−/− control samples, 4 samples for all other genotypes/conditions. ***P < 0.001, ****P < 0.0001, Mann–Whitney Wilcoxon test (A), significance indicated by FDR q value (B, C), or two-way ANOVA (D).

Update of

References

    1. Barker N, van Es JH, Kuipers J, Kujala P, van den Born M, Cozijnsen M, et al. Identification of stem cells in small intestine and colon by marker gene Lgr5. Nature. 2007;449:1003–7. 10.1038/nature06196 - DOI - PubMed
    1. Bankaitis ED, Ha A, Kuo CJ, Magness ST. Reserve stem cells in intestinal homeostasis and injury. Gastroenterology. 2018;155:1348–61. 10.1053/j.gastro.2018.08.016 - DOI - PMC - PubMed
    1. Beumer J, Clevers H. Regulation and plasticity of intestinal stem cells during homeostasis and regeneration. Development. 2016;143:3639–49. 10.1242/dev.133132 - DOI - PubMed
    1. Vega PN, Lau KS, Goldenring JR. Not all insults are created equal for awakening dormant stem cell abilities. Cell Mol Gastroenterol Hepatol. 2019;7:619–21. 10.1016/j.jcmgh.2018.12.003 - DOI - PMC - PubMed
    1. Ayyaz A, Kumar S, Sangiorgi B, Ghoshal B, Gosio J, Ouladan S, et al. Single-cell transcriptomes of the regenerating intestine reveal a revival stem cell. Nature. 2019;569:121–5. 10.1038/s41586-019-1154-y - DOI - PubMed

Grants and funding