. 2024 Aug;56(8):1712-1724.
doi: 10.1038/s41588-024-01802-x. Epub 2024 Jul 24.

Single-cell multi-omic and spatial profiling of human kidneys implicates the fibrotic microenvironment in kidney disease progression

Affiliations

Single-cell multi-omic and spatial profiling of human kidneys implicates the fibrotic microenvironment in kidney disease progression

Amin Abedini et al. Nat Genet. 2024 Aug.

Abstract

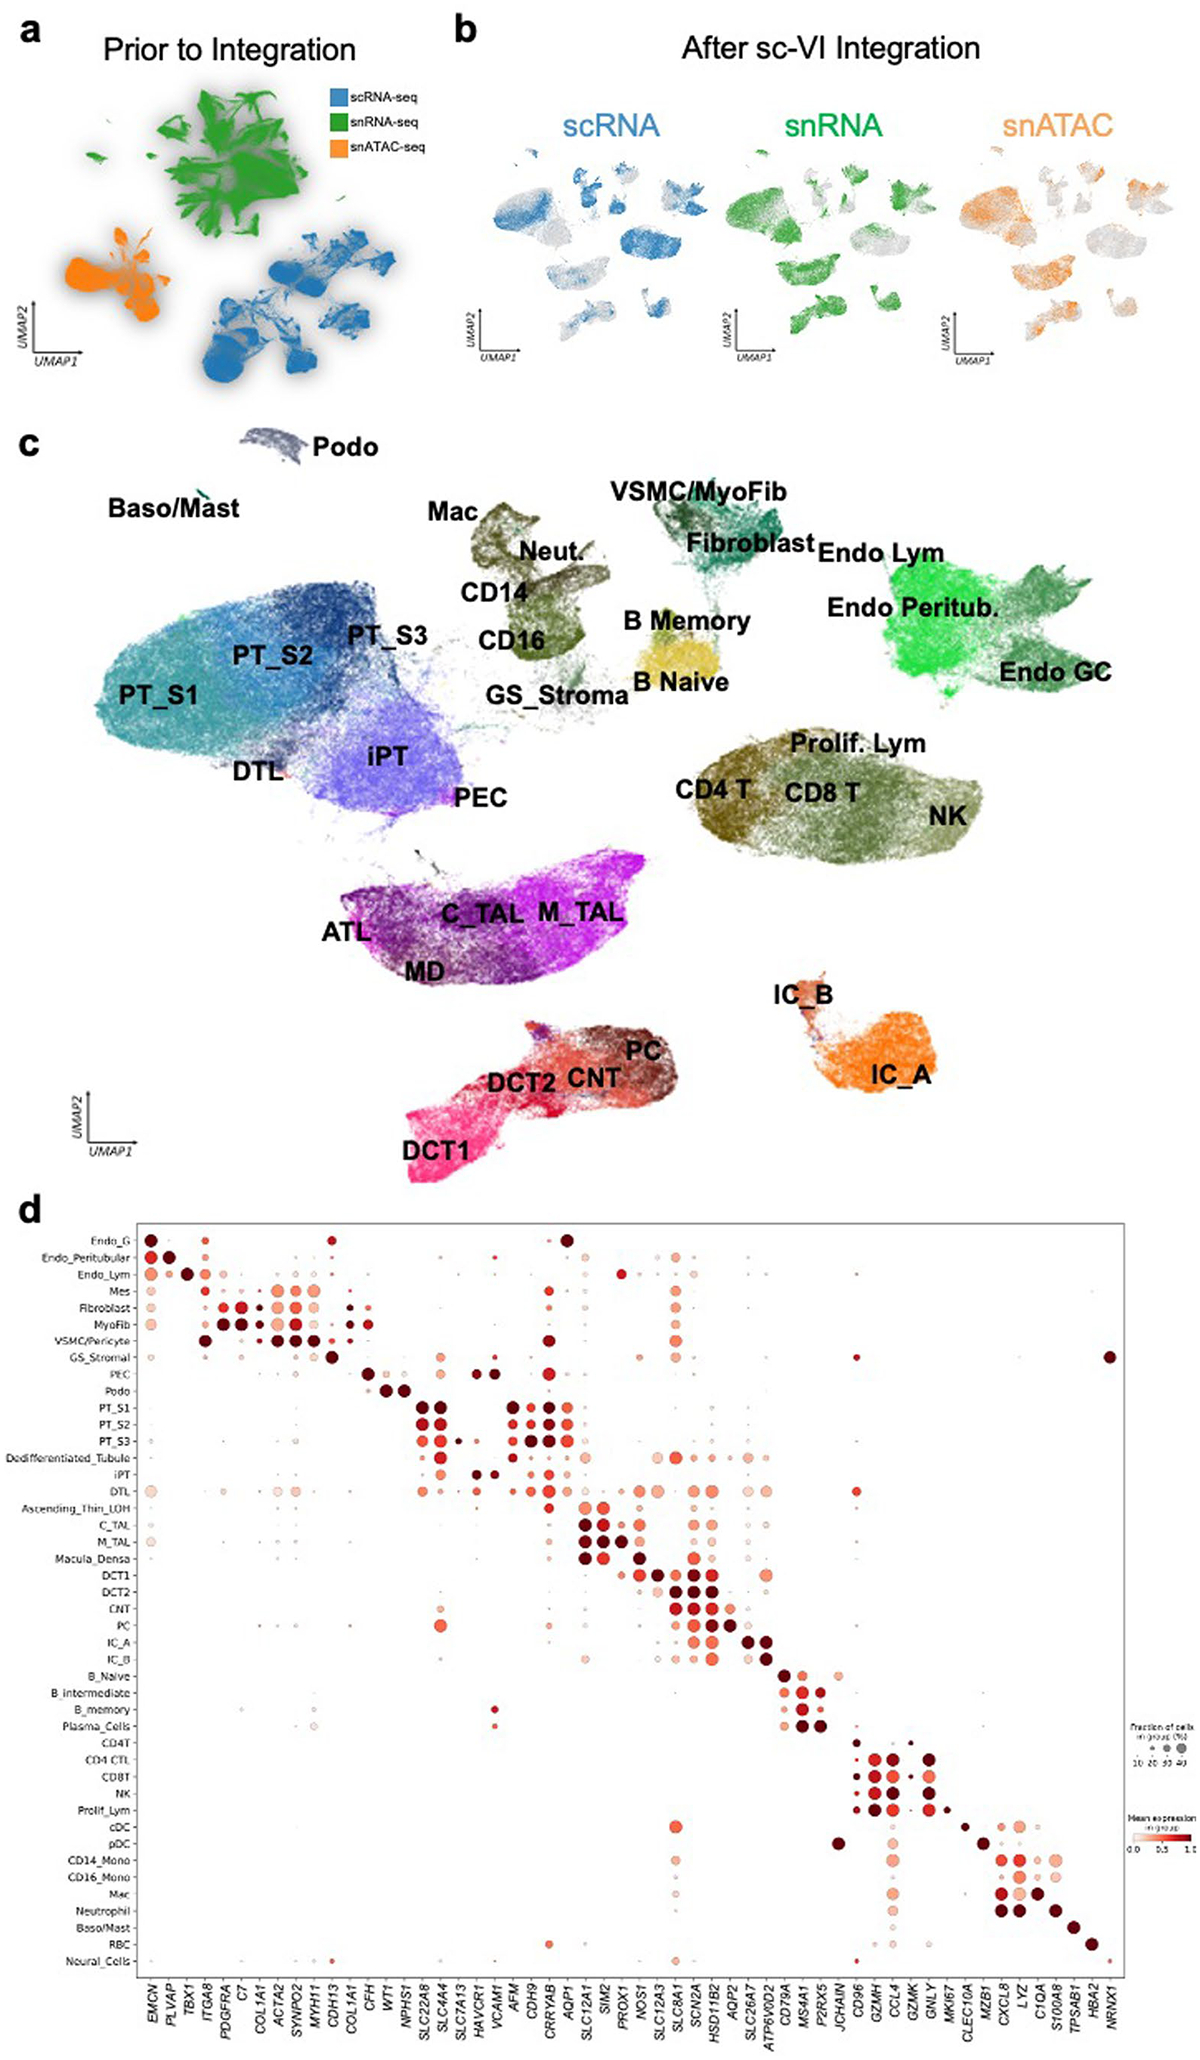
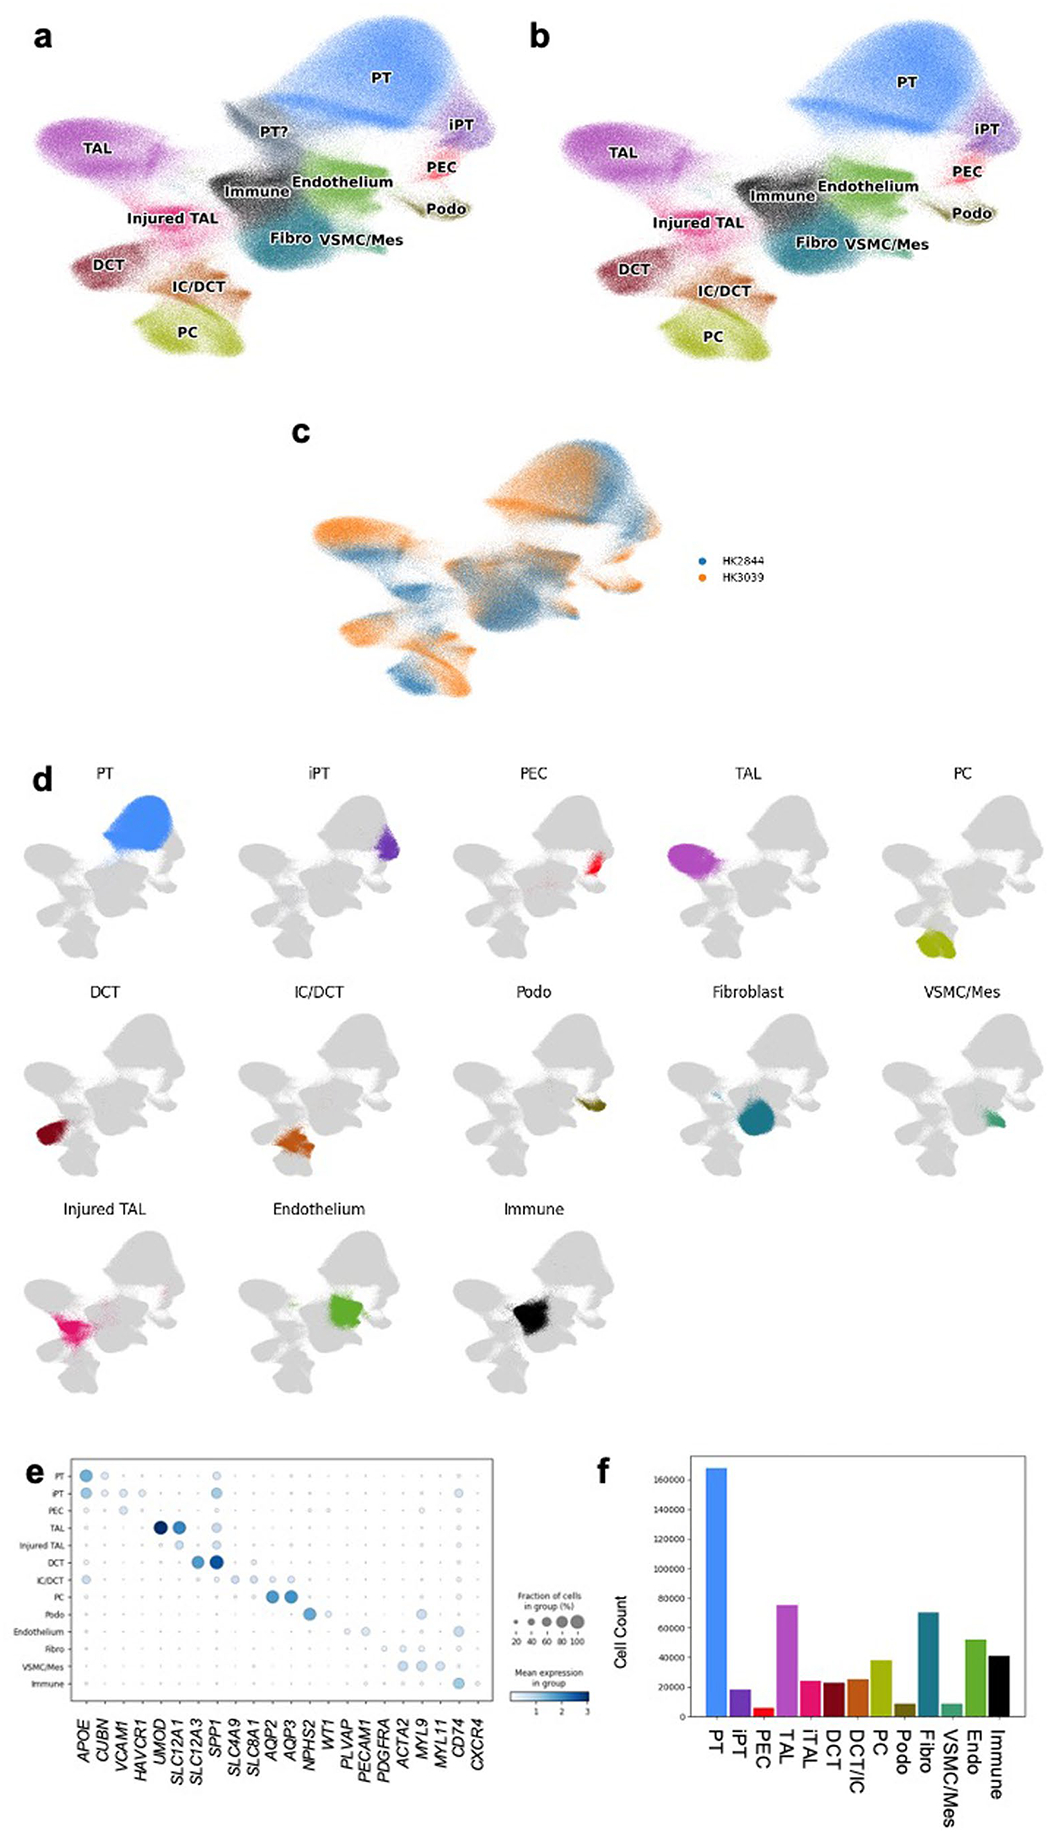
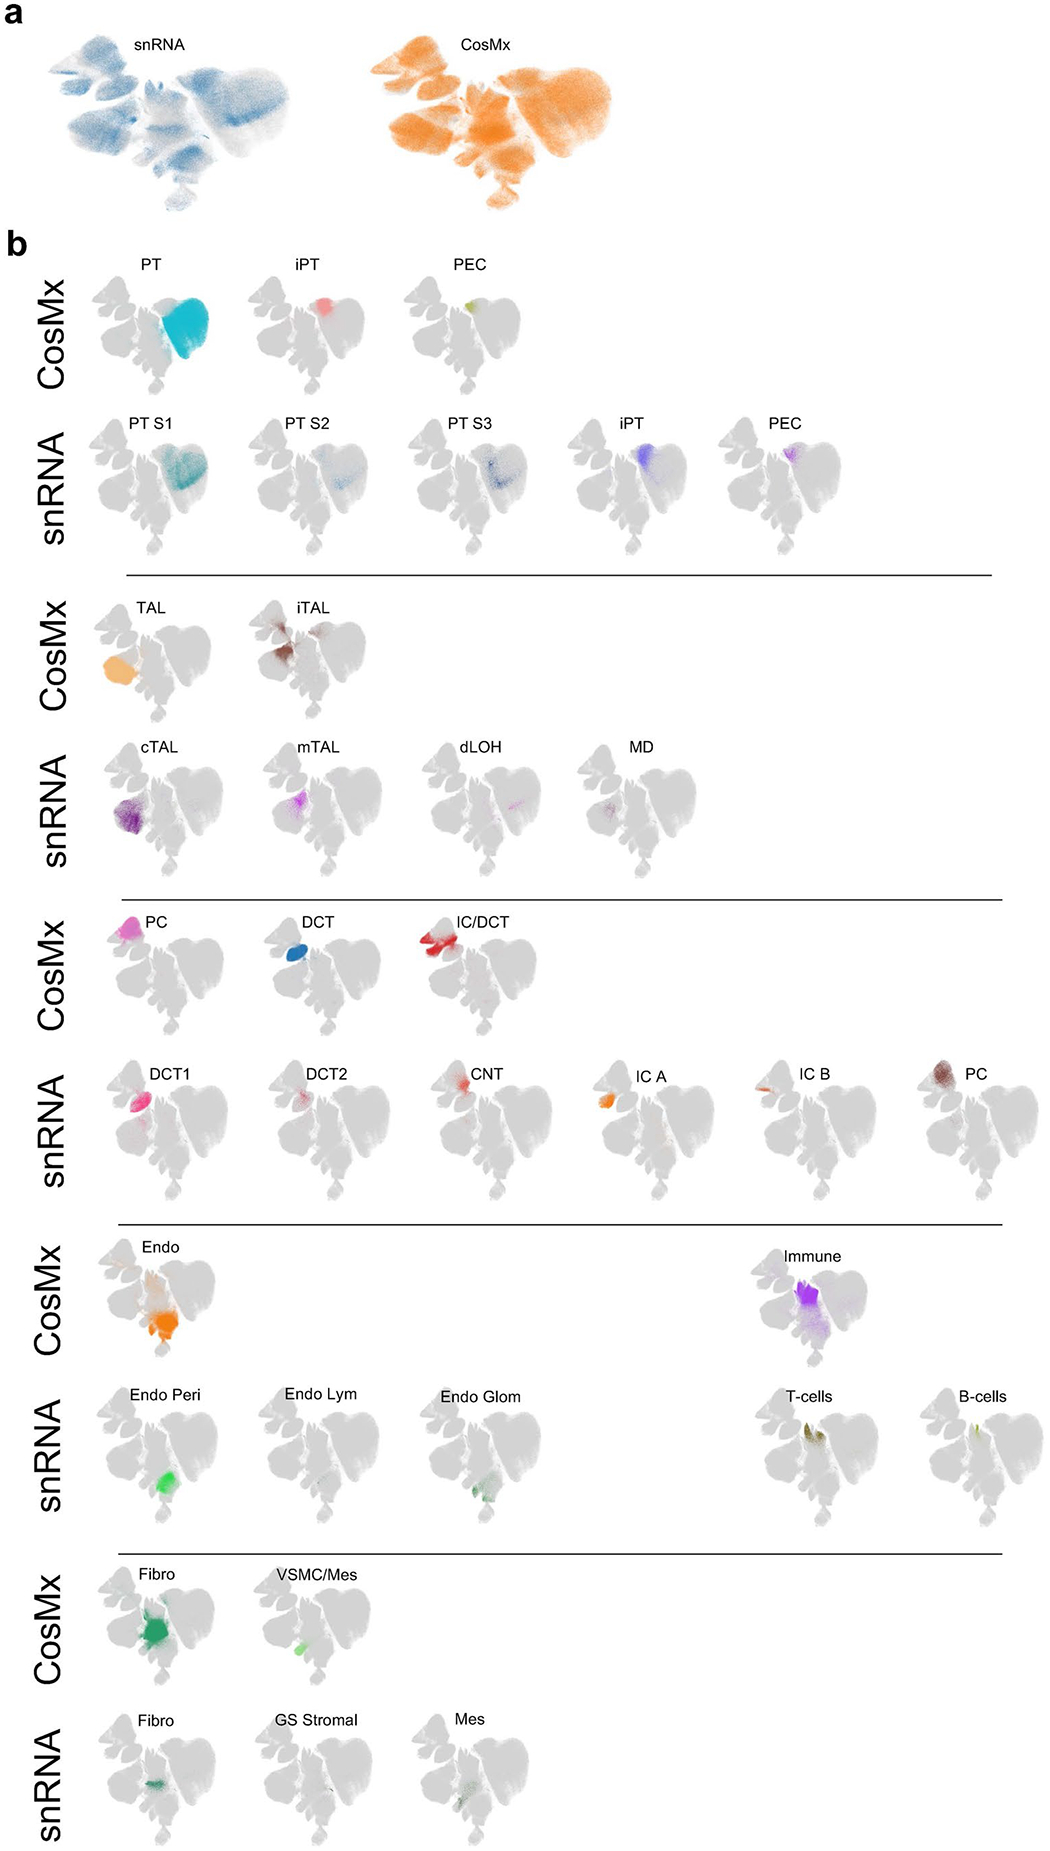
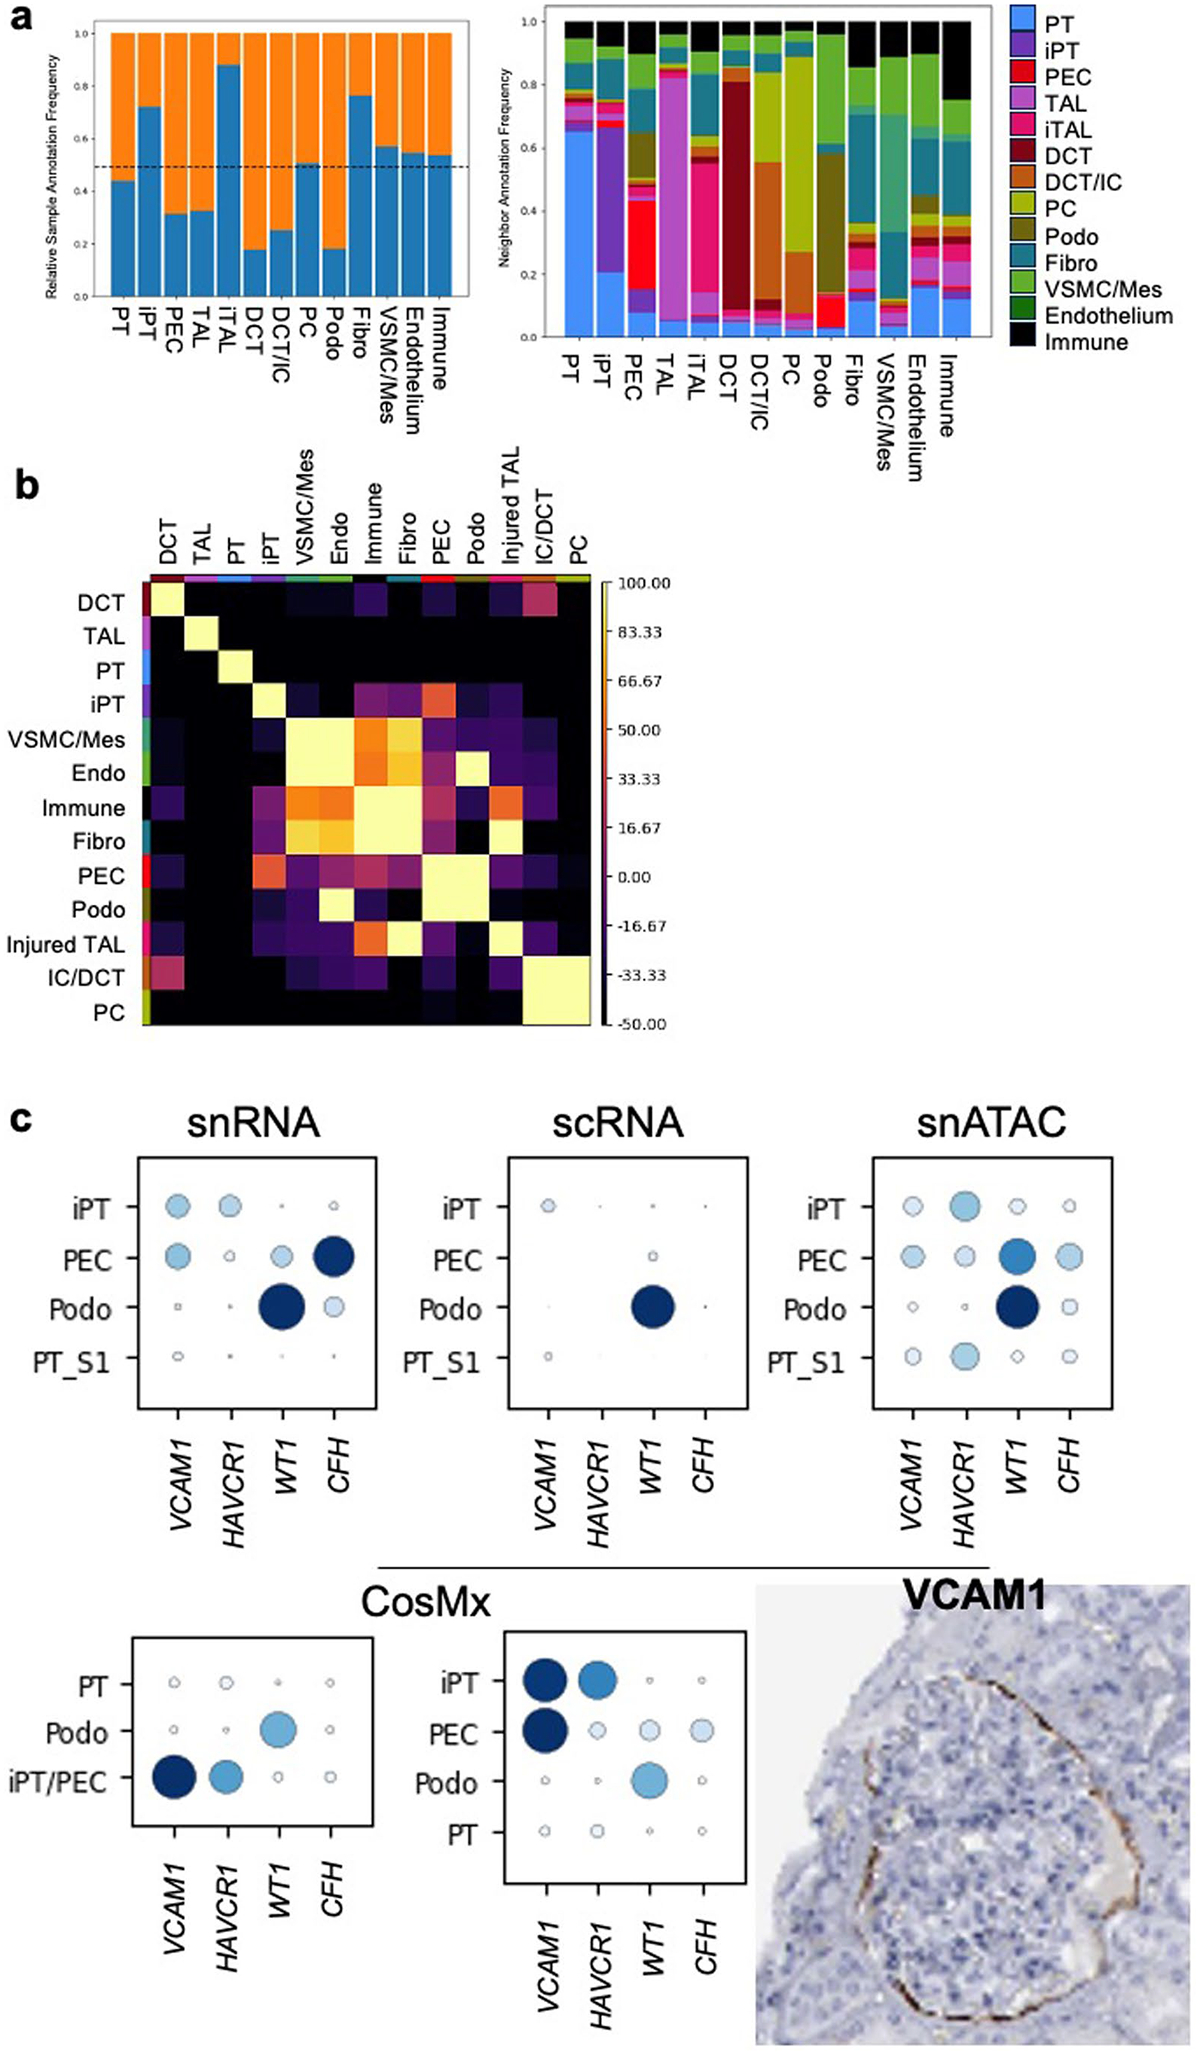
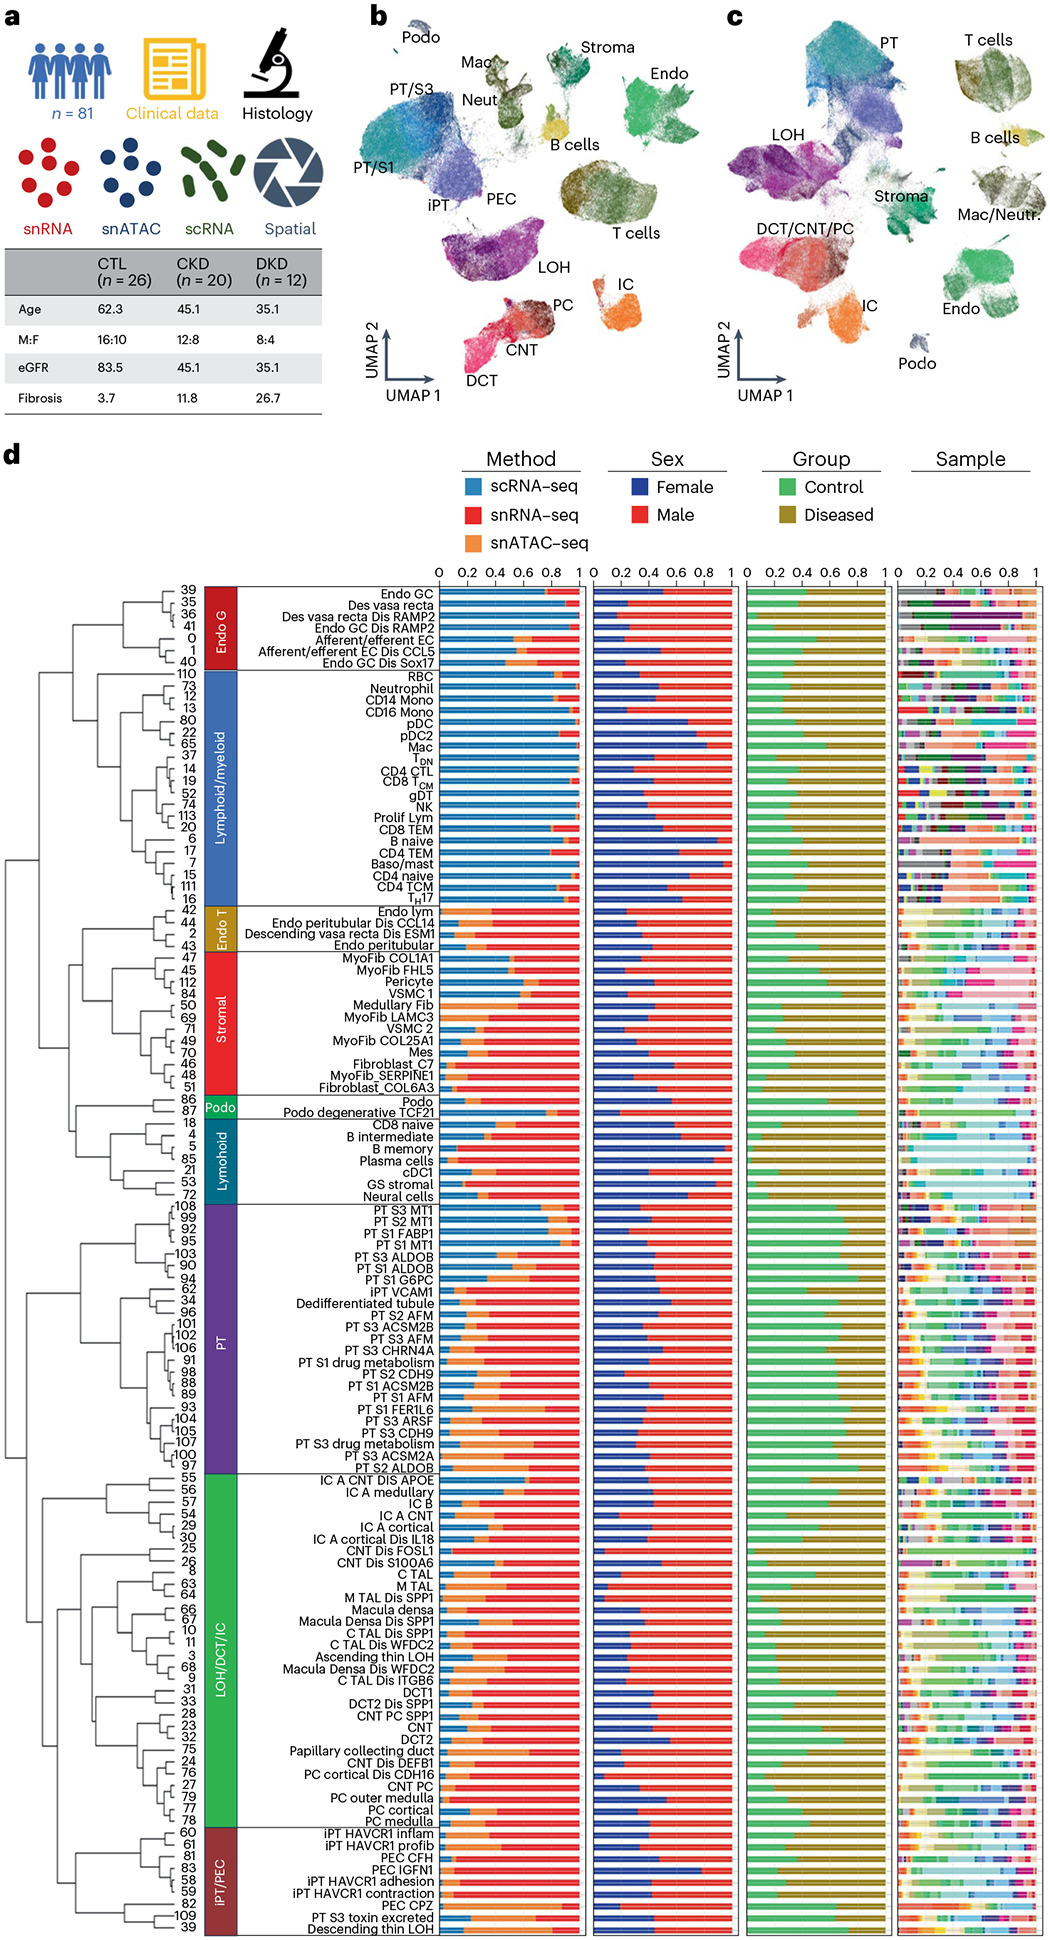
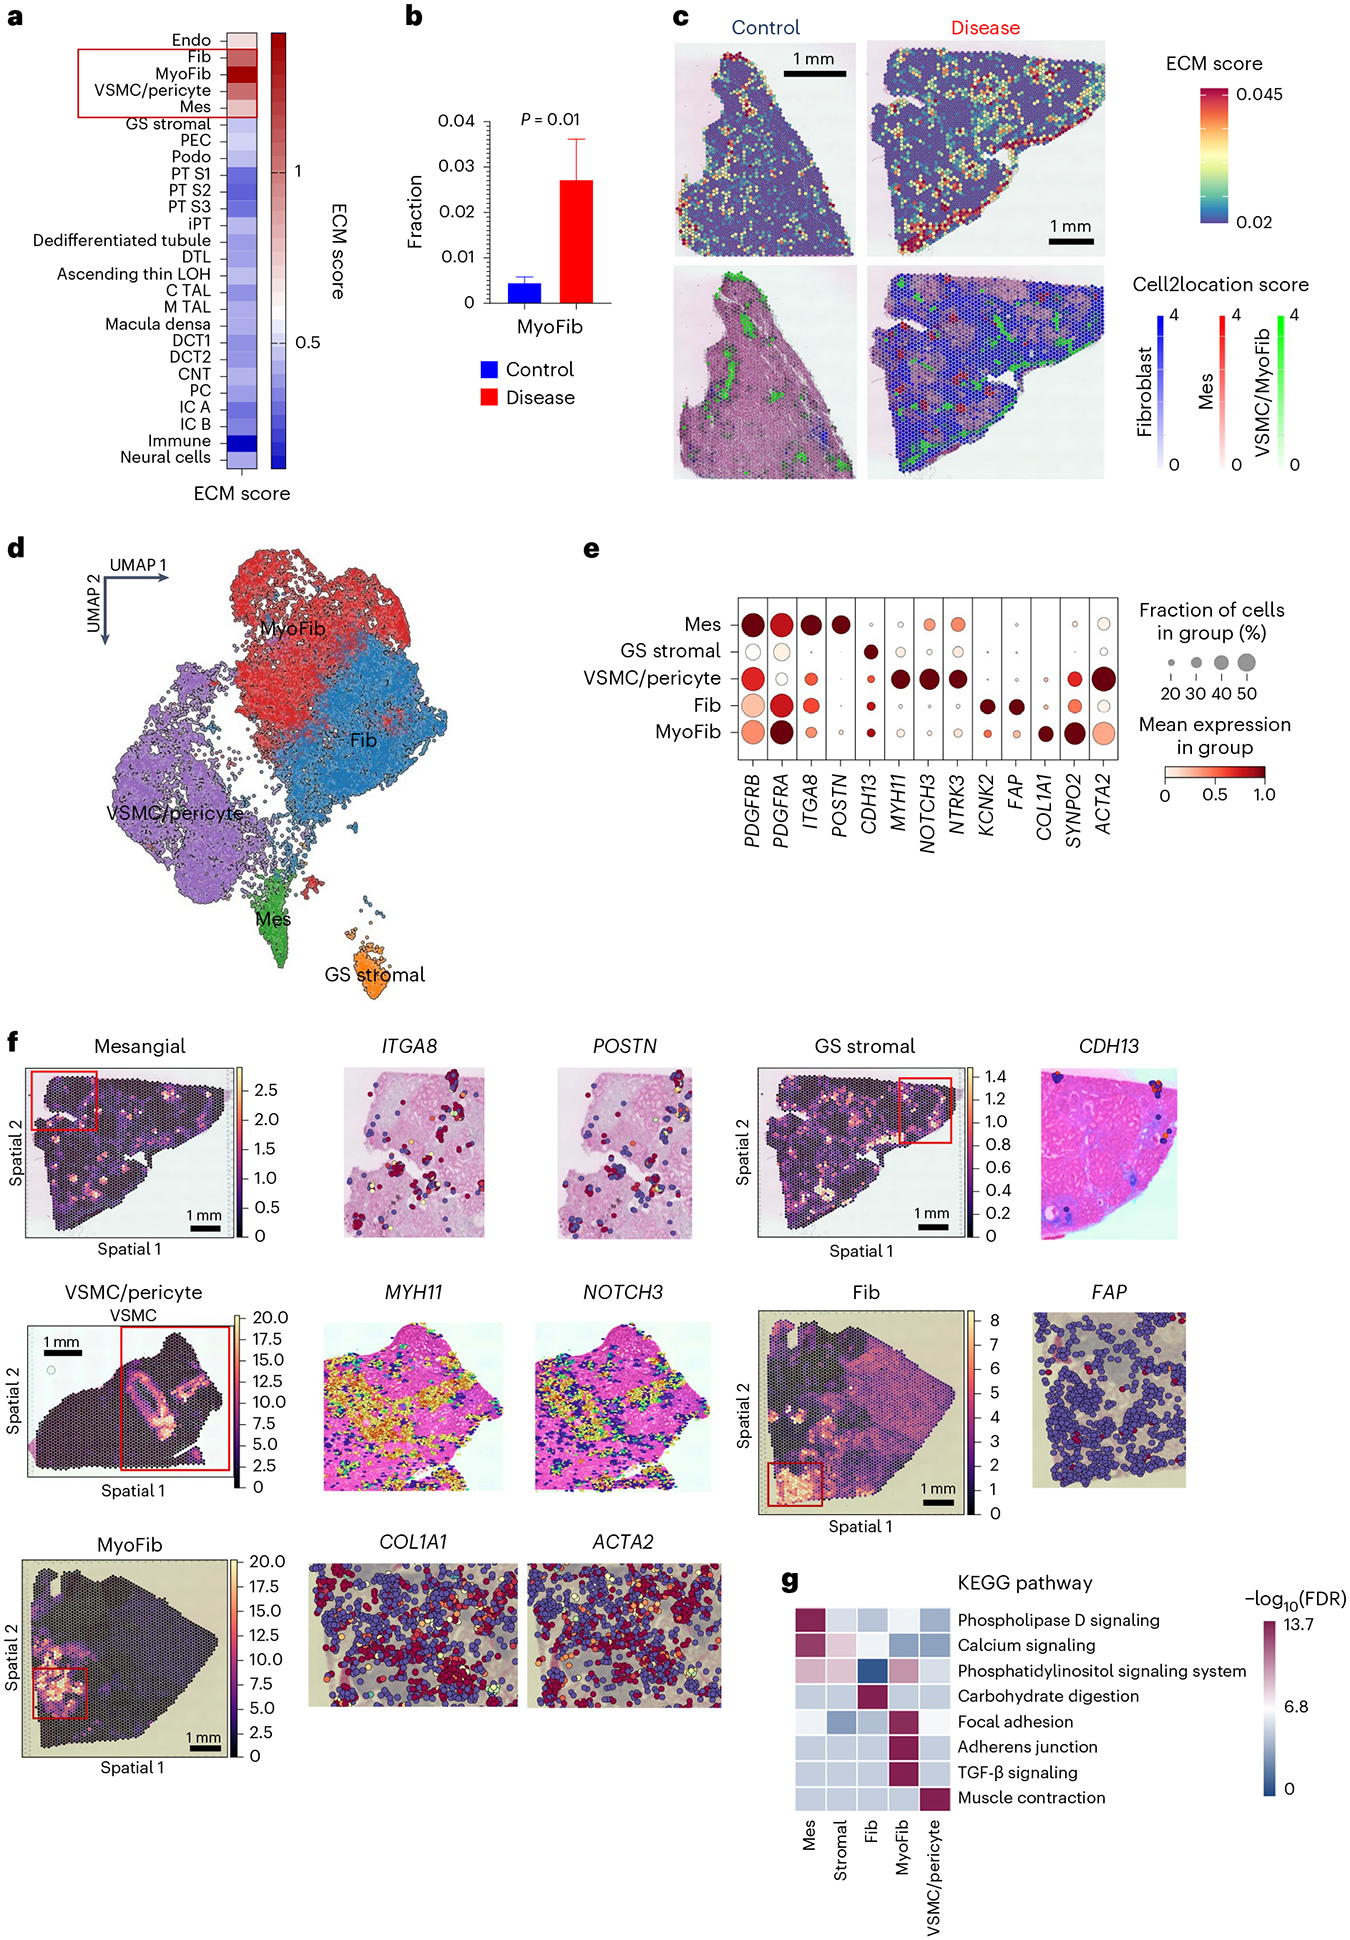
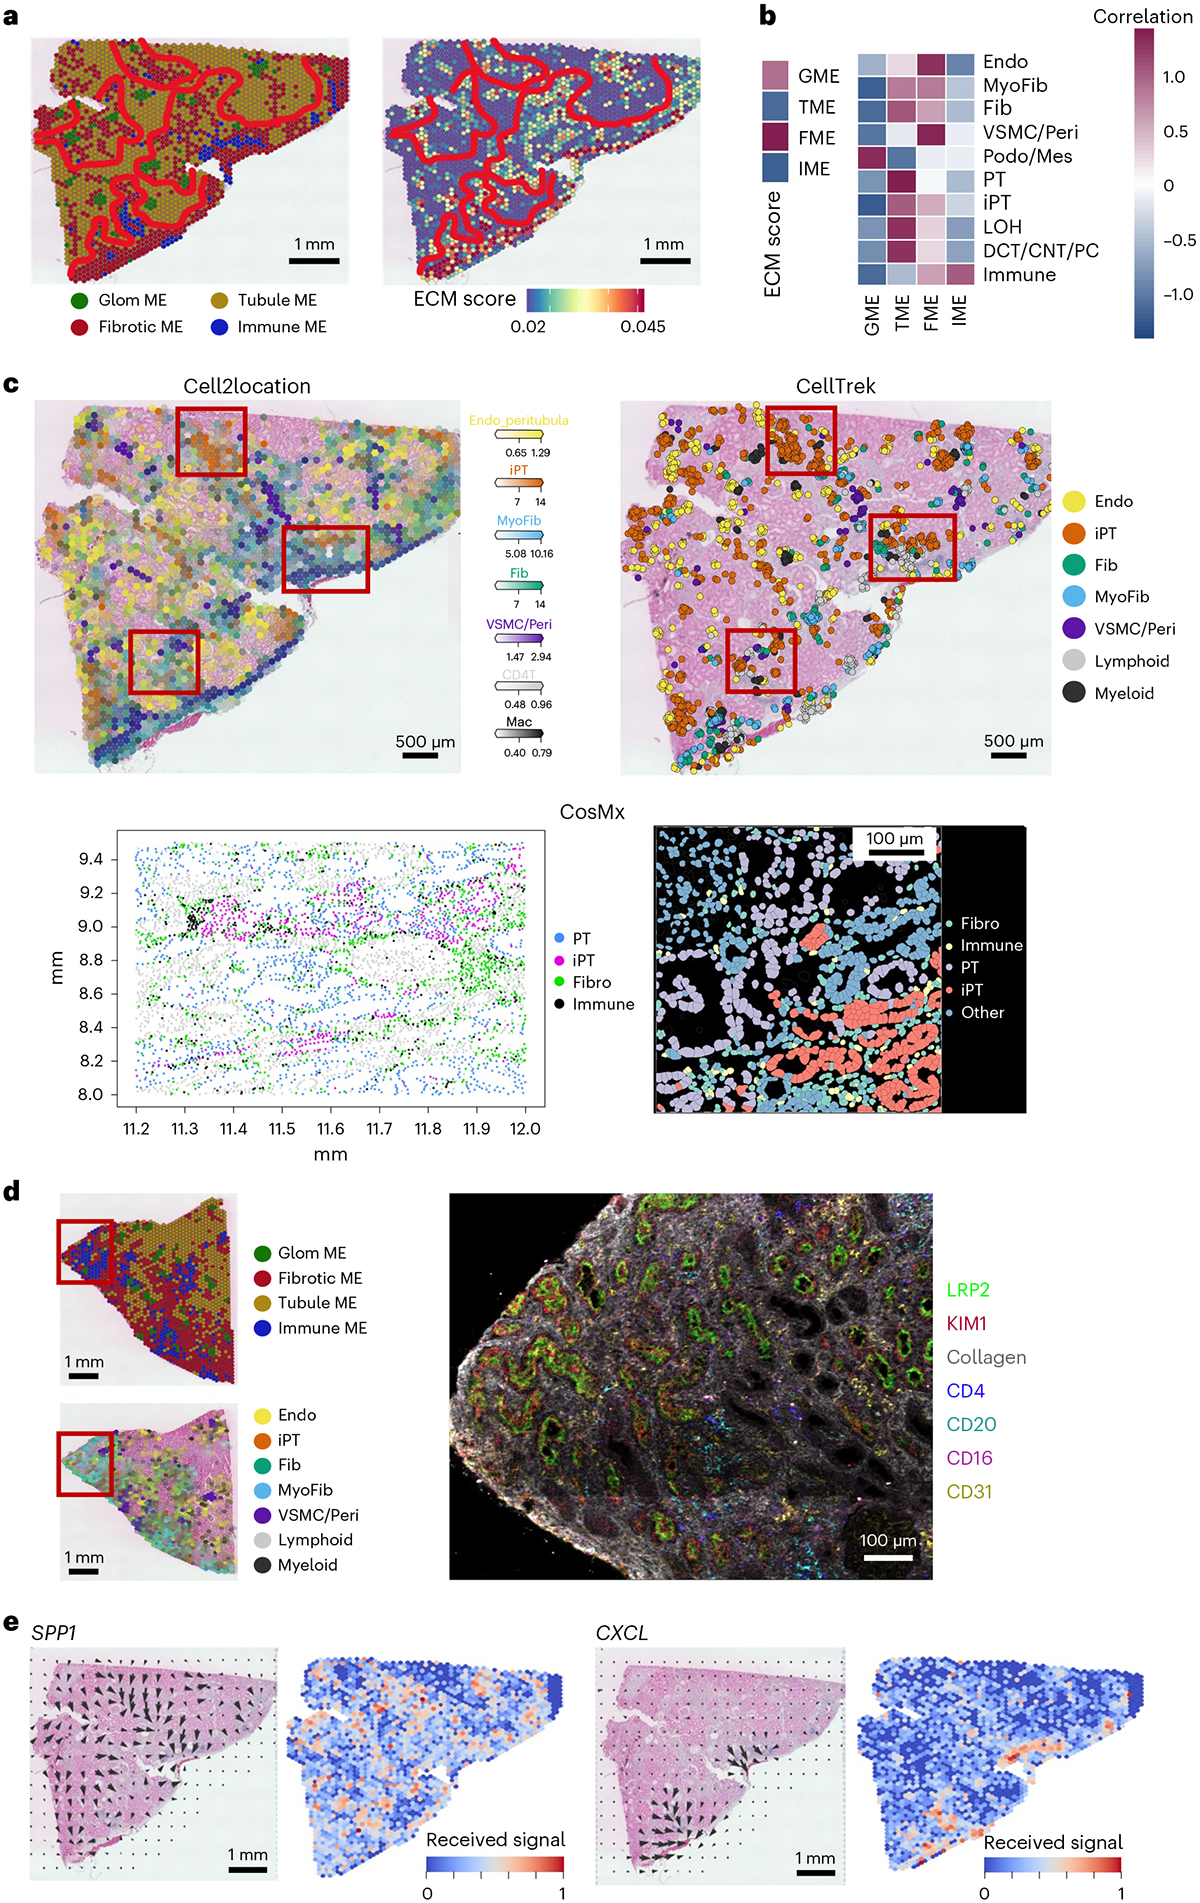
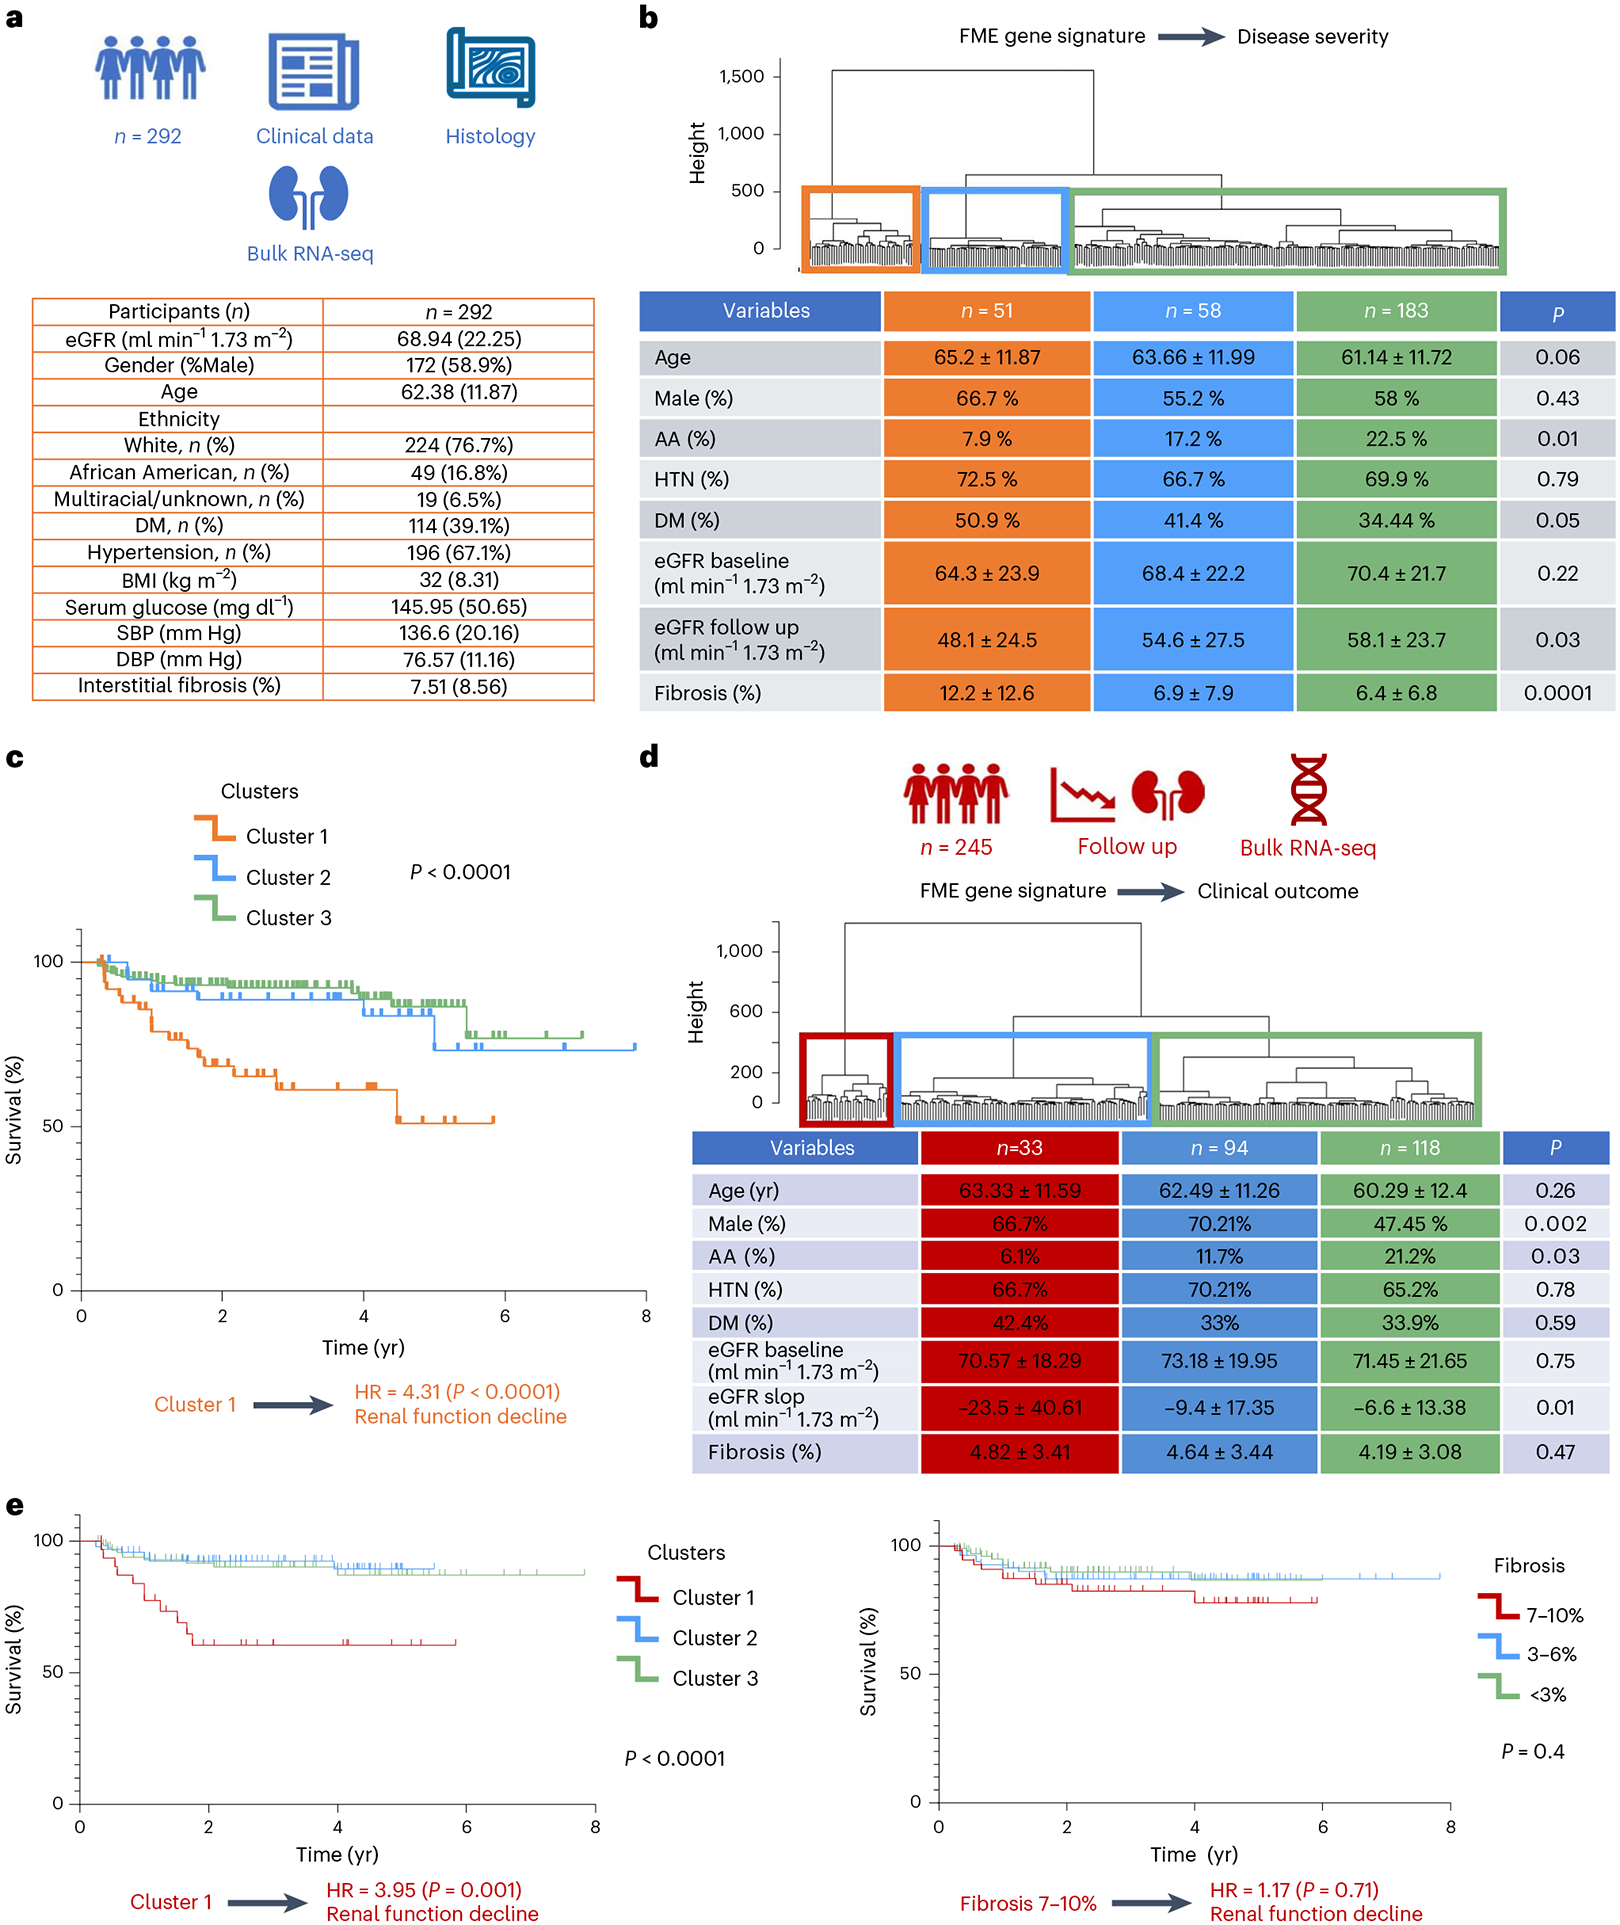
Kidneys are intricate three-dimensional structures in the body, yet the spatial and molecular principles of kidney health and disease remain inadequately understood. We generated high-quality datasets for 81 samples, including single-cell, single-nuclear, spot-level (Visium) and single-cell resolution (CosMx) spatial-RNA expression and single-nuclear open chromatin, capturing cells from healthy, diabetic and hypertensive diseased human kidneys. Combining these data, we identify cell types and map them to their locations within the tissue. Unbiased deconvolution of the spatial data identifies the following four distinct microenvironments: glomerular, immune, tubule and fibrotic. We describe the complex organization of microenvironments in health and disease and find that the fibrotic microenvironment is able to molecularly classify human kidneys and offers an improved prognosis compared to traditional histopathology. We provide a comprehensive spatially resolved molecular roadmap of the human kidney and the fibrotic process, demonstrating the clinical utility of spatial transcriptomics.


Conflict of interest statement

Competing interests

K.D. and L.M. are employees of Regeneron Pharmaceuticals. G.P., T.B., E.H. and L.S.B. are employees of GSK. S.P., C.M.B. and P.G. are employees of Boehringer Ingelheim. A.K. is an employee of Novo Nordisk. The remaining authors declare no competing interests.

Figures

Extended Data Fig. 1 |
Extended Data Fig. 1 |. Multimodal single-cell atlas.
(a) UMAP of snRNA-seq, scRNA-seq and snATAC-seq datasets before integration. (b) UMAP of integrated snRNA-seq, scRNA-seq and snATAC-seq datasets of 338,565 cells and nuclei using the SCVI tool. (c) Annotations of cell types on integrated UMAP. (d) The dot plots of marker genes used to annotate 44 main cell types in the integrated dataset. The size of the dot indicates the percent of positive cells, and the darkness of the color indicates average expression.
Extended Data Fig. 2 |
Extended Data Fig. 2 |. Integrations of snRNA-seq, scRNA-seq and snATAC-seq datasets from multiple sources.
(a) UMAP of integrated snRNA-seq, scRNA-seq and snATAC-seq datasets (n = 588,425 cells and nuclei) from Susztak Lab and KPMP using the SCVI tool. Left, the new annotation after integration of the dataset. Right, the original annotation used by KPMP. (b) Bar charts showing cell abundance in each cell cluster (Method, Lab, present study annotation and KPMP annotation).
Extended Data Fig. 3 |
Extended Data Fig. 3 |. CosMx cell populations.
(a) Original UMAP of all cells that passed QC along with their annotations. (b) Cell populations with annotatable markers of the CosMx data on UMAP. (c) UMAP of all CosMx cells by sample. (d) CosMx cell annotations across the UMAP with a single population being shown for a given UMAP demonstrating that these clusters are indeed relatively localized within the UMAP. (e) Dot plot showing markers for each annotated CosMx population. (f) Annotation frequency for each cell type.
Extended Data Fig. 4 |
Extended Data Fig. 4 |. CosMx SCVI integration with snRNA-seq data.
After integrating with the snRNA-seq data, we compared annotations from our CosMx analysis and the original snRNA-seq annotation. (a) UMAP of integrated data demonstrating the technology type of each cell within the UMAP. (b) Comparison of CosMx annotations and snRNA-seq annotations, demonstrating concordance of location within the integrated UMAP.
Extended Data Fig. 5 |
Extended Data Fig. 5 |. Location of CosMx annotated cell types within the slide.
(a) Location of annotated cell types within the two tissue sections. (b) Location of glomerular cell subtypes. (c) Location of iPT, fibroblasts and immune cells.
Extended Data Fig. 6 |
Extended Data Fig. 6 |. Microanatomy of the CosMx slide.
(a) Location of glomerular cell types within a subsection of tissue and in a single field of view (right). (b) Location of injured thick ascending limb, healthy injured thick ascending limb, principal cells and immune cell types within a subsection of tissue and in a single field of view (right). (c) Location of distal nephron cell subtypes within a subsection of tissue and in a single field of view (right). (d) Single field of view showing many cell types.
Extended Data Fig. 7 |
Extended Data Fig. 7 |. Neighborhood characteristics of CosMx slide.
(a) Relative type cell frequency between each sample. Orange indicates HK3039 (healthy), and blue indicates HK2844 (diseased). Right, frequency of neighbor annotations for each cell type for a 20-micron neighborhood. (b) Neighborhood enrichment by permuting annotations for the 20-micron neighborhood size. Lighter color indicates higher enrichment and colocalization of a given population. (c) Dot plots for iPT, PEC, podocytes and PT cells expression of iPT and PEC markers across genomics modalities and protein staining of VCAM1 in PECs from the Human Protein Atlas: https://www.proteinatlas.org/.
Extended Data Fig. 8 |
Extended Data Fig. 8 |. Cell–cell interaction analysis in the spRNA-seq dataset in fibrotic microenvironment.
(a) Weighted total interaction strength of the CXCL, SPP1, TGFβ and PDGF pathways in control and diseased samples in the fibrotic microenvironment (left). The spatial location of the identified cell–cell communications pathways (CXCL, SPP1, TGFβ and PDGF) in control and diseased sample in the fibrotic microenvironment (right). The arrows indicate the source and targets of the identified pathways. (b) Expression of CD34 and CDH5 as the markers of high endothelial venules (HEVs) in the fibrotic microenvironments. Scale bar is 1 mm in length. (c) Volcano plot of differentially expressed genes from CosMx data. Cells with an immune neighbor within 20 microns were compared against cells without an immune neighbor for both the PT and iPT population. log(fold change) >0 indicates increased expression in cells with an immune neighbor, while log(fold change) <0 indicates increased expression in cells without an immune neighbor. log10(p value) is indicated by the y axis. Genes with an adjusted p-value < 0.01 are marked in orange. (d) The dot plot of expression of ligands and receptors in regions of FME in integrated snRNA-seq/scRNA-seq and snATAC-seq data. The size of the dot indicates the percent positive cells and the darkness of the color indicates average expression (right). The gray indicates control, and the red indicates diseased group.
Extended Data Fig. 9 |
Extended Data Fig. 9 |. Spatial characteristics of injured PT subclusters on CosMx.
(a) The CosMx iPT population for each sample was subclustered using a Leiden algorithm with a resolution of 0.3. (b) The top 10 differentially expressed genes for each subcluster. (c) iPT subcluster localization within the entire slide. Views of specific regions indicated by inset boxes are shown in Supplementary Fig. 9d. (d) iPT subclusters visualized on H&E. Subset images showing populations on H&E. Blue cells correspond with cluster 0 (iPT_APOE), orange with cluster 1 (iPT_SPP1) and green with cluster 2 (iPT_KRT7). (e) Frequency of immune and fibroblast neighbors for each iPT subtype within each sample within 20 microns is shown below. We performed testing using a Wilcoxon rank-sum test between each population within a sample. These subtypes had significantly different immune neighbors and fibroblast neighbors with each sample. HK3039 fibroblasts: iPT_APOE vs iPT_SPP1, p-value = 7E-39. HK3039 immune cells: iPT_APOE vs iPT_SPP1, p-value = 4E-67. HK2844 fibroblasts iPT_APOE vs iPT_SPP1, p-value = 9E-9, iPT_KRT7 vs iPT_SPP1, p-value = 9E-46. HK2844 immune cells iPT_APOE vs iPT_SPP1, p-value = 3E-16, iPT_KRT7 vs iPT_SPP1, p-value = 9E-11. (f) iPT subcluster neighborhood enrichment within a 20-micron neighborhood size. Lighter color indicates higher enrichment and colocalization of a given population.
Extended Data Fig. 10 |
Extended Data Fig. 10 |. FME gene expression predicts kidney outcomes.
(a) Hierarchical clustering of 245 human kidney tubule samples based on the expression of 1,100 randomly picked genes. (b) Kaplan–Meier analysis with log-rank test was used to compare the survival of the 3 different clusters. Renal survival was defined as cases reaching end-stage renal disease or greater than 40% eGFR decline. (c) Single-cell expression enrichment of genes associated with eGFR decline. The heatmap shows the cell-type enrichment of genes associated with eGFR decline (red indicates more genes with cell-type expression). Endo, endothelial cells; Stroma, stromal cells; PEC, parietal epithelial cells; Podo, podocyte; PT, proximal tubule cells; LOH, loop of Henle; DCT, distal convoluted tubule; CNT, connecting tubule; PC, principal cells of collecting duct; IC_A, type alpha intercalated cells. Spatial expression and microenvironment enrichment of genes associated with eGFR decline. GME, glomerular; TME, tubule; FME, fibrosis; IME, immune microenvironment. (d) Using the LASSO regression of all FME genes against eGFR, Kaplan–Meier analysis was re-performed using clustering of subsets of gene—those with a LASSO coefficient that is nonzero and the genes with the most negative coefficients (Supplementary Table 13).
Fig. 1 |
Fig. 1 |. Comprehensive integrated multimodal human kidney single-cell atlas.
a, Overview of the multimodal analysis. Basic clinical characteristics of the samples. b, UMAP of 338,565 cells/nuclei in an integrated human kidney snRNA-seq/scRNA-seq and snATAC–seq data generated in this study. Annotated cell types are indicated on the plot. c, UMAP of 588,425 integrated human kidney snRNA-seq/scRNA-seq and snATAC–seq data from the present study and KPMP. d, Hierarchical subclustering identified 114 distinct cell types or cell states. The bar charts depict the relative abundance of each group (method, sex, group and samples) contributing to the cluster. Endo_G, endothelial cells of glomerular capillary tuft; Endo_peritubular, endothelial cells of peritubular vessels; Endo_lymphatic, endothelial cells of lymphatic vessels; Mes, mesangial cells; GS_stromal, glomerulosclerosis-specific stromal cells; Podo, podocyte; DTL, descending thin loop of Henle; NK, natural killer cells; TDN, double-negative T cells; Prolif_lym, proliferative lymphocyte; gDT, γδ T cells; B_naive, naive B lymphocyte; B_memory, memory B lymphocyte; RBC, red blood cells; Baso/mast, basophil or mast cells; pDC, plasmacytoid dendritic cells; cDC, classical dendritic cells; Mac, macrophage; CD14_Mono, monocyte CD14+; CD16_Mono, monocyte CD16+; CTL, control.
Fig. 2 |
Fig. 2 |. Spatially resolved human kidneys.
a, SP data were generated from human FFPE kidney samples using two platforms. Top, Visium uses a spot-based approach with each spot of 55 μm, with the ability to detect >18,000 genes and requires deconvolution to identify the presence of individual cell types. Bottom, CosMx imaging generates single-cell-level data and identifies 1000 genes, which permits annotation of cell types based on the expression patterns of these genes. b, Spatial location and marker gene expression of identified cell types using both Visium and CosMx. H&E sections shown on the left of the figure show individual tissue histology of our Visium sections. Using our calculated Cell2Location scores for each of these tissues, we imputed the presence of cell types on each of these sections with cell-type scores shown in blue overlaying the H&E. We identify glomerular cell types, PT cell types, immune and fibrotic cell types, distal tubular cell types and loop of Henle cell types. To the right of these images, we validated the location of these cell types using the CosMx assay, which allows for individual cell-type annotations that are overlayed on the H&E image of the assayed tissue. All Visium and CosMx samples run are listed in Supplemental Table 1. Endo_GC, endothelial cells of glomerular capillary tuft; GS_stromal, glomerulosclerosis-specific stromal cells; Myo_VSMC, myofibroblast/vascular smooth muscle cells; ATL, ascending thin limb of loop of Henle.
Fig. 3 |
Fig. 3 |. Human kidney stromal cell atlas.
a, ECM gene-expression score in different kidney cell types in the integrated snRNA-seq/scRNA-seq and snATAC– seq. ECM score was calculated based on the expression of collagen, proteoglycan and glycoprotein genes. b, The fraction of myofibroblasts in control and CKD samples. The bars indicate s.e.m. Independent t test was used to compare the fractions between two groups. Each cell was treated as an independent observation, n = 11,169. c, Top, the ECM score in the SP datasets of healthy and CKD samples. Red indicates higher ECM gene expression. Bottom, the location of mesangial cells, fibroblasts, myofibroblasts and VSCMC/pericytes in healthy and CKD samples based on their Cell2Location score. d, UMAP representation of subclustering of 32,706 stromal cells in the integrated dataset from the present study and KPMP. e, The dot plots of marker genes used for stromal cell-type annotation in the integrated dataset. The size of the dot indicates the percent of positive cells, and the darkness of the color indicates average expression. f, The spatial location and stromal cell subtypes and specific marker genes. Left, the relative abundance of each cell type using Cell2location. Right, relative gene expression using CellTrek (red higher). g, The heatmap indicates the −log10(FDR) enrichment of the top KEGG pathways in each stromal cell type. Mes, mesangial cells; GS_stromal, glomerulosclerosis-specific stromal cells; Fib; fibroblast; MyoFib, myofibroblast.
Fig. 4 |
Fig. 4 |. Human kidney FME.
a, Human kidney MEs defined by NMF of the spRNA-seq. Briefly, NMF categorized spots into four groups, which were manually interrogated and found to correspond with glomerular (bright green), tubule (brownish green), fibrotic (red) and immune (blue) signatures. The spatial distribution of the calculated ECM score (right). Red indicates higher ECM gene expression. b, Correlation of ME with ECM score (left) and cell-type correlation with each ME (right). c, Cell2location (left) and Celltrek (right) cell-type imputations of the Visium spatial data and CosMx (below) annotations (below) showing the location of different cell types in the FME in a diseased kidney sample. CosMx annotations of iPT, PT, fibroblasts and immune cells are shown at two different magnifications. d, IMC imaging of CKD kidney (from e) labeled with LRP2 (PT) KIM1 (iPT), CD4 (T cell) CD20 (B cell), CD16 (myeloid) and CD31 (Endo) in a fibrotic human kidney sample. e, The spatial location of the identified cell–cell interaction pathway (SPP1 and CXCL). The arrows indicate the source and targets of the identified pathways, and the color indicates the received signals (red higher). The results were obtained using the COMMOT package. GME, glomerular microenvironment; TME, tubular microenvironment; IME, immune microenvironment; LOH, loop of Henle.
Fig. 5 |
Fig. 5 |. iPT cells in diseased human kidneys.
a, Localization of iPT and PT cells within control and diseased samples in the human kidney. b, Heatmap of the number of genes correlated with eGFR and renal fibrosis in each cell type. The red shows a higher number of genes, and the blue indicates a lower number of genes. c, Heatmap of cell type fraction changes between disease and control samples; PT and immune cells have the highest fraction differences between disease and control samples. d, The fractions of PT and iPT in control and diseased sample types in the integrated snRNA-seq/scRNA-seq and snATAC–seq dataset. Bar indicated the s.e.m. For the comparison between the two groups, two-sided t-test was used. Each cell was treated as an independent observation, n = 74,326 for PT and 24,595 for iPT. P values for comparison between PT and iPT are P < 0.0001 and P = 0.08, respectively. e, CosMx SP shows that annotation of iPT and PECs localize to tubules and glomeruli, respectively. f, Gene co-expression network analysis of human kidney spRNA-seq data indicates two modules expressing VCAM1 or HAVCR1. Right, the spatial location of VCAM1+ and HAVCR1 (KIM1)+ injured PT cells. The color indicates gene expression of iPT modules (red higher expression). g, Subclustering of iPT cells from the integrated atlas. The fraction of VCAM1+ or HAVCR1+ iPT cells in control and diseased kidneys is shown on UMAP and quantified in frequency. The dot plots show the expression marker genes in iPT and PT cells. h, Cell trajectory analysis (Monocle) representation of PT and iPT cells (top). The heatmap shows the differentially expressed genes along the trajectory, with cells ordered by pseudotime. Red indicates higher expression. i, Subclustering of iPT within the CosMx data shows three subtypes of iPT. These iPT subtypes have different neighboring cells (within a 50-micron radius), with iPT_KRT7 having the most frequent fibroblast and immune neighbors within our diseased sample (P = 1 × 10−177 for fibroblasts and P = 1 × 10⁻¹⁷ for immune cells, respectively, within our disease sample by Wilcoxon rank-sum test). iPT_APOE had fewer immune (P ≤ 1 × 10−310 for HK3039 and P < 1 × 10−310 for HK2844) and fibroblast neighbors than the iPT_SPP1 subtype. (P = 5 × 10−52 for HK3039 and P = 1 × 10−52 HK2844).
Fig. 6 |
Fig. 6 |. FME-GS successfully predicts disease prognosis in a large cohort of human kidney samples.
a, Clinical characteristics of 292 human kidney tubule RNA samples. b, Unbiased cluster dendrogram of 292 human kidney tubule bulk RNA-seq samples based on FME-GS. Clinical characteristics of each cluster. Chi-square test for categorical variables and one-way ANOVA for continuous variables were used to compare groups. c, Unbiased cluster dendrogram of 245 human kidney tubule bulk RNA-seq samples with fibrosis <10% based on the expression of FME genes. Clinical characteristics of each cluster are shown in the table. Chi-square test for categorical variables and one-way ANOVA for continuous variables were used to compare groups. Kaplan–Meier analysis of 292 kidney samples based on FME gene signature. d, Unbiased cluster dendrogram of 245 human kidney tubule bulk RNA-seq samples with fibrosis. e, Kaplan–Meier analysis of 245 kidney samples based on FME-GS (left). Kaplan–Meier analysis of 245 kidney samples based on pathologist-defined kidney fibrosis degree (<3%, 3–6% or 7–10% as defined by an expert pathologist) (right). Renal survival was defined as cases reaching end-stage renal disease (eGFR of 15 ml min−1 1.73 m−2) or greater than 40% eGFR decline. The log-rank test was used to determine the P value using the survival R package. HTN, hypertension; DM: diabetes; AA, African American; SBP, systolic blood pressure; DBP, diastolic blood pressure.

References

    1. Gueutin V, Deray G & Isnard-Bagnis C Renal physiology. Bull. Cancer 99, 237–249 (2012). - PubMed
    1. Smith HW The fate of sodium and water in the renal tubules. Bull. N. Y. Acad. Med 35, 293 (1959). - PMC - PubMed
    1. Vart P et al. National trends in the prevalence of chronic kidney disease among racial/ethnic and socioeconomic status groups, 1988–2016. JAMA Netw. Open 3, e207932 (2020). - PMC - PubMed
    1. Yinusa A, Faezipour M & Faezipour M A study on CKD progression and health disparities using system dynamics modeling. Healthcare 10, 1628 (2022). - PMC - PubMed
    1. Kakitapalli Y, Ampolu J, Madasu SD & Kumar MS Detailed review of chronic kidney disease. Kidney Dis 6, 85–91 (2020). - PMC - PubMed

Grants and funding