. 2024 Aug;632(8024):401-410.
doi: 10.1038/s41586-024-07716-2. Epub 2024 Jul 24.

A human autoimmune organoid model reveals IL-7 function in coeliac disease

Affiliations

A human autoimmune organoid model reveals IL-7 function in coeliac disease

António J M Santos et al. Nature. 2024 Aug.

Abstract

In vitro models of autoimmunity are constrained by an inability to culture affected epithelium alongside the complex tissue-resident immune microenvironment. Coeliac disease (CeD) is an autoimmune disease in which dietary gluten-derived peptides bind to the major histocompatibility complex (MHC) class II human leukocyte antigen molecules (HLA)-DQ2 or HLA-DQ8 to initiate immune-mediated duodenal mucosal injury1-4. Here, we generated air-liquid interface (ALI) duodenal organoids from intact fragments of endoscopic biopsies that preserve epithelium alongside native mesenchyme and tissue-resident immune cells as a unit without requiring reconstitution. The immune diversity of ALI organoids spanned T cells, B and plasma cells, natural killer (NK) cells and myeloid cells, with extensive T-cell and B-cell receptor repertoires. HLA-DQ2.5-restricted gluten peptides selectively instigated epithelial destruction in HLA-DQ2.5-expressing organoids derived from CeD patients, and this was antagonized by blocking MHC-II or NKG2C/D. Gluten epitopes stimulated a CeD organoid immune network response in lymphoid and myeloid subsets alongside anti-transglutaminase 2 (TG2) autoantibody production. Functional studies in CeD organoids revealed that interleukin-7 (IL-7) is a gluten-inducible pathogenic modulator that regulates CD8+ T-cell NKG2C/D expression and is necessary and sufficient for epithelial destruction. Furthermore, endogenous IL-7 was markedly upregulated in patient biopsies from active CeD compared with remission disease from gluten-free diets, predominantly in lamina propria mesenchyme. By preserving the epithelium alongside diverse immune populations, this human in vitro CeD model recapitulates gluten-dependent pathology, enables mechanistic investigation and establishes a proof of principle for the organoid modelling of autoimmunity.


Conflict of interest statement

Competing interests

C.J.K. and A.J.M.S. are inventors on patent WO 2020/247528 describing methods and uses of patient-derived celiac intestinal organoids. C.J.K. and M.M.D. are founders of Mozart Therapeutics and NextVivo, Inc. L.M.S has been a consultant during the last 3 years for BMS, GSK, Mozart Therapeutics, Ono Pharmaceutical, Precigen ActoBio, Sanofi-Aventis, SQZ Biotech, Takeda and Topas Therapeutics. All other authors declare no competing interests.

Figures

Extended Data Fig. 1.
Extended Data Fig. 1.. Small intestine ALI organoids possess different mesenchymal and epithelial cell types.
a, IF whole-mount staining of small intestine organoids at day 14 showing SMA+ or PDGFRA+ fibroblasts, CD31+ endothelial cells and PGP9.5+ neurons (green), ECAD+ epithelium (white) and DAPI (blue) (representative images from N=3 biological replicates). b, IF whole-mount staining of small intestine organoids at day 14 showing MUC2+ goblet cells, CHGA+ enteroendocrine cells, LYZ1+ Paneth cells (green), ECAD+ epithelium (white) and DAPI (blue) (representative images from N=3 biological replicates). c, Enlargement of organoid cup-shaped MUC2+ goblet cells (representative image from N=3 biological replicates). d, Violin plots of CD14 and CD68 mRNA expression from CeD organoid scRNA-seq and a scatter plot of CD14 and CD68 mRNA co-expression in the myeloid compartment. e, Whole-mount IF staining of small intestine ALI organoid CD4+ (green) and CD8+ (red) T cells, showing enrichment of CD8+ T cells within the EPCAM+ epithelial compartment (white). DAPI (blue). In contrast, CD4+ T cells localize to non-epithelial lamina propria-like areas (representative image from N=3 biological replicates). All scale bars are 100 μm, except (c) in which the scale bar is 50 μm.
Extended Data Fig. 2.
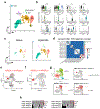
Extended Data Fig. 2.. Duodenal ALI organoids contain diverse immune populations, related to Figure 1.
a, Integrated UMAP plot of CD45+-sorted cells from scRNA-seq, revealing diverse immune populations in small intestine ALI organoids at day 14, N=6 CeD patients. b, Violin plots showing expression of genes used to identify the immune populations shown in (a). c, UMAP plots of overlap between tissue and organoid CD45+ immune populations as in (a, b). d, scRNA-seq Jaccard index of TCR overlap between fresh small intestine tissue (N=1 CeD patient) and ALI organoids (N=4 CeD patients). e, Integrated UMAP from scRNA-seq of active CeD organoid T cells (N=6 patients). Cells expressing KIR3DL1 or KIR2DL3 are rendered in red. f, Plot of CD8+ T cells from (e). g, Integrated UMAP from scRNA-seq of active CeD organoid T cells (top left) (N=6 patients). Cells in red exhibit expression of KIR3DL1 or KIR2DL3 (top right), NKG2C (bottom left) and NKG2D (bottom right). h, Pie bar graph showing organoid-derived TCR counts in which each segment represents a unique clonotype, N=5 patients. Expanded clonotypes (TCR counts ≥ 2) are indicated in red.
Extended Data Fig. 3.
Extended Data Fig. 3.. Cytokine supplementation and cryopreservation of intestinal ALI organoids.
a, FACS-based tSNE plots depicting time course abundance of EPCAM+ and CD45+ cells (top) and CD4+ and CD8+ T cells (bottom) as a percentage of total live single ileal organoid cells with or without addition of IL-2 and IL-7, representative experiment of N=3 biological replicates. b, Organoids grown for 14 days (control) have similar percentages of epithelium and immune components as organoids grown for 5 days, frozen at −80°C during 24h and cryorecovered and replated for the indicated durations. c-d, ALI organoids demonstrate persistent growth after being frozen in-gel at −80°C, cryorecovered and replated (c, arrows), with maintenance of epithelial protrusions by H&E (d). Numerous air bubbles in the collagen are present on initial plating post-cryorecovery and progressively disappear with culture. (b-d) depict representative experiments from N=4 biological replicates. Scale bar is 5 mm for (c) and 100 μm for (d).
Extended Data Fig. 4.
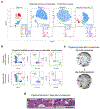
Extended Data Fig. 4.. Gliadin induces loss of villus-like structures in CeD organoids.
a, Duodenal ALI organoids from celiac (CeD) or non-celiac control donors were established for 9-12 days followed by gliadin or CLIP treatment for 2 days before analysis, unless stated otherwise. The gliadin peptides were a 1:1 mixture of deamidated immunodominant, HLA-DQ2.5-restricted, glia-α1 (LQPFPQPELPYPGS) and glia-α2 (APQPELPYPQPGS) gluten epitopes. b-d, Confirmatory IF staining of sections of human duodenum tissue showing IL-15 (red) in (a), SI (red) in (b) and APOA4 (red) in (c); DAPI (blue) (representative images from N=3 biological replicates). e, Quantification of SI mRNA in FACS-sorted organoid EPCAM+ cells from 2-day gliadin-treated control or active CeD organoids. RT-qPCR, expressed as a ratio of gliadin:CLIP treatment, from control (N=4) or CeD (N=5) biological replicates. Box plots show the median as the center line, the interquartile range as the box limits and the whiskers represent the min and max. *, P=0.0381; two-tailed Mann-Whitney test. f, Representative H&E staining of different sections of control or active CeD organoids after 2-day gliadin or CLIP treatment. Arrows denote regions where epithelial protrusions are absent. Scale bar is 100 μm. g, Quantification of epithelial protrusions per organoid circumference from (f); control (N=6 biological replicates), CeD (N=7 biological replicates), each data point is from an individual organoid. Scatter plots show the median as the center line and the whiskers represent the min and max. ***=P <0.0001; two-tailed Mann-Whitney test. All scale bars are 100 μm. All CeD organoids were DQ2.5+.
Extended Data Fig. 5.
Extended Data Fig. 5.. Gliadin induces epithelial proliferation in CeD organoids.
a, Representative IF staining of sections of active CeD organoids after 2-day gliadin or CLIP treatment in EN media showing proliferative KI67+ cells (green), ECAD (red) and DAPI (blue). Scale bar is 50 μm. b, Quantification of KI67 fluorescence from (a), control (N=3 biological replicates), CeD (N=5 biological replicates); each data point is from an individual organoid. ***, P<0.0001; two-tailed Mann-Whitney test. c, Representative brightfield images of active CeD organoids before and after 2-day treatment with gliadin or CLIP peptides. Scale bar is 5 mm. d, Automated quantification of fold change in CeD organoid area from (c), 2 days after treatment with gliadin or CLIP. N=10 CeD patients. **, P=0.002; two-tailed Wilcoxon test. e, LGR5 RT-qPCR from FACS-sorted organoid EPCAM+ cells as ratio of gliadin:CLIP treatment for 2 days in organoids from control (N=7 biological replicates) or active CeD (N=8 biological replicates). **, P=0.0012; two-tailed Mann-Whitney test. f, PCNA RT-qPCR from FACS-sorted organoid EPCAM+ cells as ratio of gliadin:CLIP treatment for 2 days in control or active CeD organoids, (N=7 biological replicates each). **, P=0.007; two-tailed Mann-Whitney test. g, CCND1 RT-qPCR from FACS-sorted organoid EPCAM+ cells as ratio of gliadin:CLIP treatment for 2 days in organoids from control (N=8 biological replicates) or active CeD (N=7 biological replicates). ***, P=0.0003; two-tailed Mann-Whitney test. All box plots show the median as the center line, the interquartile range as the box limits and the whiskers represent the min and max. All CeD organoids were DQ2.5+.
Extended Data Fig. 6.
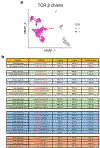
Extended Data Fig. 6.. TCR sequencing from CeD organoid scRNA-seq reveals known and suspected gliadin-specific TCR motifs.
a, scRNA-seq integrated UMAP plot highlighting TCR-expressing T cells in active CeD organoids at day 14, N=5 CeD patients. b, GLIPH homology analysis showing conserved CDR3 motifs (red) found between active CeD organoids and gliadin-specific published sequences, N=5 CeD patients.
Extended Data Fig. 7.
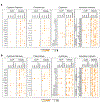
Extended Data Fig. 7.. Two additional biological replicates of scRNA-seq-derived dot plots.
Dot plots from organoid scRNA-seq from two active CeD patients (a, b); a third patient is shown in Fig. 4a. Depiction of mean expression levels and corresponding percent population expression amongst active CeD organoid CD4+ and CD8+ T cells, Treg, plasma B cells and myeloid cells after 2-day gliadin or CLIP treatment. The patient in (a) is HLA-DQ2.5, as is the patient in Fig. 4a. The patient in (b) is HLA-DQ2.2, which manifests low-affinity binding to the HLA-DQ2.5 gliadin peptides used in the study (Bodd et al, Gastroenterology, 2012 Mar;142(3):552-61).
Extended Data Fig. 8.
Extended Data Fig. 8.. ScRNA-seq-based interactome analysis of novel gliadin-induced immune interactions in CeD organoids.
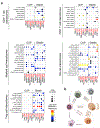
a, Overview of unique CellPhoneDB immune interactions found in 2-day CLIP- or gliadin-treated active CeD organoids, stratified by immune cell type (CD4+ T, CD8+ T, myeloid, NK and Treg cells). Columns indicate sending:receiving cell type and rows indicate ligand-receptor pairs. P values are indicated by circle size. The mean (log2) average expression levels of interacting molecule 1 and interacting molecule 2 are indicated by the color gradient. b, Corresponding schematic showing potential interactions between immune cells in CeD. Integrated data from N=4 CeD patients, 3 DQ2.5+ and 1 DQ2.2+.
Extended Data Fig. 9.
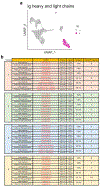
Extended Data Fig. 9.. BCR sequencing from CeD organoid scRNA-seq reveals extensive overlap with public anti-TG2 CeD-specific motifs.
a, scRNA-seq integrated UMAP plot highlighting BCR-expressing B and plasma cells in active CeD organoids, N=3 CeD patients. b, Homology analysis showing conserved CDR3 sequences (red) found between active CeD organoids and anti-TG2 CeD-specific published sequences, N=3 CeD patients.
Extended Data Fig. 10.
Extended Data Fig. 10.. IL-7 is upregulated in active celiac duodenal biopsy tissue.
a, Luminex protein analysis of organoid conditioned media from active CeD (N=7 biological replicates) or control (N=4 biological replicates) showing fold increases of IL-7 as ratio of gliadin:CLIP treatment after 2 days. Box plots show the median as the center line, the interquartile range as the box limits and the whiskers represent the min and max. ns, P=0.072; two-tailed Mann-Whitney test. b-c, Representative IF staining using a rabbit (Rb) anti-IL-7 antibody (red) in fresh duodenal biopsies from (b) 14 remission CeD patients (previously diagnosed with CeD but on gluten-free diet) versus (c) 14 CeD patients with active disease, showing increased IL-7 levels in the latter. Epithelium (CK19, green); DAPI (blue). Figure 6c shows staining for a 15th patient in remission and a 15th patient with active CeD, and quantitation is presented in Figure 6d. (GFD, N=15 donors) or active CeD (N=15 donors). d, Representative IF staining using a mouse (Ms) anti-IL-7 antibody (red) in fresh duodenal biopsies from (b) 4 remission CeD patients versus 4 patients with active CeD confirmed elevated IL-7 expression in active CeD seen with a different antibody (rabbit anti-IL-7) in (b) and (c). Scale bars are 100 μm.
Fig. 1.
Fig. 1.. Human ALI small intestine organoids preserve epithelium, mesenchyme and diverse immune populations without exogenous reconstitution.
a, Air-liquid interface (ALI) organoid schematic. b, ALI small intestine organoid, hematoxylin and eosin (H&E) staining, culture day 14 (representative of N=25 biological replicates). c, Time course of ALI organoid growth, brightfield images (representative of N=3 biological replicates cultured for >300 days). d, Epithelial protrusions, day 14, H&E staining (representative of N=25 biological replicates). e, Immunofluorescence (IF) staining of KI67 (green) and DAPI (blue), day 14 (representative of N=9 biological replicates). f, Day 370 ALI organoids, H&E (representative of N=3 biological replicates cultured for >300 days). g, Day 370 ALI organoids, IF staining of KI67 (red), ECAD (green) and DAPI (blue) (representative of N=3 biological replicates cultured for >300 days). h-j, ALI organoid whole-mount IF staining for (h) PDGFRA (red), (i) PGP9.5 (red) and (j) CD45 (red); ECAD (white) and DAPI (blue), day 14 (representative of N=3 biological replicates). k-l, IF whole-mount staining of day 14 ALI organoids for (k) CD14 (red), CD3 (green) and ECAD (white) or (l) for CD19 (green), ECAD (white) and DAPI (blue), day 14 (representative of N=3 biological replicates). m, Single cell RNA-sequencing (scRNA-seq) UMAP plot of FACS-sorted CD45+ cells from ALI organoids day 14, N=4 donors. n, Frequencies of organoid immune populations (N=6 patients) versus fresh tissue (N=1 patients) identified by scRNA-seq, day 14. o, Clonal expansion detected by scRNA-seq in ALI organoid TCR (N=6 patients) BCR (N=3 patients) repertoires, day 14. p, scRNA-seq UMAP plot from ALI organoids showing CD103 mRNA within T cells, day 14, N=4 biological replicates. q, IF staining of CD3+ intraepithelial lymphocytes (IELs) (red), ECAD (white), DAPI (blue), day 14 (representative of N=3 biological replicates). All panels represent duodenal organoids except for panels c, f and g which are ileal. No qualitative differences were found between duodenal and ileal organoids. All scale bars are 100 μm, except for (c), which is 5 mm.
Fig. 2.
Fig. 2.. Gliadin induces epithelial IL-15 production and apoptosis in celiac organoids.
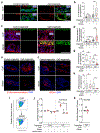
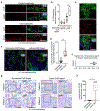
a, Representative IF staining of ALI organoids from control or active celiac disease patients (CeD) after 2-day treatment with CLIP or gliadin, IL-15 (red), CK19 (green) and DAPI (blue). b, Quantification of (a), each point is from an individual organoid from control (N=3 biological replicates) or CeD (N=4 biological replicates). **, P=0.0093; two-tailed Mann-Whitney test. c, Representative IF staining after 2-day treatment with CLIP or gliadin, cleaved caspase-3 (green), ECAD (red) and DAPI (blue). d, Quantification of (c), each point is from an individual organoid from control (N=3 biological replicates) or CeD (N=5 biological replicates). ***, P=0.0005 (CeD CLIP vs control CLIP); ***, P<0.0001 (CeD gliadin vs CeD CLIP); two-tailed Mann-Whitney test. e-f, Representative IF staining for sucrase-isomaltase (SI) (e) or APOA4 (f) (red), and DAPI (blue) of control or active CeD organoids treated with CLIP or gliadin for 2 days. g, Quantification of (e), each point is from an individual organoid from control (N=3 biological replicates) or CeD (N=3 biological replicates). ***, P=0.0004; two-tailed Mann-Whitney test. h, Quantification of (f), each point is from an individual organoid from control (N=3 biological replicates) or CeD (N=3 biological replicates). *, P=0.0339; two-tailed Mann-Whitney test. i-j, Representative flow cytometry measurements of gliadin-induced EPCAM+ cell death by caspase-3/7 activity (i), in active CeD (N=3 biological replicates) but not control organoids (N=3 biological replicates), which is abrogated by anti-MHC-II (j). Scatter plots show the median as the center line and the whiskers represent the min and max. **, P ≤0.01, one-way ANOVA. k. Gliadin (HLA-DQ2.5-restricted peptides) does not induce epithelial killing in HLA-DQ8+-derived CeD organoids, (N=5 patients). Non-significant (ns), P=0.8125, two-tailed Wilcoxon test. All scale bars are 100 μm and all CeD organoids were HLA-DQ2.5+ except in (k). All box plots show the median as the center line, the interquartile range as the box limits and the whiskers represent the min and max.
Fig. 3.
Fig. 3.. Gliadin induces T cell expansion in celiac organoids.
a, Whole mount IF staining of CD4+ T cells (green), CD8+ T cells (red), ECAD (white) and DAPI (blue) in active CeD organoids treated with CLIP or gliadin for 2 days (N=4 patients); scale bar = 200 μm. b-d, Flow cytometry quantification of T cell abundance in control or active CeD organoids, expressed as a ratio of gliadin:CLIP treatment for each T cell subset as a fraction of total live cells after two days treatment. (b) CD3+ T cells in organoids from control (N=20) or CeD (N=13) biological replicates. ***= P <0.0001, two-tailed Mann-Whitney test, (c) CD4+ T cells in organoids from control (N=20) or CeD (N=13) biological replicates. ***= P<0.0001; two-tailed Mann-Whitney test; (d) CD8+ T cells in organoids from control (N=18) or CeD (N=12) biological replicates. ***, P=0.0006; two-tailed Mann-Whitney test. Scatter plots show the median as the center line and the whiskers represent the min and max. e-f, Detection of gluten-reactive CD4+ T cells in organoids from patients with remission celiac disease (remission CeD organoids), followed by CLIP or gliadin treatment for 6 days and FACS enumeration of HLA-DQ2-gliadin tetramer-reactive CD4+ T cells as a fraction of total organoid CD4+ cells. ns (P=0.0547); two-tailed Wilcoxon test; (e) HLA-DQ2-gliadin tetramer FACS analysis of organoids from a single representative CeD patient; (f) HLA-DQ2.5-gliadin tetramer FACS analysis of organoids as in (e); N=9 CeD patients; two-tailed Wilcoxon test. g, TCR homology analysis from scRNA-seq/scTCR-seq of organoids from N=5 CeD patients. The most conserved CDR3 sequences (red) between active CeD organoids and celiac-specific TCR published sequences are shown. All CeD organoids in this figure were HLA-DQ2.5+.
Fig. 4.
Fig. 4.. Gliadin induces network adaptive and innate immune responses in CeD organoids.
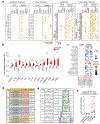
a, Dot plots from scRNA-seq depicting mean expression levels and corresponding percent population expression amongst active CeD organoid CD4+ and CD8+ T cells, Treg, plasma B and myeloid cells after 2-day gliadin or CLIP treatment. Data are from organoids from a single CeD patient; additional data from organoids from two other CeD patients are shown in Extended Data Figure 7. b, Luminex protein analysis of organoid conditioned media from active CeD (N=8 biological replicates) or control (N=4 biological replicates) with fold-increases of different cytokines/growth factors as ratio of gliadin:CLIP treatment after 2 days. Box plots show the median as the center line, the interquartile range as the box limits and the whiskers represent the min and max. SCD40L, IL-2, IL-4, IL-8 (*, P=0.028); IL-1A, CCL2, MCSF, GROA (*, P=0.048); IL-1RA, TGFA (**, P=0.008); IL-15, VEGF (*, P=0.016); IL-25, PDGFAA (**, P=0.004); two-tailed Mann-Whitney test. c, B cell and plasma B cell-specific immune interactomes derived from scRNA-seq CellPhoneDB analysis showing 117 unique B and plasma-cell driven interactions in gliadin-treated organoids and absence of unique interactions in CLIP, integrated data from N=4 CeD patients. d, BCR homology analysis from scRNA-seq/scBCR-seq depicting immunoglobulin CDR3 sequences with complete overlap between active CeD organoids and published anti-TG2 celiac-specific sequences (red); N=3 CeD patients. e, BCR sequence consensus analysis from scRNA-seq of matched CDR3 sequences from active CeD organoids and published anti-TG2 CDR3 sequences categorized by length; N=3 CeD patients. f, ELISA detection of anti-TG2 autoantibody production in the conditioned media of ALI organoids from CeD (N=7) or control (N=4) biological replicates after 2-day gliadin or CLIP treatment; *, P=0.0156; two-tailed Wilcoxon test. All CeD organoids in this figure were HLA-DQ2.5+.
Fig. 5.
Fig. 5.. IL-7 necessity and sufficiency during gluten-induced CeD organoid cytotoxicity.
a-b, ScRNA-seq-derived violin plots of transcripts per cell type. c, Scatter plot of CD103 and IL7R co-expression in CD8+ T cells from CeD organoids (N=5 patients). d, Gliadin-induced CeD organoid EPCAM+ apoptosis is abrogated by blocking IL-7 using IL-7RA extracellular domain (ECD) (N=6 patients); **, P=0.0078 (gliadin vs CLIP); *, P=0.0129 (gliadin+IL7-RA ECD vs gliadin); one-way ANOVA. e, Gliadin-induced CeD organoid EPCAM+ apoptosis is abrogated by blocking NKG2C/D using cognate receptor ECDs (N=4 patients). ***, P<0.0001 (gliadin vs. CLIP); ***, P<0.0001 (gliadin+NKG2C/D ECD vs. gliadin); one-way ANOVA. f-g, Flow cytometry demonstrating increased percentage of CD8+ T cells expressing NKG2C (f) or NKG2D (g) after gliadin treatment, normalized to CLIP and reversal by IL-7 inhibition. For (f) *, P=0.0117 (gliadin vs. CLIP, N=4 patients); **, P=0.0093 (gliadin+IL7-RA ECD vs. gliadin, N=3 patients) and for (g) *, P=0.0113 (gliadin vs. CLIP, N=4 patients); **, P=0.0026 (gliadin + IL7-RA ECD vs. gliadin, N=4 patients). One-way ANOVA, bar graphs depict median. h, IL-7 promotes EPCAM+ apoptosis with or without gliadin in CeD organoids (N=6 patients), but not control organoids (N=3 biological replicates); ***, P=0.0006 (gliadin vs CLIP); ***, P=0.0007 (CLIP+IL-7 vs CLIP); **, P=0.0036 (gliadin+IL-7 vs CLIP); one-way ANOVA. i, Representative flow cytometry histograms of NKG2C and NKG2D expression in CD8+ T cells and CD4+ T cells with or without IL-7 treatment. j, Flow cytometry quantification of CD8+ T cells depicting increased percentage of cells expressing NKG2C (N=5 biological replicates) or NKG2D (N=8 biological replicates) after IL-7 treatment of control or CeD organoids; *, P=0.0312; **, P=0.0039; two-tailed Wilcoxon test. All CeD organoids were HLA-DQ2.5+ except for limited HLA-DQ8+ in (j). All box plots show the median as the center line, the interquartile range as the box limits and the whiskers represent the min and max.
Fig. 6.
Fig. 6.. IL-7 production is increased by gliadin in CeD organoids and is upregulated in active CeD biopsies.
a, Representative IF staining of IL-7 (red), CK19 (green) and DAPI (blue) in control or active CeD organoids treated with CLIP or gliadin for 2 days. b, Quantification of (a), each data point is from an individual organoid from control (N=3) or CeD (N=3) biological replicates; ***, P=0.0002; two-tailed Mann-Whitney test. All CeD organoids in this figure were HLA-DQ2.5+. c, IF staining of IL-7 (red) in lamina propria, CK19 (green) and DAPI (blue) in representative duodenal biopsy tissues from single patients with remission or active CeD. Additional histology from N=14 remission and N=14 active CeD patients is presented in Extended Data Fig. 10. Scale bars are 100 μm. d, Quantification of (c) and Extended Data Fig. 10. Each data point corresponds to the median of at least 3 high-power fields from a different CeD patient in remission on a gluten-free diet (GFD, N=15) or active CeD (N=15); ***= P <0.0001; two-tailed Mann-Whitney test. e, IF staining of IL-7 (red), TAGLN (green) and DAPI (blue) in a representative duodenal biopsy tissue from a patient with active CeD. Scale bar is 50 μm. f, Quantification of (e), each data point corresponds to tissue IF from different patients with active CeD (N=12). g, In situ hybridization of IL7 mRNA (blue) in representative duodenal biopsy tissue from two remission CeD patients on a gluten-free diet (left) or in two patients with active CeD (right). Scale bars are 50 μm. h, Quantification of IL7 mRNA signal in lamina propria from (g), each data point corresponds to tissue from a different remission CeD (N=6) or active CeD patient (N=6); *, P=0.0152; two-tailed Mann-Whitney test. All box plots show the median as the center line, the interquartile range as the box limits and the whiskers represent the min and max.

Comment in

References

    1. Catassi C, Verdu EF, Bai JC & Lionetti E Coeliac disease. Lancet 399, 2413–2426 (2022). - PubMed
    1. Levescot A, Malamut G & Cerf-Bensussan N Immunopathogenesis and environmental triggers in coeliac disease. Gut 71, 2337–2349 (2022). - PMC - PubMed
    1. Iversen R & Sollid LM The Immunobiology and Pathogenesis of Celiac Disease. Annu Rev Pathol 18, 47–70 (2023). - PubMed
    1. Marsh MN Gluten, major histocompatibility complex, and the small intestine. A molecular and immunobiologic approach to the spectrum of gluten sensitivity (‘celiac sprue’). Gastroenterology 102, 330–354 (1992). - PubMed
    1. Jabri B, et al. Selective expansion of intraepithelial lymphocytes expressing the HLA-E-specific natural killer receptor CD94 in celiac disease. Gastroenterology 118, 867–879 (2000). - PMC - PubMed

Methods references

    1. Gandini A, Gededzha MP, De Maayer T, Barrow P & Mayne E Diagnosing coeliac disease: A literature review. Hum Immunol 82, 930–936 (2021). - PubMed
    1. Berg S, et al. ilastik: interactive machine learning for (bio)image analysis. Nat Methods 16, 1226–1232 (2019). - PubMed
    1. Stirling DR, et al. CellProfiler 4: improvements in speed, utility and usability. BMC Bioinformatics 22, 433 (2021). - PMC - PubMed
    1. Raki M, et al. Tetramer visualization of gut-homing gluten-specific T cells in the peripheral blood of celiac disease patients. Proc Natl Acad Sci U S A 104, 2831–2836 (2007). - PMC - PubMed
    1. Hao Y, et al. Integrated analysis of multimodal single-cell data. Cell 184, 3573–3587 e3529 (2021). - PMC - PubMed

MeSH terms