. 2024 Aug;632(8026):858-868.
doi: 10.1038/s41586-024-07606-7. Epub 2024 Jul 24.

Single-cell multiregion dissection of Alzheimer's disease

Affiliations

Single-cell multiregion dissection of Alzheimer's disease

Hansruedi Mathys et al. Nature. 2024 Aug.

Abstract

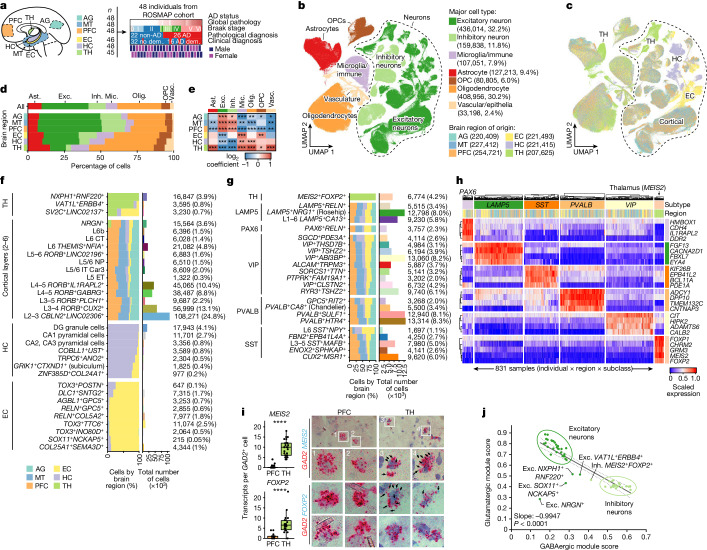
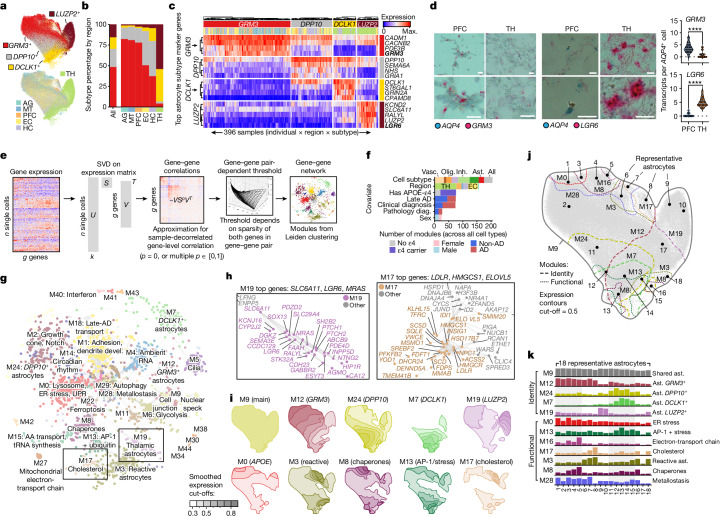
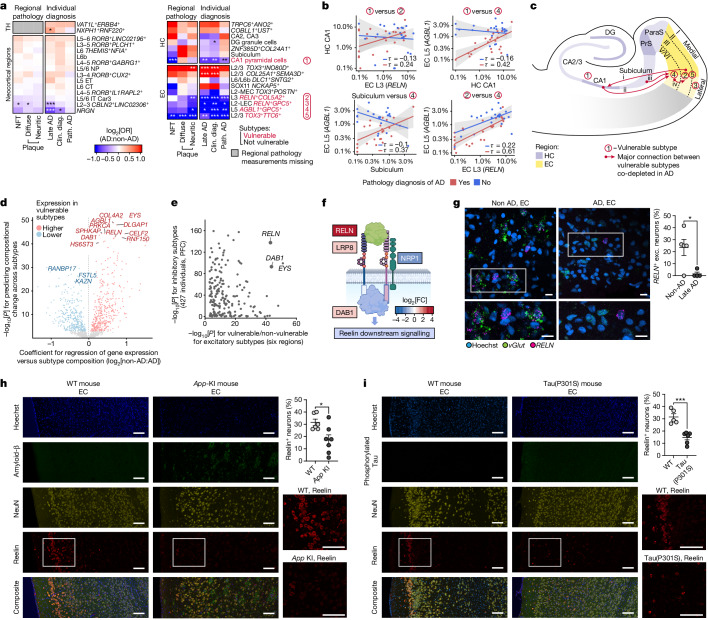
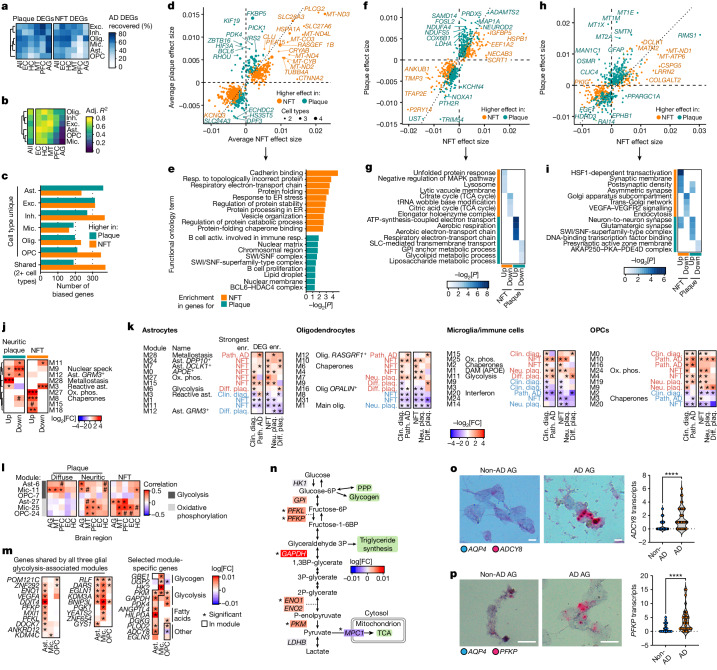
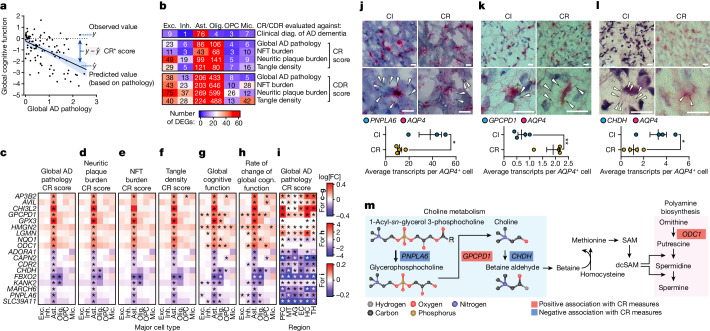
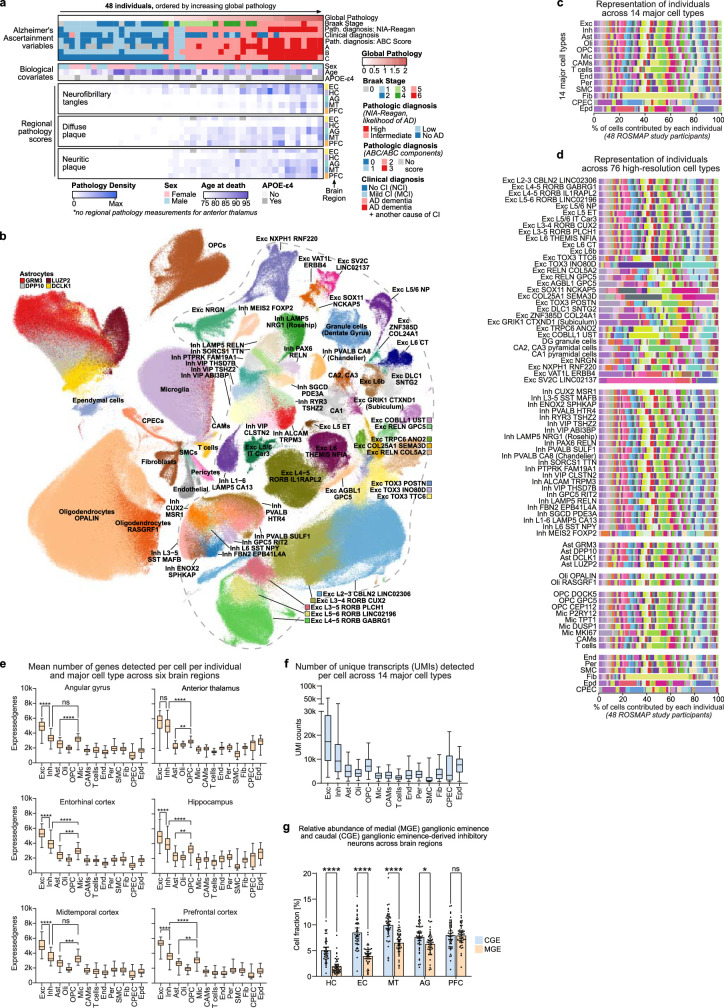
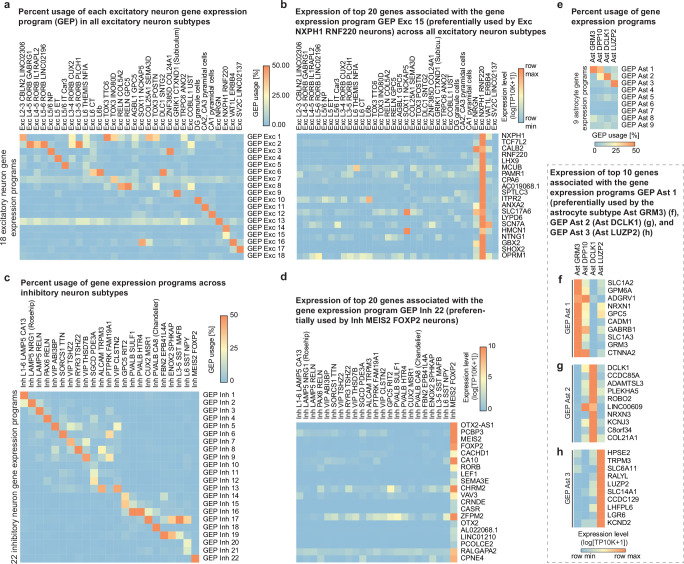
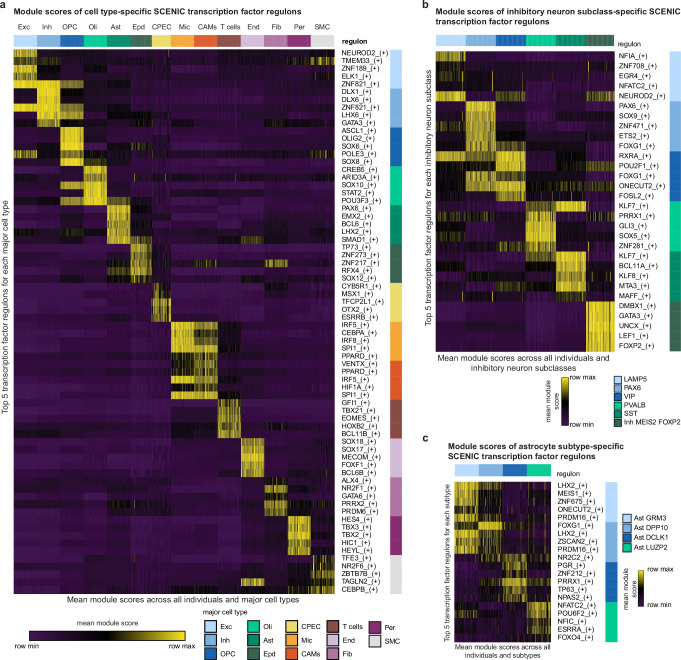
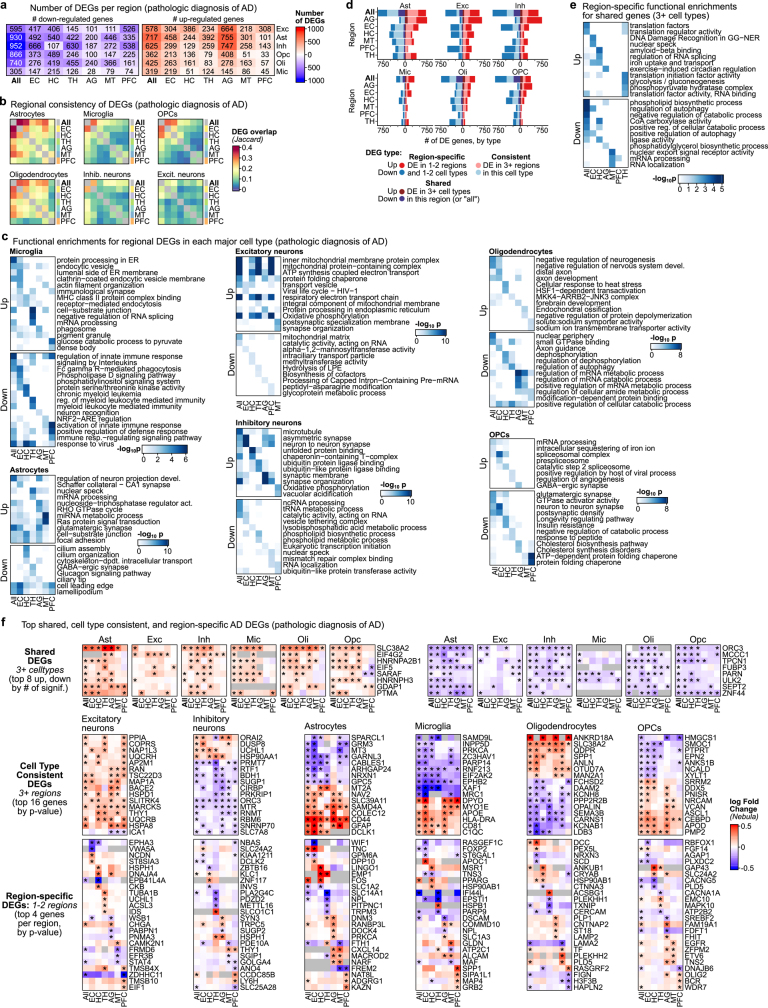
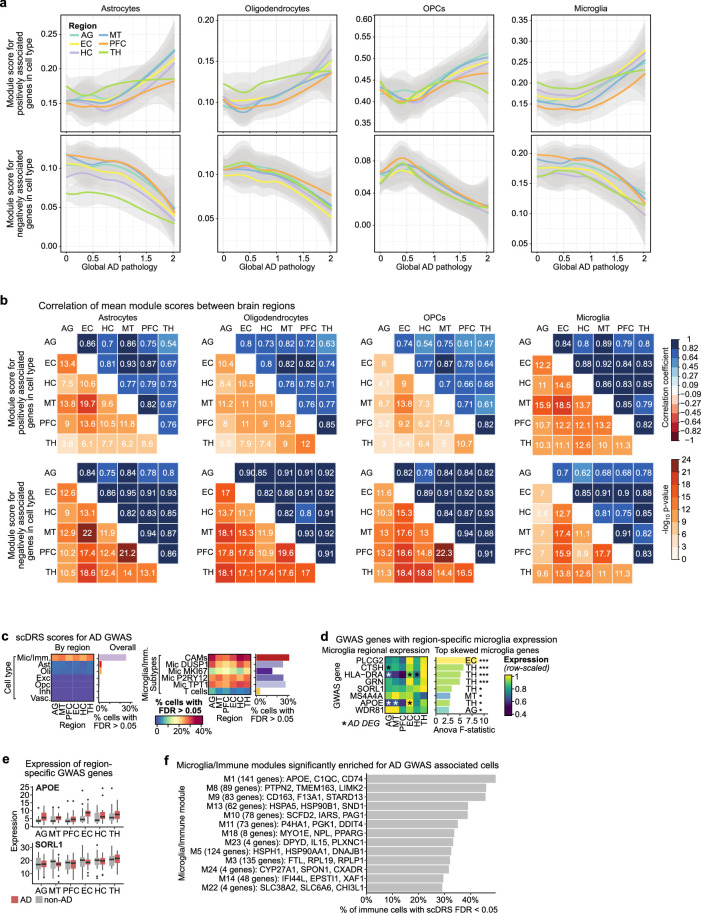
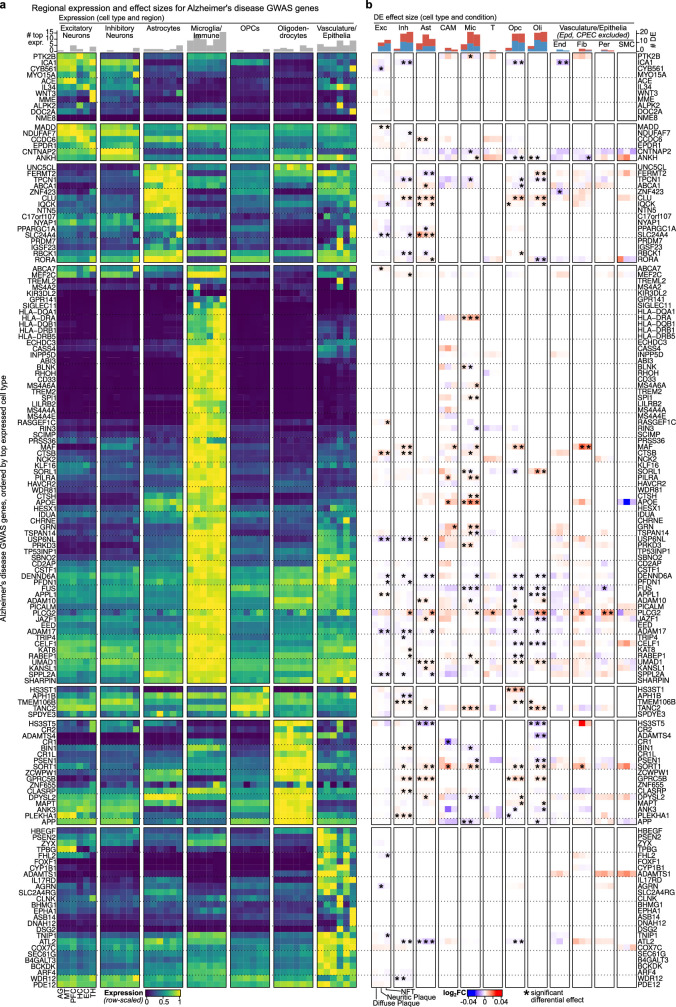
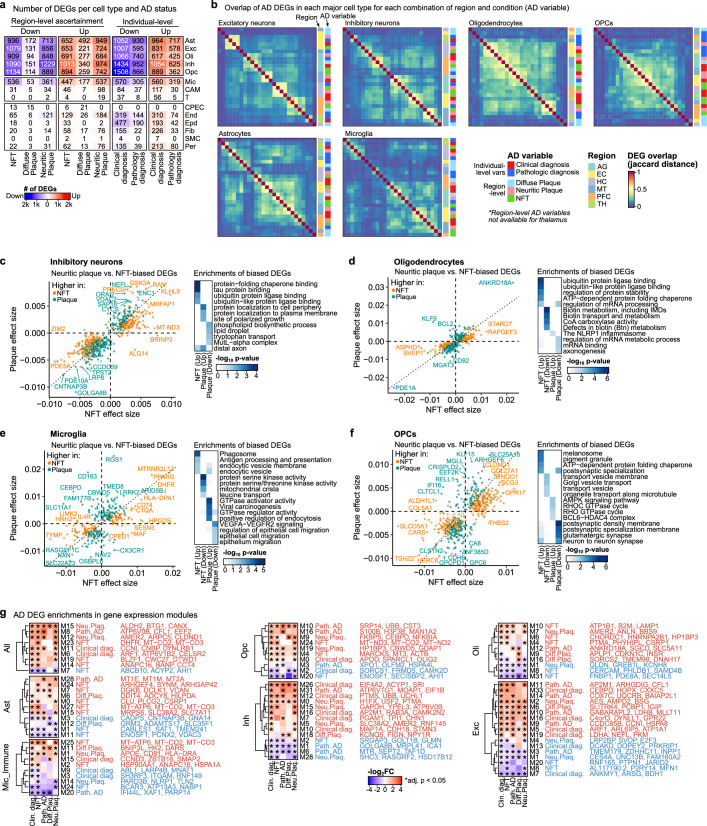
Alzheimer's disease is the leading cause of dementia worldwide, but the cellular pathways that underlie its pathological progression across brain regions remain poorly understood1-3. Here we report a single-cell transcriptomic atlas of six different brain regions in the aged human brain, covering 1.3 million cells from 283 post-mortem human brain samples across 48 individuals with and without Alzheimer's disease. We identify 76 cell types, including region-specific subtypes of astrocytes and excitatory neurons and an inhibitory interneuron population unique to the thalamus and distinct from canonical inhibitory subclasses. We identify vulnerable populations of excitatory and inhibitory neurons that are depleted in specific brain regions in Alzheimer's disease, and provide evidence that the Reelin signalling pathway is involved in modulating the vulnerability of these neurons. We develop a scalable method for discovering gene modules, which we use to identify cell-type-specific and region-specific modules that are altered in Alzheimer's disease and to annotate transcriptomic differences associated with diverse pathological variables. We identify an astrocyte program that is associated with cognitive resilience to Alzheimer's disease pathology, tying choline metabolism and polyamine biosynthesis in astrocytes to preserved cognitive function late in life. Together, our study develops a regional atlas of the ageing human brain and provides insights into cellular vulnerability, response and resilience to Alzheimer's disease pathology.


Conflict of interest statement

The authors declare no competing interests.

Figures

Fig. 1
Fig. 1. snRNA-seq analysis of six distinct regions of the aged human brain.
a, snRNA-seq profiling summary, covering 283 samples across 6 brain regions from 48 participants from ROSMAP, showing global pathology, Braak stage and pathological (26 AD and 22 non-AD) or clinical diagnosis of AD (16 AD dementia (dem.) and 32 no dementia). b,c, Joint uniform manifold approximation and projection (UMAP), coloured by major cell type (b) and region of origin (c). d, The regional composition of major cell types. e, Relative enrichment of major cell types across regions by quasi-binomial regression. False discovery rate (FDR)-corrected P values are indicated by asterisks; ***P < 0.001, **P < 0.01, *P < 0.05. f,g, Global breakdown, region composition, enrichment and number of nuclei for excitatory (f) and inhibitory (g) neuronal subtypes. h, Gene expression analysis of the top four markers per inhibitory subclass, averaged at the sample by subclass level (columns). i, RNAscope validation of FOXP2 and MEIS2 as markers of the unique thalamus subtype, with quantification (left) performed using Student’s t-tests and representative images (right). The blue puncta represent MEIS2 (top) or FOXP2 (bottom) transcripts and red puncta represent GAD2 transcripts. FOXP2: n = 19 (PFC) and n = 22 (TH) cells; MEIS2: n = 35 (PFC) and n = 26 (TH) cells; each dot represents an individual cell, pooled from eight samples (four individuals; each had one PFC and one thalamus sample). j, Glutamatergic versus GABAergic scores for all neuron subtypes. The dotted lines represent the 95% confidence interval around the linear fit. P values were calculated using two-sided F tests. Ast., astrocytes; exc., excitatory neurons; inh., inhibitory neurons; mic., microglia/immune cells; olig., oligodendrocytes; vasc., vascular/epithelial cells.
Fig. 2
Fig. 2. Astrocyte diversity across regions annotated by gene expression modules.
a, UMAP plot for astrocyte nuclei, coloured by astrocyte subtype or brain region of origin. b, Global breakdown and regional composition of astrocyte subtypes. c, Gene expression heat map for the top markers of each astrocyte subclass, averaged to sample by subtype and scaled to the row maximum (max.). d, RNAscope validation of GRM3 and LGR6 as markers of AQP4+ neocortical and TH astrocytes, respectively (bold markers in c). Representative images (left) showing AQP4 transcripts (blue puncta) and GRM3 or LGR6 transcripts (red puncta). Scale bars, 20 μm. Quantification (right) was performed using two-tailed unpaired Student’s t-tests; ****P < 0.0001. Each dot represents an individual cell, pooled from eight samples (four individuals; each with one PFC and one thalamus sample). GRM3: n = 37 (PFC) and n = 23 (TH) cells; LGR6: n = 17 (PFC) and n = 23 (TH) cells. e, The framework for detecting gene expression modules using scdemon. f, The number of modules enriched for each covariate across all module sets (hypergeometric test, P < 0.001). Bar plots are coloured by the covariate level for which the modules are enriched (or by the major cell type used for module discovery for cell subtype). Diag., diagnosis. g,h, Gene–gene network (g) and magnification of the indicated regions (h) for astrocyte modules, with insets for M19, a subtype identity module for LUZP2 astrocytes (h, left) and M17, a functional program involved in cholesterol biosynthesis (h, right). AA, amino acid. i, Contour plots on the astrocyte UMAP for module expression of five identity (top row) and five functional (bottom row) programs. Expression was smoothed on a 500 × 500 grid with a 2D Gaussian kernel (size = 25 × 25; σ = 1). j,k, Module contours showing regions of top expression on the astrocyte UMAP for selected identity modules (j) and corresponding module scores (k) for the 18 labelled representative cells across the astrocyte UMAP for selected identity and expression models, scaled to the maximal expression of each module. ER, endoplasmic reticulum; SVD, singular value decomposition.
Fig. 3
Fig. 3. Subtype-specific neuronal vulnerability in AD.
a, Compositional differences in excitatory neuron subtype enrichment and depletion in AD by quasi-binomial regression with FDR correction. Clin. diag., clinical diagnosis; path. AD, pathologic AD. b, Scatter plot and correlations (Kendall’s τ) of the subtype fraction between four pairs of neuronal subtypes in the HC and EC (linear fit with 95% confidence intervals). c, Schematic of the HC and EC, highlighting the locations of vulnerable excitatory subtypes and co-depleted connections. d, Genes associated with excitatory neuron subtype vulnerability across all brain regions. Linear regression between normalized sample + subtype-level gene expression and log2[OR] for late-AD, with FDR-corrected P values. e, Genes associated with excitatory and inhibitory subtype vulnerability (FDR-corrected P values, only genes significantly and positively associated with excitatory subtype vulnerability). f, Schematic of Reelin signalling pathway genes that are differentially expressed in vulnerable inhibitory subtypes (colour indicates the log2-transformed fold change in expression between vulnerable and non-vulnerable subtypes). The diagram was created using BioRender. g, In situ hybridization (RNAscope) validation of depletion of RELN+ excitatory neurons in the EC of individuals with AD relative to individuals without AD. Representative images (left) include Hoechst (blue), vGlut transcripts (green puncta) and RELN transcripts (magenta puncta). Scale bars, 20 μm. Quantification (right) was performed using unpaired two-tailed Student’s t-tests (P = 0.0242). Data are mean ± s.e.m. n = 5 (non-AD) and n = 4 (AD) individuals. h,i, Immunohistochemistry analysis of Reelin, NeuN and amyloid-β (h) or phosphorylated tau (i) in 12-month-old App-KI mice (h) or 9-month-old Tau(P301S) transgenic mice (i), showing depletion of Reelin-positive neurons in the ECs of the KI and transgenic mice compared with those of the wild-type controls. Representative images (left) show Hoechst (blue); amyloid-β (h; D54D2) or phosphorylated-tau (i) (green); NeuN (yellow); and Reelin (red). Scale bars, 100 μm (h and i). Quantification (right) was performed using unpaired two-tailed Student’s t-tests; P = 0.0181 (App-KI, h; n = 7 (App-KI) and n = 6 (wild type) mice) and P = 0.0005 (Tau(P301S), i; n = 6 mice (Tau(P301S)) and n = 5 (wild type) mice). Data are mean ± s.e.m. ParaS, parasubiculum; PrS, presubiculum. Source Data
Fig. 4
Fig. 4. Gene expression modules annotate and separate AD changes across pathology.
a, The percentage of AD DEGs (pathologic diagnosis) overlapping with DEGs for neuritic plaques (neu. plaq.) and NFTs in each major cell type and region. b, Concordance of effect-sizes between neuritic plaque and NFT DEGs. Adjusted R2 of log-transformed fold changes between neuritic plaque and NFT DEGs in each major cell type and region. c, The number of neuritic-plaque- or NFT-biased DEGs (≥3 DEGs for one of plaques or NFTs, and ≤2 for the other) for each major cell type or shared across 2+ cell types. di, The average effect sizes for NFTs and neuritic plaques for DEGs with biased differential effect sizes (d,f,h) and their respective functional enrichments (e,g,i), for DEGs shared across multiple cell types (d,e), in excitatory neurons (f,g) or in astrocytes (h,i). j, Enrichments (hypergeometric test) of pathology-biased DEGs in astrocyte modules. k, Enrichments (enr.) of AD DEGs in glial gene expression modules (*Padj < 0.05, signed log2[fold change], only significant modules are shown). l, Pearson correlation of module scores in each region with region-level pathology measures for glycolysis and oxidative phosphorylation modules in astrocytes, microglia and OPCs (#P < 0.1). m, Core and selected diffuse plaque (diff. plaq.) DEGs in glial glycolysis-associated modules. n, Schematic of the glycolysis pathway, annotated by astrocyte diffuse plaque DEGs. Significant DEGs for diffuse plaques across all regions are indicated by asterisks. o,p, RNAscope validation of astrocyte energy metabolism DEGs in the AG of individuals with AD relative to control individuals without AD (pathologic diagnosis of AD). Representative images (left) show AQP4 transcripts (blue puncta) and ADCY8 (o) or PFKP (p) transcripts (red puncta). Scale bars, 20 μm (o and p). Quantification (right) was performed using unpaired two-tailed Student’s t-tests (ADCY8: n = 117 (non-AD) and n = 76 (AD) cells; PFKP: n = 43 (non-AD) and n = 40 (AD) cells). The dots represent individual cells, pooled from eight samples (four individuals; each had one PFC and one thalamus sample). Activ., activation; DAM, disease associated microglia; ox. phos., oxidative phosphorylation; resp., response.
Fig. 5
Fig. 5. Molecular correlates of CR to AD pathology.
a, The concept of CR and CDR scores. Pathology measurements are used to predict global cognitive function, for CR scores, or rate of cognitive decline, for CDR scores. b, The number of significant DEGs in major cell types across nine measures of CR. ch, Association of astrocyte CR genes with measures of CR (global AD pathology CR score (c), neuritic plaque burden CR score (d), NFT burden CR score (e), tangle density CR score (f), global cognitive (cogn.) function (g) and rate of change of global cognitive function (h)) across six major cell types in the PFC (427 individuals, DEGs were computed using muscat). i, The association between the expression of CR genes in astrocytes across six brain regions and CR to global AD pathology (48 individuals; DEGs were computed using MAST). jl, RNAscope validation of the differentially expressed astrocyte CR genes PNPLA6 (j), GPCPD1 (k) and CHDH (l) in the PFC of individuals with cognitive impairment (CI) relative to cognitively resilient (CR) individuals. Representative images (top) show AQP4 transcripts (red puncta) and CR gene transcripts (blue puncta). Scale bars, 20 μm (jl). Quantification (bottom) was performed using unpaired two-tailed Student’s t-tests; P = 0.0249 (j), P = 0.0052 (k), P = 0.0375 (l). Data are mean ± s.e.m. PNPLA6: n = 3 (CI) and n = 4 (CR) individuals; GPCPD1 and CHDH: n = 4 individuals per group. m, Schematic of choline metabolism and polyamine biosynthesis; significant astrocyte CR genes are highlighted.
Extended Data Fig. 1
Extended Data Fig. 1. Overview of the study sample and major cell type annotations.
a, Metadata overview: a total of 283 post-mortem brain tissue samples from 24 male and 24 female study participants were analysed across Alzheimer’s disease progression (AD). Top two panels show metadata at the individual level and bottom three panels show region-specific pathology measurements of neurofibrillary tangle burden (nft), neuritic plaque burden (plaq_n), and diffuse plaque burden (plaq_d). Individuals (columns) are ordered according to their global AD pathology burden. b, Joint UMAP of 1.3 M cells across 14 major cell types coloured and labelled by 76 high-resolution subtypes. c,d, Representation of individuals across cell types. The stacked bar plots show the proportion of cells contributed by each study participant across 14 major cell types (c) and 76 high-resolution cell types (d). e-f, Box plots of the number of genes detected per cell across all major cell types (e) and mean number of unique transcripts detected per cell per individual and major cell type across the six brain regions analysed (f). Within each box, horizontal lines denote median values; boxes extend from the 25th to the 75th percentile of each group’s distribution of values; whiskers extend from the 5th to the 95th percentile. ****P < 0.0001, ***P < 0.001, **P < 0.01; ns, P > 0.05; (ordinary one-way ANOVA corrected for multiple comparisons using Bonferroni’s multiple comparisons test). g, Relative abundance of inhibitory neurons originating from the medial (MGE) ganglionic eminences (SST and PVALB) and the caudal (CGE) ganglionic eminence (VIP, PAX6, and LAMP5) across brain regions. The bar plots show the mean fraction of cells per individual and brain region (AG, HC, MT, PFC: n = 48; TH: n = 45; EC: n = 46). The fraction of cells was computed relative to all the cells isolated from a brain region of an individual. Data are expressed as mean with 95% confidence intervals and individual data points are shown (two-way ANOVA corrected for multiple comparisons using Bonferroni’s multiple comparisons test).
Extended Data Fig. 2
Extended Data Fig. 2. Gene expression programs.
a, Heat map showing percent usage of all excitatory neuron gene expression programs (GEPs) (rows) in all excitatory neuron subtypes (columns). b, relative expression level of the top 20 genes associated with the gene expression program GEP Exc 15 (preferentially used by Exc NXPH1 RNF220 neurons) across all excitatory neuron subtypes. c, Heat map showing percent usage of all inhibitory neuron gene expression programs (GEPs) (rows) in all inhibitory neuron subtypes (columns). d, Expression level of the top 20 genes associated with the gene expression program GEP Inh 22 (preferentially used by Inh MEIS2 FOXP2 neurons) across all inhibitory neuron subtypes. e, Heat map showing percent usage of all astrocyte gene expression programs (GEPs) (rows) in all astrocyte subtypes (columns). f-h, Relative expression level of the top 10 genes associated with the gene expression programs GEP Ast 1 (preferentially used by the astrocyte subtype Ast GRM3) (f), GEP Ast 2 (preferentially used by the astrocyte subtype Ast DCLK1) (g), and GEP Ast 3 (preferentially used by the astrocyte subtype Ast LUZP2) (h) across all astrocyte subtypes.
Extended Data Fig. 3
Extended Data Fig. 3. Cell and subtype-specific transcription factor regulators.
a, Identification of major cell type-specific SCENIC transcription factor regulons. The heat map shows the module score of the top 5 transcription factor regulons (rows) for each major cell type across all individuals and major cell types (columns). b, Identification of inhibitory neuron subclass-specific SCENIC transcription factor regulons. The heat map shows the module score of the top 5 transcription factor regulons (rows) for each subclass across all individuals and subclasses of inhibitory neurons (columns). c, Identification of astrocyte subtype-specific SCENIC transcription factor regulons. The heat map shows the mean module score of the top 5 transcription factor regulons (rows) across all individuals and astrocyte subtypes (columns).
Extended Data Fig. 4
Extended Data Fig. 4. Region-specific cell-cell communication.
a-b, Ligand-receptor pairs with the greatest increase (a) or decrease (b) in interaction score in the thalamus compared to the prefrontal cortex. Bar plots show the interaction scores for the ligand-receptor pairs indicated. The interaction score was calculated by applying the minus log10 transformation to the robust rank aggregation (RRA) score. A lower RRA score indicates that a ligand-receptor interaction is ranked consistently higher than expected by chance across multiple prediction methods. Violin plots show the expression of the ligand (left) and receptor (right) in the cell types and brain regions indicated.
Extended Data Fig. 5
Extended Data Fig. 5. Module summary panels across modules.
a-h, Overview of gene expression modules with at least 10 genes each across all cells and across major cell types, showing the module name, number of genes, percent expression, top module genes, enrichments by subtype (except for neuron subtypes, see Supplement), covariates, and regions, and the top functional enrichment for each module. Percent expression is the percent of cells whose average expression (log1p, normalized) of the module is above 1. Covariate enrichments are performed by hypergeometric test, comparing the intersection of cells with z-scored module expression of at least 1 vs. with z < 1 against a particular level of a covariate of interest (e.g. cells from the entorhinal cortex region or cells of a specific subtype). Panels summarize modules found in all cells (a), astrocytes (b), OPCs (c), microglia and immune cells (d), oligodendrocytes (e), inhibitory neurons (f), vasculature and epithelia (g), and excitatory neurons (h). All modules except vasculature and epithelia modules are split into identity vs. other, where identity modules are highly enriched in a single subtype and have an average expression greater than 1 (log1p, normalized) for over 50% of the subtype’s cells.
Extended Data Fig. 6
Extended Data Fig. 6. Cross-module clustering and comparison.
a, Module-module correlation (Pearson correlation) and gene set overlap (Jaccard distance) for modules with at least 10 genes from all sets of modules (263 modules in total). Heatmaps are ordered by the hierarchical clustering of the correlation matrix and cuts represent 20 clusters cut from the hierarchical clustering dendrogram. Left and right side bars label rows by their modules set of origin (major cell type colours and grey for all cells). The most commonly shared genes in selected clusters of modules are shown on the right of the gene set overlap heatmap. b, Functional enrichments for each cluster of modules for the shared genes (>2 modules) in each cluster (only clusters with significant enrichments shown). Up to 5 enrichments shown, ordered by p-value, labelled by their source and only keeping terms with fewer than 500 genes. c, Covariate and functional enrichments for example astrocyte modules M19 (thalamus identity program) and M17 (cholesterol metabolism and biosynthesis program). Region, subtype, and covariate enrichments performed at cell level by stratifying cells with z-score > 1 and testing for regional or subtype enrichment (see Methods). Functional enrichments performed using gprofiler2, keeping terms with fewer than 500 genes. d, Scatterplots and correlation of scores for selected pairs of astrocyte modules. Each dot represents the module expression scores for a subtype in a specific sample and is coloured by the astrocyte subtype. Grey area represents the 95% confidence interval around the linear fit. e, Functional enrichments for selected astrocyte modules, showing top 10 functional enrichments for each pair of compared correlated modules (and for M6, M13, M27 together). Only terms with fewer than 500 genes shown. f, Microglial and immune modules network from correlation of module pairs at the subtype by sample level (edges shown where FDR-adjusted p-value < 0.05). Nodes are coloured by module’s relative expression in each of the microglial and immune subtypes and groups highlight sets of subtype-biased modules.
Extended Data Fig. 7
Extended Data Fig. 7. Neuronal vulnerability, connectivity, and markers of vulnerability.
a, Compositional differences for major cell types in AD by quasi-binomial regression with FDR-correction. log2 OR shown both for each AD variable across regions (left) and for each region in late-AD (right). Analysis performed for individual-level AD status and region-level pathology measurements. Pathologic diagnosis of AD (Path. AD) was stratified by NIA-Reagan score (26 AD and 22 non-AD) and clinical diagnosis was stratified as AD dementia (n = 16) and non-CI (n = 32). b-c, Compositional differences for glial subtypes and inhibitory neuron subtypes according to individual-level AD status and region-level pathology measurements (as in a). Grey boxes indicate interactions that are not computed due to MEIS2 FOXP2 specificity to the thalamus, where we do not have measured regional scores. d, Compositional differences in inhibitory neuron subtypes in late AD (Braak Stage 5-6 vs. 1–4) in each region. Grey boxes indicate interactions that are not computed due to subtype regional specificity. e, Boxplots (top) of neuronal fraction for two vulnerable EC subtypes, split by AD status (AD: blue, non-AD: red), with p-values from one-sided Wilcoxon test. Scatter plots (bottom) of individuals’ global cognition at last visit against cell fraction for two AD-vulnerable entorhinal cortex subtypes, coloured by AD. Linear fit with 95% confidence interval shown in grey. f, Estimated effect size of cell fraction (log10) on scores for performance in various cognitive domains at last visit and combined scores from all domains (global). Linear regression FDR-corrected p-values (**adjusted p-value < 0.01, *<0.05, dot is <0.1). g, Full correlation matrix between subtype fraction between the hippocampus and entorhinal cortex in the same individuals, as described in the methods (***adjusted p-value < 0.001, **<0.01, *<0.05). i, Example genes predictive of subtype vulnerability. Scatterplots show average expression in the subtype across individuals against the effect size of the depletion or enrichment in AD as measured by the log2 odds-ratio for late-AD, as in the Methods. i, Functional enrichments and intersected genes for top 30 markers of subtype vulnerability (terms with <500 genes). j, Association (quasi-binomial regression) between the relative abundance of inhibitory neuron subtypes in the prefrontal cortex and the density of neurofibrillary tangles. Association scores (signed negative log10 FDR-adjusted P value, where the sign was determined by the direction (positive or negative) of the association) are shown. The dotted line indicates the significance level threshold of an FDR-corrected P value of 0.05. P values were derived using the glm function in R and adjusted for multiple testing via the Benjamini-Hochberg method. k, Volcano plot showing genes differentially expressed in vulnerable versus non-vulnerable inhibitory neuron subtypes (genes significantly higher in vulnerable subtypes in red, lower in blue). FDR-adjusted P values as determined by the R package ‘dreamlet’ are shown. l, Scatter plot of each tested gene’s average differential expression effect size in late-AD (y-axis) versus the correlation of its expression in a subtype and that subtype’s level of depletion in late-AD (x-axis). Dashed lines separate genes associated with vulnerability and non-vulnerability. m, Functional enrichments for each identified class of neuronal DEGs (terms <500 genes) on bins (along x-axis from l), from genes associated with vulnerability to those associated with non-vulnerability (only genes with biased effect sizes, see Methods). Dashed lines correspond to the same breaks as in (l).
Extended Data Fig. 8
Extended Data Fig. 8. Regional differential expression and GWAS association.
a, Number of up- and down-regulated differentially expressed genes (DEGs) with respect to pathologic diagnosis of AD for each major cell type, calculated in each region separately as well as jointly over all regions. b, Heatmaps of Jaccard similarity of DEGs across regions for each major cell type. c, Heatmap of -log10 p-values for functional enrichments showing the top pathways for AD DEG shared across 3+ cell types. Enrichments shown for DEGs calculated in each region and in all regions together (up to the top 3 pathways per analysis are shown). d, Barplot of number of DEGs per region and cell type, coloured by type of DEG, as determined by its shared differential expression across regions and cell types. e, Top functional enrichments for region-specific DEGs and DEGs shared across regions (≥3 regions) with up to the top 2 terms (<500 genes only) shown per region. Panels shown and computed separately for each major cell type. f, Heatmap of log fold change for top shared, cell-type consistent, and cell+region-specific DEGs in major cell types. GG-NER: global genome nucleotide excision repair.
Extended Data Fig. 9
Extended Data Fig. 9. Inter-regional comparison of AD pathology-associated gene sets and region-specific GWAS enrichments.
a-b, Seurat module scores of genes significantly positively (top) or negatively (bottom) associated with the global AD pathology variable in prefrontal cortex for astrocytes, oligodendrocytes, OPCs, and microglia across brain regions and the spectrum of global AD pathology burden. The gene sets used for computing the module scores (genes significantly associated with global AD pathology burden) were determined based on snRNA-seq data derived from prefrontal cortex tissue of 427 ROSMAP study participants. The scatterplots (a panels) illustrate the relationship between global AD pathology burden and the mean module score for the specified gene set, with this mean score calculated by averaging the module scores of all cells of the designated cell type isolated from an individual. A LOESS (Locally Estimated Scatterplot Smoothing) regression line with a 95% confidence interval is shown, and the regression lines are coloured by brain region. The central LOESS regression line represents the local measure of central tendency, calculated through locally weighted regression to reflect the smoothed relationship between the module scores indicated and global AD pathology burden. Interregional Pearson’s correlation analysis of mean module scores (b panels) was performed by first averaging the module scores of all cells of the cell type of interest from an individual study participant. The correlation analysis was then performed between regions based on these averaged scores. P values were calculated using the cor.test function in R and were adjusted for multiple testing using the p.adjust function with the Benjamini-Hochberg method. c, Heatmap (by region, left) and barplot (over all regions, right) showing the percentage of cells with significant scDRS (disease relevance scores) for AD GWAS. Rows are split into major cell type groups (top) and microglia and immune subtypes. d, Regional expression (heatmap, left) and F-statistic for region in predicting expression (barplot, right) for eight GWAS genes with significantly region-specific expression in microglia. Barplot is coloured by the top expressed region (regression coefficient). Heatmap is labelled with stars if the gene is a DEG for that region. e, Boxplots showing expression of two of the region-specific GWAS genes in individuals with and without a pathologic diagnosis of AD. f, Microglia/immune modules associated with AD GWAS. Fraction of microglia or immune cells with significant expression of each module (z-score > 2.5) and with significant scDRS scores (FDR < 0.05). Only significant modules are shown (adjusted p < 0.01, hypergeometric test with BH correction).
Extended Data Fig. 10
Extended Data Fig. 10. Alzheimer’s disease GWAS-linked genes in the multi-region atlas.
a, Expression level by region/subtype and effect sizes of 150 Alzheimer’s disease candidate risk genes from Alzheimer’s disease GWAS risk loci. b, Differential effect sizes and significance for each candidate risk gene in each minor cell type across regional pathology measurements. Ependymal cells and CPEC cells were excluded as the thalamus does not have regional pathology measurements.
Extended Data Fig. 11
Extended Data Fig. 11. Pathology-biased DEGs for major cell types.
a, Number of DEGs for each cell type for both region-level pathology measurements and individual-level AD status (DE analysis performed over all regions jointly). b, Overlap of AD DEGs in each major cell type for each combination of region and condition (AD variable). DEG overlap computed by Jaccard distance and rows/columns hierarchically ordered by Euclidean distance. c-f, Scatter plots of average effect sizes for NFT and plaque for DEGs with biased differential effect sizes (left panels) and their respective functional enrichments (right panels), for DEGs specific to inhibitory neurons (c), oligodendrocytes (d), microglia (e), and OPCs (f). Genes are coloured by whether they have higher effect size relative to NFT (orange) or plaque levels (teal). g, Heatmap of hypergeometric enrichments of up (red) or down (blue) AD DEGs in modules for DEGs in all sets of modules across all regions, by AD condition. Only modules with at least two significant enrichments are shown and rows are clustered hierarchically by Euclidean distance.

Comment in

References

    1. Braak, H. & Braak, E. Staging of Alzheimer’s disease-related neurofibrillary changes. Neurobiol. Aging16, 271–278 (1995). 10.1016/0197-4580(95)00021-6 - DOI - PubMed
    1. Wilson, R. S. et al. Temporal course and pathologic basis of unawareness of memory loss in dementia. Neurology85, 984–991 (2015). 10.1212/WNL.0000000000001935 - DOI - PMC - PubMed
    1. Stern, Y. et al. Whitepaper: defining and investigating cognitive reserve, brain reserve, and brain maintenance. Alzheimers Dement.133, 484–491 (2020). - PMC - PubMed
    1. Sonnen, J. A. et al. Pathological correlates of dementia in a longitudinal, population-based sample of aging. Ann. Neurol.62, 406–413 (2007). 10.1002/ana.21208 - DOI - PubMed
    1. Bennett, D. A. et al. Natural history of mild cognitive impairment in older persons. Neurology59, 198–205 (2002). 10.1212/WNL.59.2.198 - DOI - PubMed

MeSH terms

LinkOut - more resources