. 2024 Aug;632(8025):656-663.
doi: 10.1038/s41586-024-07718-0. Epub 2024 Jul 24.

SMYD5 methylation of rpL40 links ribosomal output to gastric cancer

Affiliations

SMYD5 methylation of rpL40 links ribosomal output to gastric cancer

Juhyung Park et al. Nature. 2024 Aug.

Abstract

Dysregulated transcription due to disruption in histone lysine methylation dynamics is an established contributor to tumorigenesis1,2. However, whether analogous pathologic epigenetic mechanisms act directly on the ribosome to advance oncogenesis is unclear. Here we find that trimethylation of the core ribosomal protein L40 (rpL40) at lysine 22 (rpL40K22me3) by the lysine methyltransferase SMYD5 regulates mRNA translation output to promote malignant progression of gastric adenocarcinoma (GAC) with lethal peritoneal ascites. A biochemical-proteomics strategy identifies the monoubiquitin fusion protein partner rpL40 (ref. 3) as the principal physiological substrate of SMYD5 across diverse samples. Inhibiting the SMYD5-rpL40K22me3 axis in GAC cell lines reprogrammes protein synthesis to attenuate oncogenic gene expression signatures. SMYD5 and rpL40K22me3 are upregulated in samples from patients with GAC and negatively correlate with clinical outcomes. SMYD5 ablation in vivo in familial and sporadic mouse models of malignant GAC blocks metastatic disease, including peritoneal carcinomatosis. Suppressing SMYD5 methylation of rpL40 inhibits human cancer cell and patient-derived GAC xenograft growth and renders them hypersensitive to inhibitors of PI3K and mTOR. Finally, combining SMYD5 depletion with PI3K-mTOR inhibition and chimeric antigen receptor T cell administration cures an otherwise lethal in vivo mouse model of aggressive GAC-derived peritoneal carcinomatosis. Together, our work uncovers a ribosome-based epigenetic mechanism that facilitates the evolution of malignant GAC and proposes SMYD5 targeting as part of a potential combination therapy to treat this cancer.


Figures

Extended Data Fig. 1 |
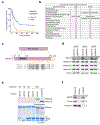
Extended Data Fig. 1 |. SMYD5 is largely dispensable in mice and there is no evidence for SMYD5 having histone methylation activity in vitro or in cells.
a, SMYD5 expression levels in gastric cancer negatively correlate with GAC patient progression free survival (n = 498 patients). P-values determined by log-rank test. b, Summary of full embryonic Smyd5 knockout mice phenotype data from the IMPC (International Mouse Phenotyping Consortium). Smyd5 deletion has no impact on viability and fertility and mice have only minor phenotypes as shown in the table. c, Top, main domain structure of SMYD5. SMYD5, like the four other SMYD family members (SMYDs 1–4), contains a catalytic methyltransferase SET domain that is disrupted due to insertion of a MYND domain. When the protein folds, the two parts of the SET domain form a continuous functional domain as shown. Bottom, alignment of the putative catalytic region of SMYD5 with the catalytic regions of SMYD2 and SMYD3. Grey box, homology, or similarity. Red box, catalytic tyrosine in SMYD2 and SMYD3 that was used to generate a catalytic mutant for SMYD5. d, SMYD5 depletion has no effect on the levels of H3K36me3 and H4K20me3 in three different human cell lines. Western blots with the indicated antibodies of WCEs from control or SMYD5-depleted A549, KKLS, and U2OS cells. Total H3 and tubulin are shown as loading controls. e, SMYD5 does not methylate free histones, octamers, or nucleosomes in vitro. In vitro methylation assays with the indicated enzymes and substrates. H3: free histone H3; H4: free histone H4; Oct: recombinant octamers (2 each of H2A, H2B, H3 and H4); rNuc: recombinant nucleosome. SETD2 and SUV420H1 are included as positive controls for methylation of H3K36 and H4K20, respectively. Note that SUV420H1’s preferred substrate is H4K20me1 nucleosome and as indicated, H4K20me1 nucleosomes were used in the SUV420H1 methylation assays. Top panel, 3H-SAM was used as methyl donor and the methylation was visualized by autoradiography. Bottom panel, Coomassie stain of proteins present in the in vitro reactions. f, SMYD5 localizes to the cytoplasm. Western blots with the indicated antibodies of biochemically separated 293 T WCEs into nuclear and cytoplasmic fractions. Tubulin and H3 are shown as controls for the integrity of the fractionation with Tubulin exclusively present in cytoplasmic fractions and H3 exclusively present in nuclear fractions.
Extended Data Fig. 2 |
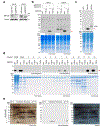
Extended Data Fig. 2 |. Purification of SMYD5 catalytic activity in cell lysates to identify UBA52 as candidate substrate.
a, Western blots of WCEs from control or SMYD5-depleted KKLS and U2OS cells used in b as substrates. b, SMYD5 methylates a ~ 10 kDa protein in KKLS and U2OS cell lysates. In vitro methylation assays as in Fig. 1d with the indicated enzymes and WCEs in a as substrates. c, The candidate SMYD5 substrate migrates faster than histone H4. In vitro methylation reactions as in b with the indicated KMT enzymes or GST alone as a negative control using SMYD5-depleted A549 WCEs as substrates as in Fig. 1d. Red arrowhead, SMYD5-dependent methylated protein. Blue arrowhead, SETD8-dependent histone H4 methylated at K20. d, Substantial enrichment of SMYD5-dependent methylated protein in extracts at 4th fractionation step (see schematic Fig. 1e). In vitro methylation assays as in Fig. 1d with the indicated enzymes using as substrate SMYD5-depleted A549 WCE, Input (lysate after 3 fractionation steps: (1) cytoplasmic isolation, (2) ammonium sulfate salt precipitation, and (3) hydrophobic interaction chromatography), and the indicated fractions (1–13) of the input material separated by size-exclusion chromatography. The Coomassie staining demonstrates the enrichment of the activity relative to total proteins present in the starting material. The region around the ~10 kDa band signal in Fraction 13, which showed the highest degree of purification, was analyzed by mass spectrometry (See Supplementary Tables 1–4). e, 2D gel electrophoresis separation of Fraction 13 in d further purifies the SMYD5-dependent methylated ~10kD protein. Red asterisk, SMYD5-dependent methyl band. The region around the red asterisk was analyzed by mass spectrometry to obtain UBA52 as the top hit. Left: Silver stain of 2D separation of Fraction 13 proteins; Middle: 3H-SAM was used as methyl donor and the methylation was visualized by autoradiography. Right: merge of the two panels.
Extended Data Fig. 3 |
Extended Data Fig. 3 |. SMYD5 specifically methylates rpL40 and has no activity on many other putative substrates in vitro.
a, The sequence of human rpL40 protein surrounding lysine 22. The site of methylation at K22 is indicated. Due to the many charged residues and the specific residues surrounding K22, irrespective of proteases, it is challenging to obtain suitable peptides for MS-based identification. b, SMYD5 methylates recombinant un-cleaved UBA52 protein in vitro. c, SMYD5 methylates recombinant rpL40 but not ubiquitin alone. d, Besides UBA52, SMYD5 did not in vitro methylate several other candidate proteins identified as potential candidates by MS/MS analysis of fraction 13 described in Extended Data Fig. 2d. e, SMYD5 does not in vitro methylate HIV-1 Tat protein. rpL40 is shown as a positive control.
Extended Data Fig. 4 |
Extended Data Fig. 4 |. Generation of a specific rpL40K22me3 antibody and evidence that SMYD5 is the principal enzyme that physiologically generates rpL40K22me3.
a, rpL40K22me3 antibody recognizes cognate methylated peptide sequence but not unmethylated peptide. Dot blot analysis with the indicated rpL40 peptides spanning amino acids (16–26) at the indicated concentrations probed with the rpL40K22me3 antibody (top) or stained with Ponceau S (bottom) to control for loading. b, rpL40K22me3 antibody recognizes cognate methylated peptide sequence but does not recognize several other histone and non-histone peptides harboring trimethylation. Dot bot analysis as in a. c, Western blot with the rpL40K22me3 antibody of in vitro methylation reactions with the indicated enzyme and substrates. d-e, Western blots with the indicated antibodies of WCEs from d, LMSU and e, SH-10-TC cell lines expressing CRISPR-Cas9 and two independent sgRNAs targeting SMYD5 or a control sgRNA. Tubulin was used as loading control. f, Western blots of SMYD5-depleted LMSU cells complemented with CRISPR-resistant SMYD5WT, SMYD5Y351A catalytic mutant, or control plasmid. g, Western blots with indicated antibodies of sucrose-cushion purified ribosome-depleted cytoplasmic lysates and ribosomes-enriched fractions from KKLS cells.
Extended Data Fig. 5 |
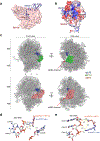
Extended Data Fig. 5 |. Alphafold analysis of SMYD5-rpL40 interaction and structural analysis of rpL40 in human ribosomes.
a-b, UBA52 + SMYD5 predicted structures (AlphaFold v2.3; see Methods) a, UBA52/rpL40 depicted by blue cartoon and SMYD5 by red molecular surface, as indicated. K22 of rpL40 the SMYD5 catalytic tunnel-forming residue (Y351) are shown. K22 of rpL40 directly inserts into SMYD5’s catalytic tunnel. b, UBA52 + SMYD5 predicted structures coloured by electrostatic charge. Colouring key depicts predict Coulombic electrostatic potential, with red corresponding to negative charge and blue corresponding to positive charge. rpL40 substrate lysine K22 and SMYD5 catalytic Y351 are shown. c-e, Ribosome-bound rpL40 undergoes rearrangements through different stages of elongation factor association. c, Top, ribbon representation of the overall complex of human 80 S ribosomes bound to eEF1A (PDB: 6ZMO), bottom, human 80 S ribosomes bound to eEF2 (PDB: 6D9J). rpL40, eEF1A and eEF2 are shown in surface representations and differentially coloured as indicated. d-e, close-up view of potential intermolecular interaction between rpL40K22 and adjacent 28 S rRNA. Distances are provided of hydrogen-bonding interactions depicted as dashed lines. d, rpL40K22 (shown in blue) from apo human 80 S ribosome structure (PDB: 4UG0) that is not bound to initiation/elongation factors and has close interactions with the 28 S rRNA at bases C4412 and C4413. rpL40K22 (shown in red) from 80 S ribosome bound to eEF1a (PDB: 6ZMO) leads to a shift in K22 of 5.3 Å toward an ionic interaction with G1945 of the 28 S rRNA. e, as in d but replacing eEF1A with 80 S ribosome bound to eEF2 (PDB: 6D9J), rpL40K22 shifts by 6.6 Å in favor of more distant interactions with G4411.
Extended Data Fig. 6 |
Extended Data Fig. 6 |. SMYD5 regulates ribosome dynamics and mRNA translation programs.
a, Western blots with the indicated antibodies of WCEs from the KKLS cells used in Fig. 2b. b, Ratio of area under polysomes (P) and monosome (M) peaks as in Fig. 2c from polysome profiling experiments of control or SMYD5-depleted LMSU cells fractionated on 10%–50% sucrose gradients are calculated and presented as P/M ratio from three independent biological replicates. P-value was determined by two-tailed unpaired t-test. c, Western analysis with the indicated antibodies of the indicated fractions from the polysome profiling experiments in KKLS cells as in Fig. 2b. d-e, SMYD5 depletion in LMSU cells leads to reduced global protein synthesis. d, Puromycylation assays in control or SMYD5-depleted LMSU cells. WCEs were probed with the indicated antibodies. e, AHA labeling assays as in (d). WCEs were probed with the indicated antibodies or HRP-strepavidin was used to detect biotin-clicked AHA. f, Linear regression analysis of ribosome half-transit time in control or SMYD5-depleted KKLS cells. PMS, post-mitochondrial supernatants (complete + nascent proteins); PRS, post-ribosomal supernatant (complete proteins). A representative graph is shown from four independent biological replicates. g, Summary of sequencing reads distribution mapped to the indicated categories. h, Principal component analysis (PCA) of the indicates datasets. i, Quality assessment of reads distribution across gene bodies, the absence of 3’ and 5’ bias indicates absence of high levels of RNA degradation (see Methods for g-i). j, GSEA analysis identifies the top significantly enriched signatures (Hallmark, KEGG, and selected) in differential polysome-associated mRNAs from Control versus SMYD5-depleted KKLS cells data sets (n = 3 biologically independent samples per group). Normalized enrichment scores (NES) and nominal P-values are shown. k, Westerns of the indicated proteins in control or SMYD5-depleted cell lines or GAC PDX samples as indicated (for KKLS, Western is representative of data from Fig. 2j). l, Quantification of Western signal (top row) and mRNA by RT-PCR (bottom row) for the indicated genes in the indicated cell lines ±SMYD5 as indicated. Data are represented as mean ± s.e.m. of three independent biological replicates.
Extended Data Fig. 7 |
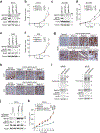
Extended Data Fig. 7 |. SMYD5 and rpL40 K22me3 promote cancer cell proliferation.
a-f, SMYD5 depletion inhibits proliferation of KKLS (a,b), NCI-N87 (c,d) and AGS (e,f) cells. a, c, e, Western blots with the indicated antibodies of the indicated WCEs expressing CRISPR-Cas9 and two independent sgRNAs targeting SMYD5 or a control sgRNA. b, d, f, proliferation of cells shown in a, c, e, respectively. Data are represented as mean ± s.e.m from three biologically independent experiments. P-values were determined by two-tailed unpaired t-test. g, Representative immunohistochemical staining with rpL40 antibody of patient samples from normal gastric tissue (n = 12), GAC at advancing stages (n = 48 (stage I/II), 72 (III) and 16 (IV)) and GAC metastasis at the indicated organs (n = 34), scale bars: 100 μm. h, Representative immunohistochemical staining with rpS6 and rpL3 antibody of patient samples from normal gastric tissue (n = 12) and GAC at advancing stages (n = 48 (stage I/II), 72 (III) and 16 (IV)), scale bars: 100 μm. i, Puromycylation assays in control or SMYD5-depleted WI-38 (left), IMR-90 (right) cells. WCEs were probed with the indicated antibodies. j, Western blot analysis with the indicated antibodies of lysates from SMYD5-depleted KKLS gastric cancer cells complemented with CRISPR-resistant SMYD5WT or SMYD5Y351A. k, Tumor volume quantification for KKLS xenografts modified to express sgRNA SMYD5 or sgRNA control and overexpressing CRISPR-resistant SMYD5WT or catalytically deficient SMYD5Y351A as indicated (see j for Western blot analyses) in NSG mice (n = 5 mice, for each treatment group). P-values were calculated by two-way ANOVA with Tukey testing for multiple comparisons. Data are represented as mean ± s.e.m.
Extended Data Fig. 8 |
Extended Data Fig. 8 |. SMYD5 deletion represses malignant GAC tumorigenesis in vivo.
a, Representative IHC staining of gastric tumors from KPPC and KPPA models exhibit key histological features of human GAC, including positive staining for cytokeratin 7 (CK7) and CDX2 (representative of n = 9 samples for each group). Scale bars, 100 μm. b, Representative HE-stained section of gastric cancer lymph node, liver, and lung metastasis observed in KPPC and KPPA models. Scale bars, 100 μm. c, Schematic of the Smyd5LoxP/LoxP conditional allele. In the presence of Cre recombinase, exon 2 is deleted to disrupt Smyd5 expression. d, Confirmation of Smyd5LoxP/LoxP conditional allele by PCR on DNA isolated from mouse tailbiopsies from indicated mouse genotypes, expected product sizes are marked. e, Left: Selected ion chromatograms for non-, mono-, di- and tri-methyl rpL40K22 peptides from Chymotrypsin digestion of endogenous rpL40 immunoprecipitated from biopsies from normal stomach tissue and GAC KPPC tissue. Note the Y axis scales for relative abundance are different between normal and tumor samples (see right panel for comparison of abundance of rpL40K22me3 peptides between normal and tumor samples). HPLC elution profiles show a 10-ppm mass window around expected peptide masses (peptide sequence ICRKCY, K22 is underlined; m/z are 300.4791, 305.1509, 309.8228, and 314.4947). Right: ion chromatograms for trimethyl rpL40K22 peptides as in the left panel using the Y axis scale from the tumor sample. Arrow indicates the relevant peak as in the left panel. f, Representative immunohistochemical staining and quantification of MYC and CD45 positive cells in gastric tumors from KPPC and KPPC;Smyd5 mutant mice at 6 weeks after tamoxifen induction (representative of n = 9 mice for each experimental group). Scale bars 100 μm. g, Representative HE-stained sections of gastric cancers at endpoint (severe morbidity) from KPPC and KPPA models indicate malignant histopathology with notable cancer cell invasion through basement membrane (dash line area with magnification). Scale bars 100 μm. h, Representative HE-stained sections, immunohistochemical staining with indicated antibodies and quantification of MYC and CD45 positive cells in gastric tumors from KPPA and KPPA;Smyd5 mutant mice at 6 weeks after tamoxifen induction (representative of n = 9 mice for each experimental group). Scale bars 100 μm. i, Westerns of the indicated proteins in tissue biopsy lysates from KPPC and KPPC;Smyd5 mutant mice. j, Quantification of Western signal (top) and mRNA by RT-PCR (bottom) for the indicated genes in tissue biopsy lysates from KPPC and KPPC;Smyd5 mutant mice. Data are represented as mean ± s.e.m. of three (Western) or four (RT-PCR) independent replicates. k, Dose-response analysis and half maximal inhibitory concentration values (IC50) for Omipalisib in LMSU GAC cell line ±SMYD5 knockdown. Data are represented as mean ± s.e.m. from three independent biological replicates. l, Western blot analysis with the indicated antibodies of WCE of control and SMYD5-depleted NUGC4 gastric cancer cell line. Boxes: 25th to 75th percentile, whiskers: min. to max., center line: median.
Extended Data Fig. 9 |
Extended Data Fig. 9 |. Analysis of therapeutic efficacy of PD1 and Mesothelin (MSLN)-CAR T cells immunotherapies against gastric cancer cells.
a, Representative bioluminescence imaging of syngeneic peritoneal carcinomatosis allograft model established in syngeneic mice from KPPC peritoneal metastases cells ±SMYD5 to test the efficacy of PD1 therapy. Animals were treated with ±PD1 (10 mg/kg, twice per week) and ±Omipalisib (4 mg/kg, daily) and tumor growth was monitored by bioluminescence imaging (n = 5 mice per group). b, Waterfall plot of KPPC ± SMYD5 allograph bioluminescence signal changes in individual mice receiving the indicated therapies (n = 5 mice per group). c, Kaplan-Meier survival curves of KPPC ± SMYD5 allograph receiving the indicated treatments. P-values were determined by log-rank test for significance. n = 5 mice per group. d, MSLN-CAR expression vector design containing truncated human nerve growth factor receptor (tNGFR), self-cleaving P2A peptide sequence followed by MSLN-specific scFv (SS1), the CD8a hinge, transmembrane, and CD28-CD3ζ co-stimulatory domain. tNGFR serves as a cell surface reporter to enable specific detection of CAR-expressing cells by flow cytometry. The right panel shows a representative flow cytometry plot identifying MSLN-CAR expressing T cells using NGFR staining. e, MSLN is a cell-surface glycoprotein expressed in NUGC4, LMSU cell lines and GAC-PDX cells as detected by flow cytometry. f, MSLN-CAR T cells co-cultured with MSLN+ NUGC4 cells shows selective killing of MSLN+ target cancer cells. Data are represented as mean ± s.e.m. from three independent biological replicates. g, MSLN-CAR T cells co-cultured with MSLN+ NUGC4 target cancer cells and analyzed for intracellular IL−2, IFN-γ and TNF-α cytokine levels by flow cytometry indicative of CAR T cell activation by MSLN+ target cells stimulation. Representative of three independent experiments is shown.
Extended Data Fig. 10 |
Extended Data Fig. 10 |. SMYD5 ablation or treatment with Omipalisib does not negatively impact CAR T cells efficacy and SMYD5 genetic alterations and mRNA expression in diverse cancers.
a, T cells isolated from Smyd5LoxP/LoxP conditional knockout were transduced with retrovirus expressing Cre- recombinase (Smyd5−/−) or mock control (wildtype). SMYD5 depletion was validated with rpL40 K22me3 specific antibody by flow cytometry. Representative of three independent experiments. b, Wildtype and Smyd5 deleted T cells exhibit similar distribution of naive (Tnaive; CD62L+CD44), central memory (Tcm; CD62L+CD44+), effector memory (Tem; CD62LCD44+) and CD62LCD44 cell subsets. Data are represented as mean ± s.e.m. from three independent biological replicates. c, SMYD5 ablation in T cells does not significantly change the rate of apoptosis as assessed by Annexin V flow cytometry analysis. Data are represented as mean ± s.e.m. from three independent biological replicates. P-values were determined by a two-tailed unpaired t-test. d, MSLN-CAR T cells were generated from Smyd5LoxP/LoxP conditional knockout by transduction with retrovirus expressing CAR and Cre- recombinase (CAR T Smyd5−/−) or CAR only control (CAR T wildtype). SMYD5 depletion was validated with rpL40K22me3 specific antibody by flow cytometry. Representative of three independent experiments. e, Depletion of SMYD5 deletion does not inhibit MSLN-CAR T cells cytotoxicity against MSLN+ NUGC4 gastric cancer target cells. Data are represented as mean ± s.e.m. from three independent biological replicates. P-values were determined by a two-tailed unpaired t-test. f, Wildtype and Smyd5 deleted MSLN-CAR T cells exhibit similar distribution of naive (Tnaive; CD62L+CD44), central memory (Tcm; CD62L+CD44+), effector memory (Tem; CD62LCD44+) and CD62LCD44 cell subsets. Data are represented as mean ± s.e.m. from three independent biological replicates. g, Depletion of SMYD5 does not significantly impact MSLN-CAR T cells apoptosis (Annexin V staining) or intracellular IFN-γ and TNF-α cytokine levels analyzed by flow cytometry following co-culture with MSLN+ NUGC4 target cells for 6 h. Data are represented as mean ± s.e.m. from three independent biological replicates. P-values were determined by a two-tailed unpaired t-test. h, Dose-response analysis and half maximal inhibitory concentration values (IC50) for Omipalisib in NUGC4 cells and CAR T cells shows that Omipalisib treatment more strongly suppresses SMYD5-depleted vs. control NUGC4 viability and has a much weaker impact on MSLN-CAR T cell viability at concentrations that effectively impact NUGC4 viability. Data from three independent biological replicates. i, Omipalisib treatment does not negatively impact MSLN-CAR T cell functions. CAR T cells were treated with Omipalisib at a concentration of 0.1 μM for 8 h, followed by co-culture with MSLN+ NUGC4 gastric cancer target cells for 6 h. Cell proliferation (cytoblue), apoptosis (Annexin V) and intracellular IFN-γ and TNF-α cytokine levels were analyzed by flow cytometry. Data are represented as mean ± s.e.m. from three independent biological replicates. P-values were determined by a two-tailed unpaired t-test. j, NUGC4 PC xenografted animal weight measurements over the course of the indicated treatments up to 63 days (as in Figs. 5e–g and i–l). Data are represented as mean ± s.e.m. of n = 5 mice per group. k, Copy number gain is the most frequent genetic alternation of SMYD5 present in common tumor types (TCGA data). l, SMYD5 expression relative to normal samples is elevated across diverse cancer types (TCGA data).
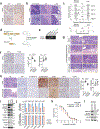
Fig. 1 |
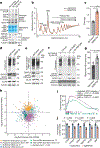
Fig. 1 |. The principal physiological activity of SMYD5 is rpL40K22 methylation.
a, SMYD5 overexpression in GAC versus normal stomach tissue (data from The Cancer Genome Atlas (TCGA); n = 412 patients). b, SMYD5 expression negatively correlates with survival for patients with GAC (n = 640). P values determined by log-rank test. c, Western blots with indicated antibodies of whole cell extracts (WCEs) from A549 cells treated with sgRNA against SMYD5 (sgSMYD5) or control sgRNA (sgControl). d, SMYD5 methylates an approximate 10 kDa protein in WCEs. In vitro methylation assays with recombinant wild-type SMYD5 (SMYD5(WT)) or catalytically dead SMYD5 (SMYD5(Y351A)) using indicated WCEs shown in c as the substrate. Top, 3H-SAM was used as the methyl donor and methylation was visualized by autoradiography. Bottom, Coomassie stain of proteins present in reactions. e, Schematic to enrich the SMYD5-dependent methylated band, with the top hit UBA52 indicated. CV column volumes; KD, knockdown; MS, mass spectrometry. f, UBA52 encodes a precursor protein that is cleaved by deubiquitinase (DUB) into monoubiquitin and rpL40, a 60S large subunit component trimethylated at K22. g,h, SMYD5 specifically methylates rpL40K22. In vitro methylation assays as in d using indicated enzymes and substrates. i, SMYD5 methylates rpL40, but not histones. In vitro methylation assays as in d with indicated enzyme and substrates. Oct, histone octamer; rNuc, recombinant nucleosome. SETD2 and SUV420H1 are positive controls for the methylation of H3K36 and H4K20, respectively. j, Western blots with the indicated antibodies of SMYD5-depleted KKLS WCEs using two independent SMYD5 sgRNAs. Asterisk indicates a nonspecific band. Tubulin was used as the loading control. k, Trimethylation is the predominant methylation state at rpL40K22 in KKLS cells and is depleted after SMYD5 knockdown. Selected ion chromatograms for non-, mono-, di- and tri-methyl rpL40K22 peptides are shown. HPLC elution profiles show a 10-ppm mass window around expected peptide masses (peptide sequence ICRKCY, K22 is underlined; m/z: 300.4791 (me0), 305.1509 (me1), 309.8228(me2) and 314.4947 (me3)). l, Western blots of SMYD5-depleted KKLS cells complemented with CRISPR-resistant SMYD5(WT), SMYD5(Y351A) or control plasmid.
Fig. 2 |
Fig. 2 |. SMYD5 methylation of rpL40K22 regulates elongation rates and protein synthesis.
a, rpL40K22me3 loss does not affect ribosome biogenesis. Indicated pre-rRNA (top: northern blot) and mature rRNAs (middle: methylene blue) levels from indicated cell lines. Bottom, western blot of WCEs as indicated. Northern blot probe (5520) targets the 5′-ITS1 pre-rRNA region. b, Polysome profiles of KKLS cell extracts with or without SMYD5 depletion. 40S and 60S ribosomal subunits, 80S monosome and light (≤3 ribosomes) and heavy (>3 ribosomes) polysome distribution is indicated (western blots in Extended Data Fig. 6a). c, P/M ratio as in b. d,e, SMYD5 depletion reduces global protein synthesis. d, Puromycylation assays in KKLS cells with or without SMYD5 depletion. WCEs were probed with the indicated antibodies. e, AHA labelling assays as in d. HRP–streptavidin (HRP–strep) detects biotin-clicked AHA. f, rpL40(K22R) substitution reduces global protein synthesis. Puromycylation assays and western blots of WCEs in control or rpL40-depleted LMSU cells complemented with CRISPR-resistant rpL40(WT), rpL40(K22R) or control plasmids. g, SMYD5 depletion decreases mRNA translation elongation rates. Ribosome half-transit time in the indicated cell lines. h, rpL40K22me3 regulation of polysome-associated mRNAs. Polysome association, mRNAs differentially associated (up/down) with polysomes without total mRNA abundance changes. Buffering mRNA, total mRNA up/down without corresponding changes in polysome association. Total mRNA abundance, total mRNA increased/decreases with congruent changes in polysome association. Background, mRNAs with no significant change. i, GSEA identifies enrichment of MYC targets and ribosome gene signatures in differential polysome-associated mRNAs from control versus SMYD5-depleted KKLS cells (n = 3 biologically independent samples per group). Normalized enrichment scores (NES) and nominal P values are provided (Methods). j, Quantification of indicated protein levels in KKLS cells with or without SMYD5 depletion. See Extended Data Fig. 6k,l for representative western blots and mRNA levels. P values determined by two-tailed unpaired t-test (c,g,j). Data are the means ± s.e.m. of three (c,j) or four (g) independent biological replicates.
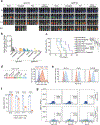
Fig. 3 |
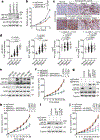
Fig. 3 |. The SMYD5–rpL40me3 axis is upregulated in gastric cancer and promotes GAC cell xenograft and PDX tumour growth in vivo.
a,b, SMYD5 depletion inhibits LMSU cell proliferation. a, Western blots with indicated antibodies of WCEs with or without SMYD5 depletion. b, Proliferation rates of cells in a from three biologically independent experiments. c, Representative rpL40K22me3 IHC staining of patient samples from normal gastric tissue (n = 12), GAC at advancing stages (I–II, n = 48; III, n = 72; IV, n = 16) and metastasis at indicated organs (n = 34). Scale bars, 100 μm. d, Quantification of IHC chromogen stain intensity for rpL40K22me3, rpL40, rpS6 and rpL3 as indicated in normal gastric tissue (n = 12) and advancing stages of GAC (I–II, n = 48; III, n = 72; IV, n = 16). Red line indicates median. e, Western blot analyses showing that SMYD5, rpL40K22me3 and total rpL40 levels are higher in four different GAC cell lines than in non-transformed IMR-90 and WI-38 cell lines. f, SMYD5 catalytic activity is required for full LMSU xenograft tumour growth. Tumour volume quantification for LMSU xenografts was modified to deplete endogenous SMYD5 (sgSMYD5) and overexpressing CRISPR-resistant SMYD5(WT) or SMYD5(Y351A) (see Extended Data Fig. 4g for western blot analyses) in NSG mice (n = 6 mice per group). g, Western blot analysis with the indicated antibodies of GAC PDX CDH1A617TTP53X307_splice WCEs modified ex vivo to express sgSMYD5 or sgControl and overexpressing CRISPR-resistant SMYD5(WT) or SMYD5(Y351A) as indicated. h, Tumour volume quantification for GAC PDX CDH1A617TTP53X307_splice xenografts as in g in NSG mice (n = 6 mice per group). i, Western blot analysis with the indicated antibodies of WCEs of rpL40-depleted LMSU cells complemented with CRISPR-resistant rpL40(WT) or rpL40(K22R). j, Tumour volume quantification for LMSU xenografts as in i in NSG mice (n = 6 mice per group). P values determined by two-way analysis of variance (ANOVA) with Tukey’s post hoc test (d,f,h,j) or two-tailed unpaired t-test (b). Data are represented as the mean ± s.e.m. (b,f,h,j).
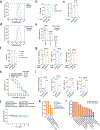
Fig. 4 |
Fig. 4 |. SMYD5 ablation inhibits malignant gastric cancer progression in vivo.
a, Schematic of generation of familial (KPPC) and spontaneous (KPPA) mouse models of GAC with Smyd5 deletion. Tamoxifen-induced recombination of mutant alleles is mediated using a gastric-specific Anxa10creErt2 strain. b, Experimental design to assess effects of SMYD5 ablation on GAC pathogenesis in KPPC and KPPA models. c, Western blot analysis with indicated antibodies of representative lysates of tissue biopsies from normal stomach and GAC from KPPC mice. d, Western blot analysis with indicated antibodies of representative lysates of tumour biopsies from indicated mouse models at 6 weeks after tamoxifen induction. Vinculin and total H3 are shown as loading controls. e, Representative macro pathology, H&E and IHC staining with indicated antibodies of gastric tumours from KPPC and KPPC;Smyd5 mutant mice at 6 weeks after tamoxifen induction (n = 9 per group). Scale bars, 5 mm (whole mount) and 100 μm (histology). f, Quantification of proliferation (Ki67+), cell death (cleaved caspase-3+) in KPPC and KPPC;Smyd5 samples as in e. g, Kaplan–Meier survival curves of KPPC control mice (n = 9) and KPPC;Smyd5 mutant mice (n = 9). h, Clinical spectrum of malignant gastric cancer in KPPC models with or without SMYD5 ablation, including observed frequency of regional lymph nodes and distant organ metastases. i, Quantification of proliferation and cell death as in f in KPPA and KPPA;Smyd5 samples (n = 9 per group) (Extended Data Fig. 8h). j, Kaplan–Meier survival curves of KPPA control mice (n = 11) and KPPC;Smyd5 mutant mice (n = 8). k, Clinical spectrum of malignant gastric cancer in KPPA model with or without SMYD5 ablation, including observed frequency of regional lymph nodes and distant organs metastases. P values determined by two-tailed unpaired t-test (f,i) or log-rank test (g,j). Boxes indicate 25th to 75th percentiles, whiskers the minimum to maximum values, and the centre line the median.
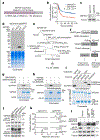
Fig. 5 |
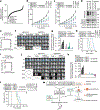
Fig. 5 |. SMYD5 depletion cooperates with PI3K–mTOR inhibitors and CAR-T therapeutics to treat malignant GAC.
a, Comparative drug screen identifies potential synergy between PI3K–mTOR inhibitors and SMYD5 depletion (Supplementary Table 5). Several top hits are indicated. b,c, Quantification of tumour growth in LMSU xenograft (b) and CDH1A617TTP53X307_splice GAC PDX (c) with or without SMYD5 depletion in NSG mice treated with omipalisib (4 mg kg−1 daily, n = 5 mice per group) or vehicle control. d, Puromycylation assays in LMSU cells with or without SMYD5 depletion treated with either vehicle or omipalisib (50 nM) for 16 h. WCEs were probed with the indicated antibodies. e, Schematic of PC mouse model experimental design. BLI, bioluminescence imaging; D, day. f, Representative BLI of PC mice receiving indicated treatment (n = 5 mice per group). Scales normalized for all time points. g, Waterfall plot of NUGC4 PC xenograft BLI signal changes at day 21 in individual mice receiving the indicated therapy. h, Kaplan–Meier survival curves of mice with NUGC4 PC xenografts receiving the indicated treatment. i, Experimental design to assess MSLN–CAR-T-cell-based combination therapies in the PC mouse model. j, Representative BLI of PC mice receiving the indicated treatment as in f. k, Waterfall plot as in g with the indicated treatments. l, Triple therapy results in long-term tumour-free survival in the PC model system. Kaplan–Meier survival curves as in h in mice receiving the indicated treatments. Arrow indicates the time the study was completed. sgControl + mock cohort data in jl is the same as in fh. m, Model for the role of SMYD5 in GAC pathogenesis. SMYD5, rpL40 and rpL40K22me3 upregulation in GAC increases oncogenic gene expression programs at the level of protein synthesis, potentially through enhanced elongation. These activities converge with divergent GAC drivers and oncogenic growth signals to promote GAC evolution into malignant disease. SMYD5 inhibition (SYMD5i) may cooperate with targeted (inhibition of PI3K (PI3Ki) and mTOR (mTORi)) and cell-based therapies (CAR-T) to mitigate GAC progression. P values determined by two-way ANOVA with Tukey’s post hoc test (b,c) or log-rank test (h,l). Data represented as the mean ± s.e.m. (b,c).

References

    1. Robichaud N, Sonenberg N, Ruggero D & Schneider RJ Translational control in cancer. Cold Spring Harb. Perspect. Biol 11, a032896 (2019). - PMC - PubMed
    1. Kovalski JR, Kuzuoglu-Ozturk D & Ruggero D Protein synthesis control in cancer: selectivity and therapeutic targeting. EMBO J 41, e109823 (2022). - PMC - PubMed
    1. Baker RT & Board PG The human ubiquitin-52 amino acid fusion protein gene shares several structural features with mammalian ribosomal protein genes. Nucleic Acids Res 19, 1035–1040 (1991). - PMC - PubMed
    1. Morgan E et al. The current and future incidence and mortality of gastric cancer in 185 countries, 2020–40: a population-based modelling study. eClinicalMedicine 47, 101404 (2022). - PMC - PubMed
    1. Hirata Y, Noorani A, Song S, Wang L & Ajani JA Early stage gastric adenocarcinoma: clinical and molecular landscapes. Nat. Rev. Clin. Oncol 20, 453–469 (2023). - PMC - PubMed

MeSH terms