. 2024 Aug;632(8025):664-671.
doi: 10.1038/s41586-024-07720-6. Epub 2024 Jul 24.

Cryo-EM architecture of a near-native stretch-sensitive membrane microdomain

Affiliations

Cryo-EM architecture of a near-native stretch-sensitive membrane microdomain

Jennifer M Kefauver et al. Nature. 2024 Aug.

Abstract

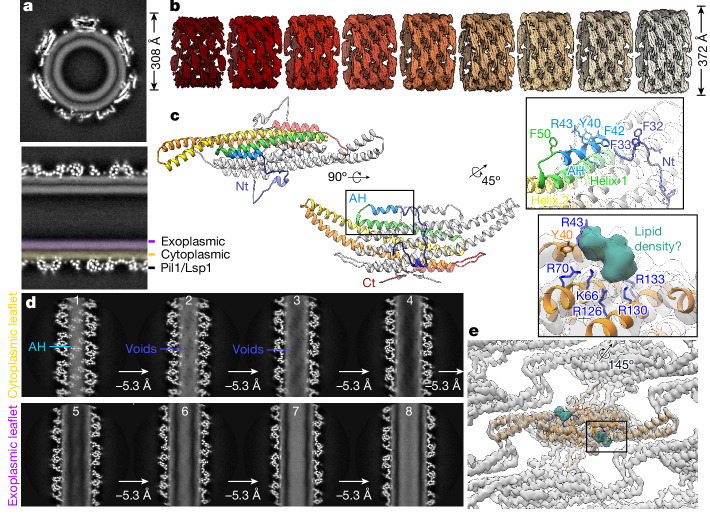
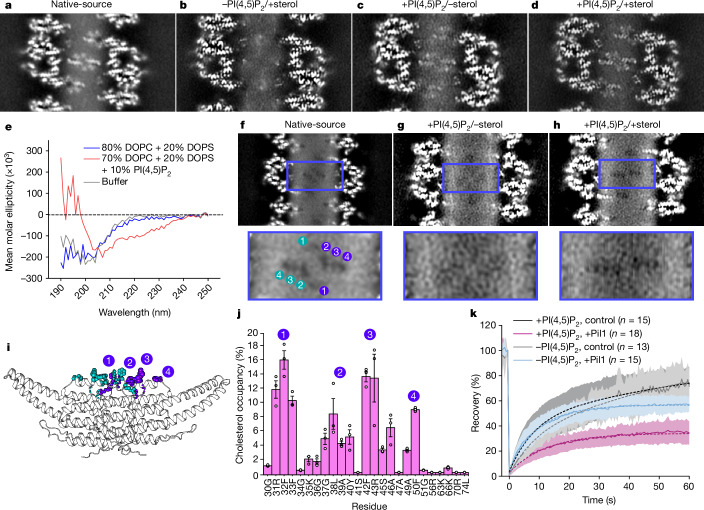
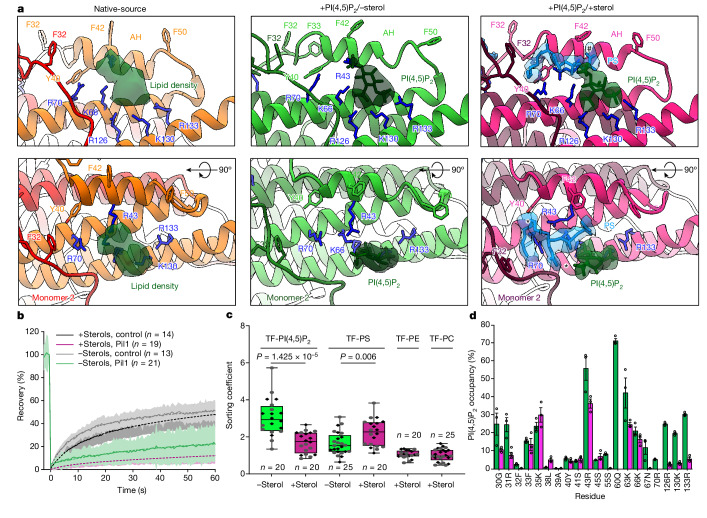
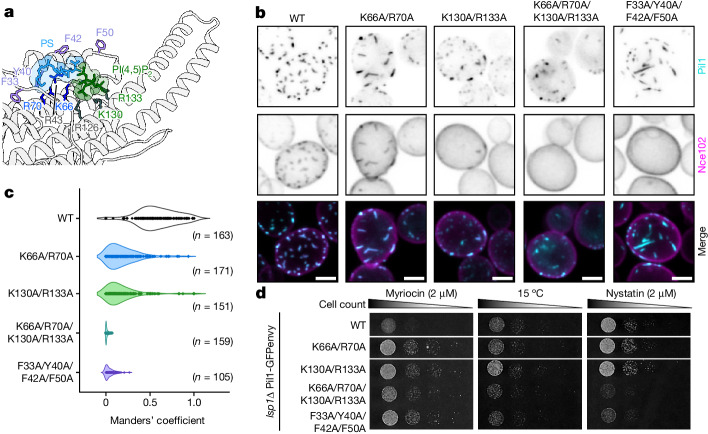
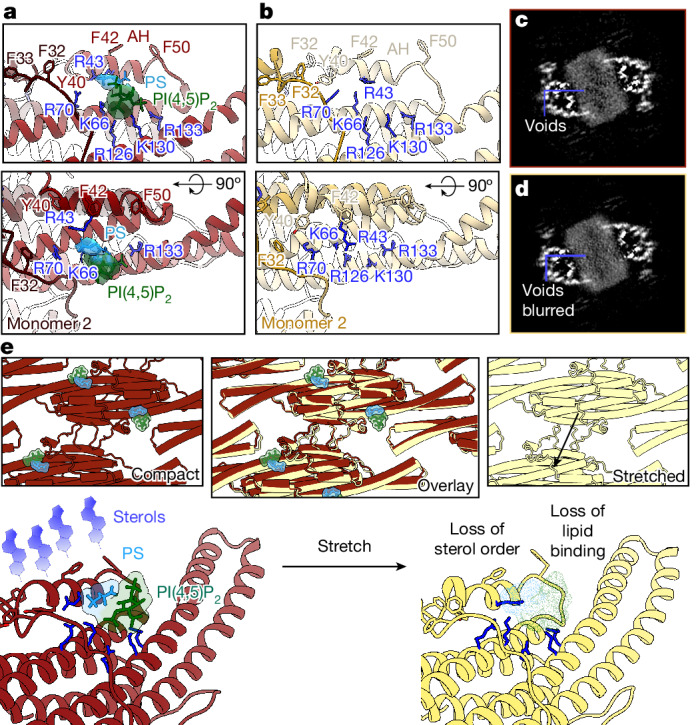
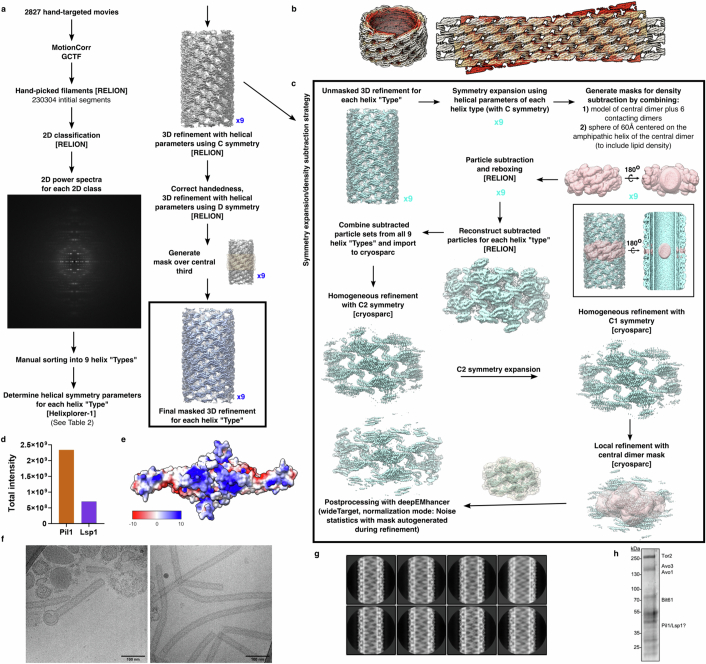
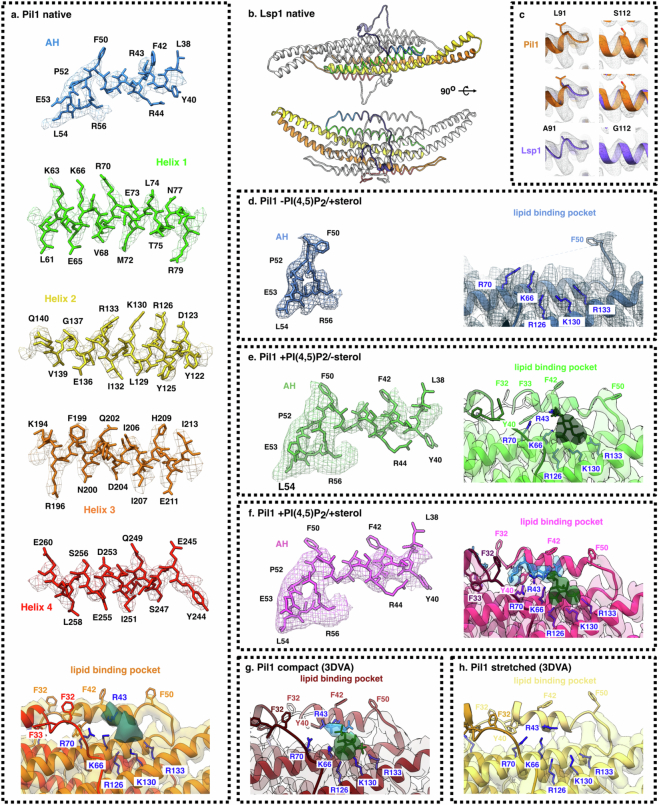
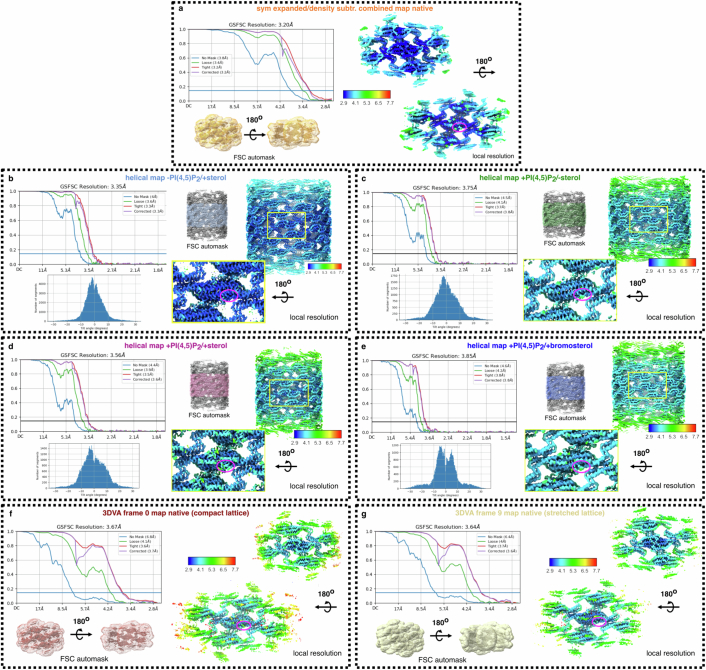
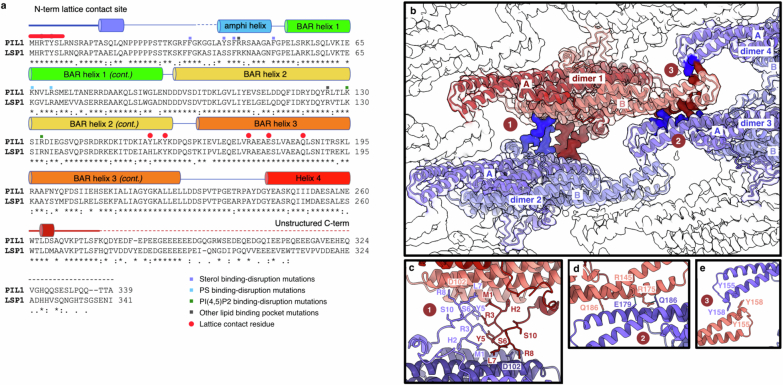
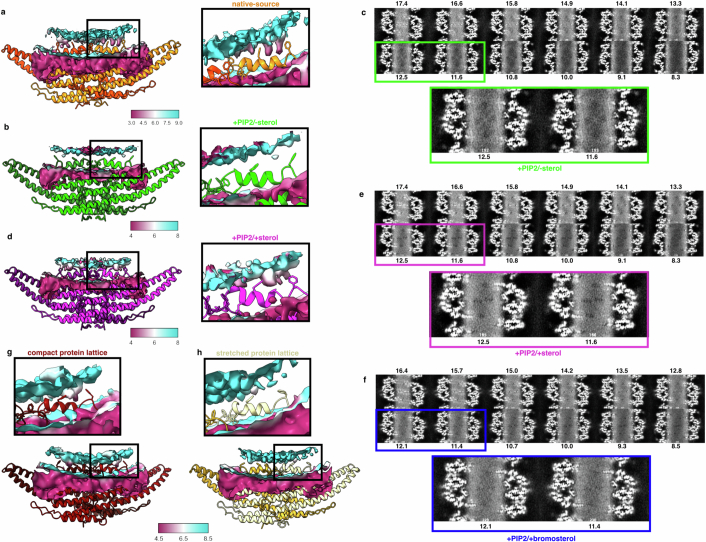
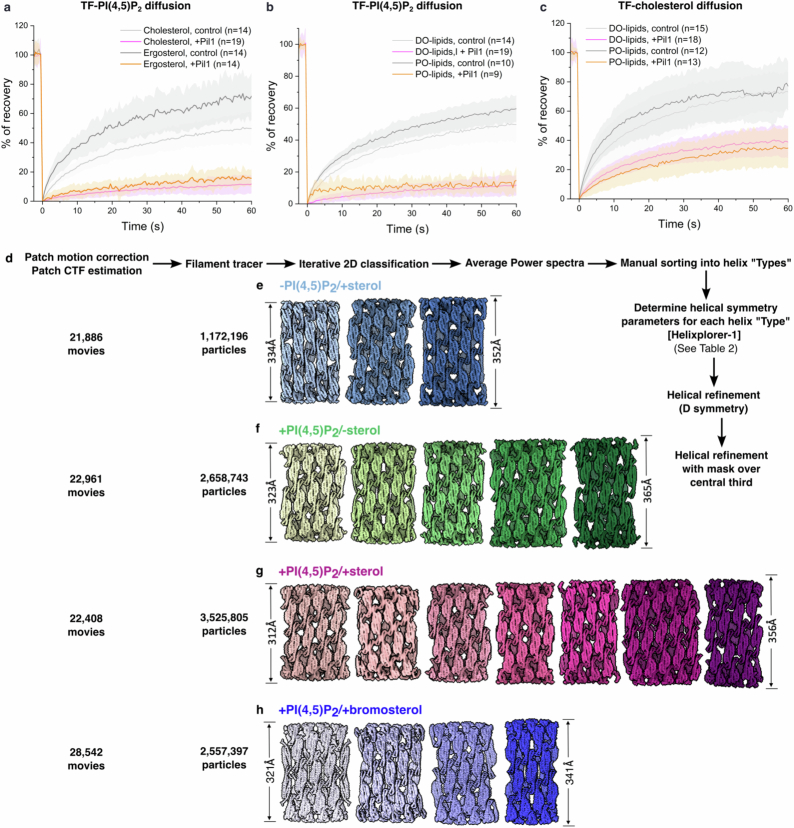
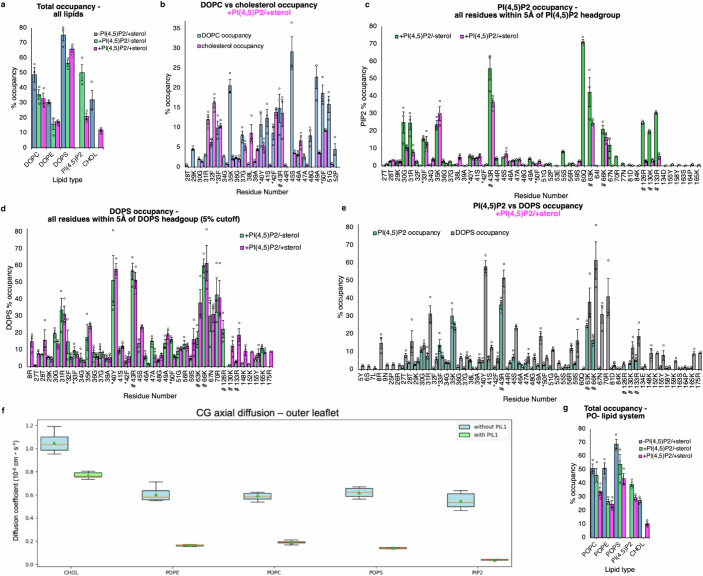
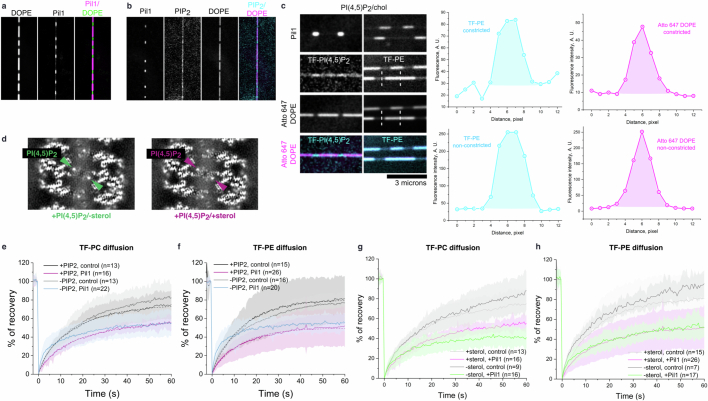
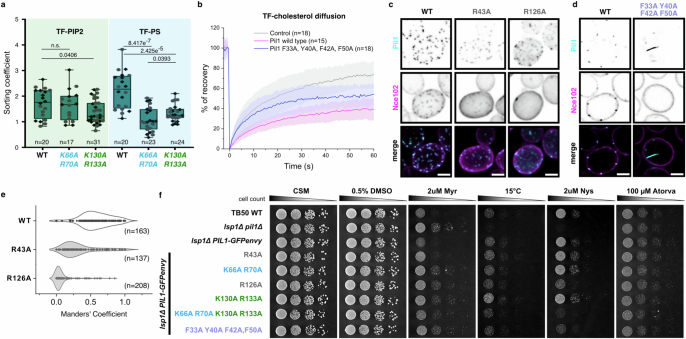
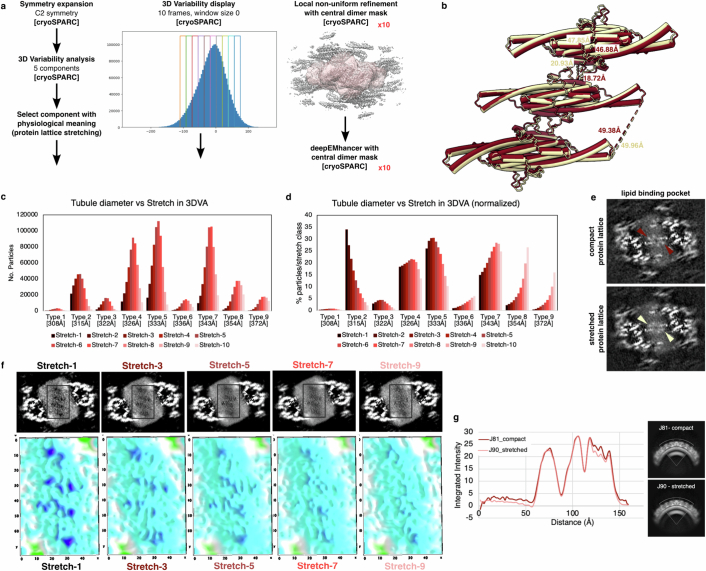
Biological membranes are partitioned into functional zones termed membrane microdomains, which contain specific lipids and proteins1-3. The composition and organization of membrane microdomains remain controversial because few techniques are available that allow the visualization of lipids in situ without disrupting their native behaviour3,4. The yeast eisosome, composed of the BAR-domain proteins Pil1 and Lsp1 (hereafter, Pil1/Lsp1), scaffolds a membrane compartment that senses and responds to mechanical stress by flattening and releasing sequestered factors5-9. Here we isolated near-native eisosomes as helical tubules made up of a lattice of Pil1/Lsp1 bound to plasma membrane lipids, and solved their structures by helical reconstruction. Our structures reveal a striking organization of membrane lipids, and, using in vitro reconstitutions and molecular dynamics simulations, we confirmed the positioning of individual PI(4,5)P2, phosphatidylserine and sterol molecules sequestered beneath the Pil1/Lsp1 coat. Three-dimensional variability analysis of the native-source eisosomes revealed a dynamic stretching of the Pil1/Lsp1 lattice that affects the sequestration of these lipids. Collectively, our results support a mechanism in which stretching of the Pil1/Lsp1 lattice liberates lipids that would otherwise be anchored by the Pil1/Lsp1 coat, and thus provide mechanistic insight into how eisosome BAR-domain proteins create a mechanosensitive membrane microdomain.


Conflict of interest statement

The authors declare no competing interests.

Figures

Fig. 1
Fig. 1. Native-source eisosomes retain an unperturbed plasma membrane microdomain.
a, Central (top, transverse; bottom, sagittal) slices of a helical reconstruction of a native-source MCC–eisosome tubule with the membrane bilayer visible. b, Sharpened maps of nine helical structures of varying diameter. c, Model of the Pil1 dimer. Rainbow colouring on chain A from Nt (blue) to C terminus (Ct; red). Inset, magnified view of the AH. d, Series of one-pixel slices through the helical reconstruction of the native-source eisosome, separated by a depth of approximately 5.3 Å. Cyan label indicates AH (panel 1), violet labels indicate membrane voids (panels 2–3). The void pattern continues through the cytoplasmic leaflet (panel 4) but is absent in the exoplasmic leaflet (panels 5–8). e, Unassigned putative lipid density (sea green) in a deepEMhancer sharpened map localized to the charged pocket. Inset, charged residues coordinating the unassigned density.
Fig. 2
Fig. 2. Sterols are stabilized by the Pil1/Lsp1 AH within the MCC–eisosome membrane microdomain.
ad, Parallel slice at maximum AH density of unsharpened maps of native-source (a), −PI(4,5)P2/+sterol reconstituted (b), +PI(4,5)P2/−sterol reconstituted (c) and +PI(4,5)P2/+sterol reconstituted (d) eisosomes. e, CD spectra reflecting the folding of a synthetic Pil1 AH peptide in the presence of liposomes of the indicated compositions. Lines represent the mean of three experiments. fh, Membrane void pattern within the cytoplasmic leaflet in native-source (f), +PI(4,5)P2/−sterol reconstituted (g) and +PI(4,5)P2/+sterol reconstituted eisosomes (h). Inset images: magnified view of membrane void region. Numbers indicate individual sterol dwell sites for native-source eisosomes (see i). i, CG MD snapshot highlighting residues with cholesterol headgroup occupancy. j, Average per-residue percentage occupancy of cholesterol at AH residues in the +PI(4,5)P2/+sterol system in CG MD simulations (three replicas of 10 μs each), with peaks numbered at sterol dwell sites (see i). Error bars are s.e.m. k, FRAP of TF-cholesterol in samples with or without 1% PI(4,5)P2. Solid lines indicate a mean of n measured nanotubes with s.d. shown. Dashed lines indicate the fitted data. Source Data
Fig. 3
Fig. 3. Reconstitution of purified Pil1 with lipids of known composition enables the identification of structural signatures.
a, Lipid densities in lipid-binding pockets of native-source (orange; lipid density in dark green), +PI(4,5)P2/−sterol reconstituted (lime green; PI(4,5)P2 in dark green) and +PI(4,5)P2/+sterol reconstituted (magenta; PI(4,5)P2 in dark green and PS in dodger blue) eisosome maps. # indicates PS headgroup and * indicates two PS acyl tail chains in the +PI(4,5)P2/+sterol reconstituted (magenta) model. b, FRAP of TF-PI(4,5)P2 in +1% PI(4,5)P2/−sterol (green) and +1% PI(4,5)P2/+sterol (magenta) reconstituted Pil1 tubules. Solid lines indicate a mean of n measured nanotubes with s.d. shown. Dashed lines indicate fitted data. c, Lipid sorting coefficients of TF-PI(4,5)P2 and TF-PS in +1% PI(4,5)P2/−sterol (green) and +1% PI(4,5)P2/+sterol (magenta) reconstituted Pil1 tubules, as well as TF-PE and TF-PC in +1% PI(4,5)P2/+sterol (magenta) reconstituted Pil1 tubules. Box plot elements are defined in the Methods. d, Average per-residue PI(4,5)P2 lipid occupancy for residues less than 5 Å from the PI(4,5)P2 headgroup with greater than 5% occupancy in CG MD simulations (three replicas of 10 μs each). Error bars are s.e.m. Source Data
Fig. 4
Fig. 4. Mutations that impair lipid binding affect the morphology and function of MCC–eisosomes in vivo.
a, Cartoon of the Pil1 lipid-binding pocket. Proposed sterol-binding residues are in violet, PS-binding residues in dodger blue and PI(4,5)P2-binding residues in green. b, Eisosome morphology in lsp1Δ yeast expressing Pil1-GFPenvy with lipid-binding mutations and Nce102–mScarlet-I (summed z-stacks). The merge is summed stacks of Pil1-GFPenvy (cyan) and Nce102-mScarlet-I (magenta) signals. WT, wild type. Scale bars, 2 μm. c, Fraction of Nce102–mScarlet-I colocalizing with Pil1-GFPenvy lipid-binding-impaired mutants in single cells (Manders’ M1 coefficient). The shaded area represents the probability density of the data. d, Growth assays of lsp1Δ yeast expressing Pil1-GFPenvy lipid-binding-pocket mutants. The tagged proteins in bd are expressed from their endogenous locus. Source Data
Fig. 5
Fig. 5. Three-dimensional variability analysis reveals Pil1/Lsp1 lattice stretching and its effects on membrane organization within native-source MCC–eisosomes.
a, Well-defined two-part density (green for PI(4,5)P2 and dodger blue for putative PS) occupying the charged pocket in a deepEMhancer sharpened map of the most compact protein lattice conformation (model in dark red). b, No clear density is observed in the charged pocket in a sharpened map of the most stretched protein lattice conformation (model in light yellow). c,d, Membrane void pattern, or lack thereof, in corresponding slices of unsharpened maps of the most compact protein lattice (c) and the most stretched protein lattice (d) conformation. e, Model illustrating that lattice stretching destabilizes lipid headgroup and sterol binding (compact model in dark red, stretched model in light yellow, PI(4,5)P2 headgroup in green, PS headgroup in dodger blue and sterols in violet).
Extended Data Fig. 1
Extended Data Fig. 1. Purification and cryo-EM data processing of native-source eisosome filaments.
a, Helical reconstruction data processing strategy. b, Unrolled and aligned helical structures of native-source eisosome filaments of different diameters show nearly identical lattice pattern. c, Data processing strategy for symmetry expansion of helical reconstructions d, Total intensity of Pil1 and Lsp1 peptides in mass spectrometry analysis. Intensity ratio of Pil1:Lsp1 is 3.1:1. e, Electrostatic surface prediction of Pil1 model with potentials ranging from −10 kcal*mol−1e−1 (red) to +10 kcal*mol−1e−1 (blue). f, Two representative aligned micrographs with native-source MCC–eisosome tubules and other putative contaminants visible. 2827 micrographs were collected for this dataset. g, Example 2D class averages with varying filament diameters. h, Representative Coomassie staining of protein gel of Bit61-TAP purification of MCC–eisosome tubules. Clear bands for TORC2 complex components Tor2, Avo3, Avo1 and Bit61-TAP are visible. The faint band at ~40 kDa is likely to correspond to Pil1/Lsp1. This protein purification was repeated n > 20 times yielding similar results. See Supplementary Data 4 for raw gel image.
Extended Data Fig. 2
Extended Data Fig. 2. Map-to-model fit.
a, Pil1 native-source eisosome map-to-model fit and lipid-binding pocket bound to unassigned lipid density (green). b, Lsp1 model. c, Fit comparison of divergent residues in Pil1 and Lsp1. d, −PI(4,5)P2/+sterol reconstituted map-to-model fit of unresolved AH and unoccupied lipid-binding pocket. e, +PI(4,5)P2/−sterol reconstituted map-to-model fit of AH and lipid-binding pocket bound to PI(4,5)P2 headgroup (dark green). f, +PI(4,5)P2/+sterol reconstituted map-to-model fit of AH and lipid-binding pocket bound to PI(4,5)P2 (green) and phosphatidylserine (PS; dodger blue) lipids. g, Most compact protein lattice class of 3D variability analysis (3DVA) map-to-model fit of lipid-binding pocket bound to PI(4,5)P2 (green) and putative PS (dodger blue) headgroups. h, Most stretched protein lattice class of 3DVA map-to-model fit of unoccupied lipid-binding pocket.
Extended Data Fig. 3
Extended Data Fig. 3. Map quality and local resolution.
a, Gold standard Fourier shell correlation (GSFSC) plots, auto-generated mask for average resolution determination at FSC 0.143, and local resolution map for symmetry-expanded native-source map. Magenta circle highlights lipid-binding pocket. be, GSFSC plots, helical symmetry error plot, auto-generated mask for average resolution determination at FSC 0.143, and local resolution map for helical maps of −PI(4,5)P2/+sterol (b), +PI(4,5)P2/−sterol (c), +PI(4,5)P2/+sterol (d) and +PI(4,5)P2/+bromosterol (e) reconstituted Pil1 tubules. Magenta circles highlight lipid-binding pocket. f,g, GSFSC plots, auto-generated mask for average resolution determination at FSC 0.143, and local resolution map for 3DVA frame 0 (most compact) (f) and 3DVA frame 9 (most stretched) (g) refined maps. Magenta circles highlight lipid-binding pocket.
Extended Data Fig. 4
Extended Data Fig. 4. Sequence alignment and lattice contact sites.
a, Sequence alignment of S. cerevisiae Pil1 and Lsp1 (MUSCLE) with domain architecture illustrated (dotted lines indicate unstructured regions in native-source MCC–eisosome model). Violet squares indicate sterol-binding residues, dodger squares indicate PS-binding residues, green squares indicate PI(4,5)P2-binding residues, grey squares indicate other lipid-binding-pocket residues, red circles indicate residues that form lattice contacts. be, Lattice contact sites between Pil1 dimers. Previous nanometre-resolution helical reconstructions of reconstituted Pil1 and Lsp1 proteins revealed a lattice pattern that could be fitted with the Lsp1 crystal structure, albeit with unaccounted density at the lattice contact sites. Three regions of contact between the central dimer (red/salmon) and its neighbours (blue/light violet) are clear in our structures (b). The first site of contact is a short stretch of interactions between the well-folded, domain-swapped N-terminus (Nt) of monomer A (res1-8) in the central dimer (red) and the equivalent Nt stretch (res1-8) of monomer B in neighbouring dimer 2 (light violet) (c), including residue S6 which previously shown to be phosphorylated by Pkh1 and important for eisosome assembly in combination with other phosphorylated residues,. The remaining two contact sites are localized to the BAR-domain tips, previously shown to be flexible in crystallographic studies. A stretch of electrostatic interactions between residues 171–186 on helix 3, as well as residue 145 on helix 2, of the BAR domain in monomer A of the central dimer (salmon) and the equivalent residues from monomer B of dimer 3 (blue) forms the second contact site (d). A hydrophobic interaction between Y155 at the tip of BAR-domain helix 2 on monomer A of the central dimer (salmon) with Y158 on monomer B of dimer 4 (light violet), and vice versa, forms a third contact (e).
Extended Data Fig. 5
Extended Data Fig. 5. Sterol void visualization.
a, Membrane density from native-source samples visualized at high threshold to display an inverted topological surface of the cytosolic leaflet, coloured by local resolution (in angstrom). Position of sterol voids, corresponding to droplet-shaped pockets of higher local resolution (magenta), is shown relative to the residues of the AH within the cytosolic leaflet (inset). b, Membrane density from +PI(4,5)P2/−sterol reconstituted samples visualized at high threshold (as in a). Droplet-shaped pockets corresponding to sterol voids are not observed in the +PI(4,5)P2/−sterol zone map (inset). c, Sequence of one-pixel slices through the protein-bound leaflet of +PI(4,5)P2/−sterol samples. Numbers above or below slices indicate distances in angstrom from the bilayer midplane. Coloured boxes highlight slices ~11–12.5 Å from the midplane bilayer and are presented as zoomed inset below. d, Membrane density from +PI(4,5)P2/+sterol reconstituted samples visualized at high threshold (as in a,b). Position of sterol voids, corresponding to droplet-shaped pockets of higher local resolution (magenta), is shown relative to the residues of the AH within the cytosolic leaflet. These pockets can be clearly observed in +PI(4,5)P2/+sterol zone maps (inset). e,f, Sequence of one-pixel slices through the protein-bound leaflet of +PI(4,5)P2/+sterol (e) and +PI(4,5)P2/+bromosterol (f) reconstituted samples. Numbers above or below slices indicate distances in angstrom from the bilayer midplane. Coloured boxes highlight slices ~11–12.5 Å from the midplane bilayer (in which voids are interrupted by density in the +PI(4,5)P2/+bromosterol eisosomes) and are presented as zoomed inset below. g,h, Membrane density from native-source compact protein lattice (g) and stretched protein lattice (h) maps visualized at high threshold to display an inverted topological surface of the cytosolic leaflet, coloured by local resolution (in Å). Sterol voids are visible within the cytosolic leaflet of the compact protein lattice (g, inset) but not the stretched protein lattice (h, inset) zone maps.
Extended Data Fig. 6
Extended Data Fig. 6. Validation and cryo-EM data processing of reconstituted Pil1 filaments with lipid mixtures of known composition.
a, FRAP of TF-PI(4,5)P2 lipids in cholesterol- and ergosterol-containing lipid mixtures in the presence or absence of Pil1. b,c, FRAP of TF-PI(4,5)P2 (b) and TF-cholesterol (c) lipids in DO- or PO- lipid mixtures in the presence or absence of Pil1. In ac, solid lines indicate a mean of n number of measured nanotubes with standard deviation shown. d, Helical reconstruction data processing strategy for reconstituted Pil1 tubules. eh, All helical reconstructions from −PI(4,5)P2/+sterol (e), +PI(4,5)P2/−sterol (f), +PI(4,5)P2/+sterol (g) and +PI(4,5)P2/+bromosterol (h) reconstituted Pil1 tubules. Source Data
Extended Data Fig. 7
Extended Data Fig. 7. CG MD simulations.
a, Total occupancy per lipid for all lipids in each CG MD system. Total occupancy was averaged across the 3 replicas, error bars are s b, Comparison of DOPC occupancy and cholesterol occupancy in the +PI(4,5)P2/+sterol system for AH region residues <5 Å from DOPC and/or sterol headgroup, revealing the specificity of the sterol occupancy over the DOPC occupancy at the bulky side chains of the AH. c, PI(4,5)P2 occupancy reported for all residues <5 Å from PI(4,5)P2 headgroups. d, DOPS lipid occupancy for residues <5 Å from DOPS headgroup with >5% occupancy in CG MD simulations. e, Comparison of PI(4,5)P2 occupancy and DOPS occupancy in the +PI(4,5)P2/+sterol system for residues <5 Å from PI(4,5)P2 and/or DOPS headgroup. In be, values represent averages of per-residue occupancy computed along three replicas of 10 μs each, error bars are SEM. f, Lipid diffusion coefficients from CG simulations with PO- lipids. The values reported are the 1D axial diffusion of lipids in the outer leaflet of the tubes, with (green) and without (cyan) the Pil1 coat. Diffusion coefficients were computed from 5 replicas of 2 μs. Box plots elements are defined as follows: Centre line is the median, box limits are 25% to 75% lower and upper quartiles, whiskers extend from the box to the minimum and maximum data points lying within 1.5x interquartile range (IQR), and green triangle indicates the mean value. g, Total occupancy per lipid for all lipids in each CG MD system using PO- lipids instead of DO- lipids. * indicates sterol-binding residues and # indicates charged predicted lipid-binding-pocket residues. Total occupancy was averaged across the 3 replicas, error bars are SEM. Source Data
Extended Data Fig. 8
Extended Data Fig. 8. Lipid sorting coefficients and +PI(4,5)P2/−sterol FRAP assays.
a, Example lipid nanotube with DOPE-Atto647N and Pil1–mCherry bound. Constriction of the nanotube reduces the intensity of the labelled lipid fluorescence where Pil1–mCherry is bound. b, Example lipid nanotube with Pil1–mCherry, fluorescent TF-PI(4,5)P2, and fluorescent DOPE-Atto647N. Constriction of the nanotube reduces the intensity of the labelled lipid fluorescence where Pil1–mCherry is bound. Increased sorting of TF-PI(4,5)P2 relative to DOPE-Atto647N is observed at sites of Pil1 nanotube constriction. c, Fluorescence plot profiles of the lipid of interest and reference lipid used to extract the integrated fluorescence densities (shading under the curve) to measure lipid sorting coefficients. d, AH slice through unsharpened maps of +PI(4,5)P2/−sterol (left panel) and +PI(4,5)P2/+sterol (right panel), with arrows indicating presumed PI(4,5)P2 density in each reconstruction (green and lilac, respectively). e,f, FRAP of TF-PC (e) and TF-PE (f) in control samples without protein and with Pil1 in −PI(4,5)P2/+sterol (blue) and +1% PI(4,5)P2/+sterol (magenta) lipid nanotubes. Solid lines indicate a mean of n number of measured nanotubes with standard deviation shown. Dashed lines indicate the fitted data. g,h, FRAP of TF-PC (g) and TF-PE (h) in control samples without protein and with Pil1 in +1% PI(4,5)P2/−sterol and +1% PI(4,5)P2/+sterol lipid nanotubes. Solid lines indicate a mean of n number of measured nanotubes with standard deviation shown.
Extended Data Fig. 9
Extended Data Fig. 9. In vivo lipid-binding-pocket mutants.
a, Lipid sorting coefficients of TF-PI(4,5)P2 and TF-PS for PS-binding-impaired mutant (pil1-K66A/R70A) and PI(4,5)P2-binding-impaired mutant (pil1-K130A/R133A) in +1% PI(4,5)P2/+sterol lipid nanotubes. A significant decrease in PI(4,5)P2 sorting is observed in the PI(4,5)P2-binding impaired mutant relative to the WT (WT vs K130A p = 0.04058), but not in the PS-binding-impaired mutant (WT vs K66A p = 0.71233, K66A vs K130A p = 0.15098). PS sorting is impaired in both the PS- and the PI(4,5)P2-binding impaired mutants (WT vs K66A p = 8.417e-7, WT vs K130A p = 2.425e-5, K66A vs K130A p = 0.03931). Box indicates interquartile range (IQR) from Q1 (25%) to Q3 (75%) quartiles. Lower and upper whiskers show from Q1 and Q3 quartiles to minimum and maximum data points, respectively. Horizontal line shown inside the box indicates the median [Statistical significance: p-values obtained applying two-sample t-test with all conditions following normal distribution at 0.01 tested by Shapiro–Wilk, Kolmogorov–Smirnov, and Anderson–Darling normality tests. n is the number of independent tested nanotubes, N = 2 for all conditions, being the number of experimental repetitions. Black rhombuses show data points obtained at day 1 and grey circles show data points obtained for day 2]. b, FRAP of TF-cholesterol for sterol-binding-impaired mutant (Pil1-F33A/Y40A/F42A/F50A), with and without Pil1 protein in +1% PI(4,5)P2/+sterol lipid nanotubes. The mobile fraction of sterols is increased in the sterol-binding-impaired mutant, confirming the reduction of sterol binding by this mutant. Solid lines indicate a mean of n number of measured nanotubes with standard deviation shown. c, Eisosome morphology in lsp1Δ yeast expressing Pil1-GFPenvy lipid-binding-pocket mutation variants and Nce102–mScarlet-I (summed stacks). Merge represents summed stacks of Pil1-GFPenvy (cyan) and mScarlet-I (magenta) signals. d, Central confocal slice of lsp1Δ yeast expressing Pil1-GFPenvy variants and Nce102–Scarlet-I highlighting cytosolic ingression of eisosomes in sterol-binding-impaired mutant Pil1F33A/Y40A/F42A/F50A. e, Thresholded fraction of Nce102–mScarlet-I that colocalizes with indicated Pil1-GFPenvy lipid-binding-pocket mutants in single cells (Manders’ M1 colocalization coefficient). The shaded area represents the probability for data points of the population to take on this value. f, Growth of serial dilutions of lsp1Δ cells expressing Pil1-GFPenvy lipid-binding-pocket mutants on Complete Supplement Mixture media (CSM) with the indicated treatments. (DMSO: dimethylsulfoxide, Atorva: atorvastatin, Nys: nystatin, Myr: myriocin). All tagged/mutant proteins in cf are expressed from their endogenous locus. Scale bars, 2 μm. Source Data
Extended Data Fig. 10
Extended Data Fig. 10. 3D variability analysis.
a, 3DVA data processing strategy. b, Alignment of most compact protein lattice class (dark red) and most stretched protein lattice class (yellow) comparing measured distances between 3 different regions on neighbouring dimers within the lattice. Differences in distance between dimer regions range from 0.5–2.2 Å. c, Number of particles from each helical reconstruction type found in each 3DVA stretch class (Stretch-1=most compact protein lattice, Stretch-10=most stretched protein lattice). d, Percent of particles within each 3DVA stretch class (Stretch-1=most compact protein lattice, Stretch-10=most stretched protein lattice) deriving from each helical reconstruction type. e, One-pixel slices through unsharpened maps illustrating the lipid-binding pocket and the sterol voids of the most compact protein lattice and most stretched protein lattice 3DVA classes with the lipid-binding-pocket region indicated (most compact protein lattice: red arrows, most stretched protein lattice: yellow arrows). f, 3D surface intensity plot of sterol void slice from 5 intermediate classes along the 3DVA component exhibiting protein lattice stretch, ranging from Stretch-1 (compact protein lattice) through Stretch-9 (stretched protein lattice). g, Radial angle profile plots of bilayer within most compact protein lattice and most stretched protein lattice classes. Source Data

References

    1. Honigmann, A. & Pralle, A. Compartmentalization of the cell membrane. J. Mol. Biol.428, 4739–4748 (2016). 10.1016/j.jmb.2016.09.022 - DOI - PubMed
    1. Lu, S. M. & Fairn, G. D. Mesoscale organization of domains in the plasma membrane—beyond the lipid raft. Crit. Rev. Biochem. Mol. Biol.53, 192–207 (2018). 10.1080/10409238.2018.1436515 - DOI - PubMed
    1. Levental, I., Levental, K. R. & Heberle, F. A. Lipid rafts: controversies resolved, mysteries remain. Trends Cell Biol.30, 341–353 (2020). 10.1016/j.tcb.2020.01.009 - DOI - PMC - PubMed
    1. Sezgin, E., Levental, I., Mayor, S. & Eggeling, C. The mystery of membrane organization: composition, regulation and roles of lipid rafts. Nat. Rev. Mol. Cell Biol.18, 361–374 (2017). 10.1038/nrm.2017.16 - DOI - PMC - PubMed
    1. Malinsky, J., Opekarová, M. & Tanner, W. The lateral compartmentation of the yeast plasma membrane. Yeast27, 473–478 (2010). 10.1002/yea.1772 - DOI - PubMed

MeSH terms