. 2024 Aug;632(8023):182-191.
doi: 10.1038/s41586-024-07752-y. Epub 2024 Jul 24.

Neoantigen-specific cytotoxic Tr1 CD4 T cells suppress cancer immunotherapy

Affiliations

Neoantigen-specific cytotoxic Tr1 CD4 T cells suppress cancer immunotherapy

Hussein Sultan et al. Nature. 2024 Aug.

Abstract

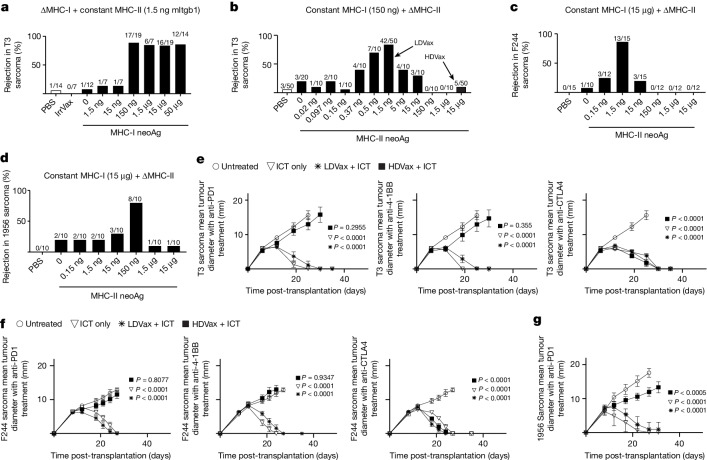
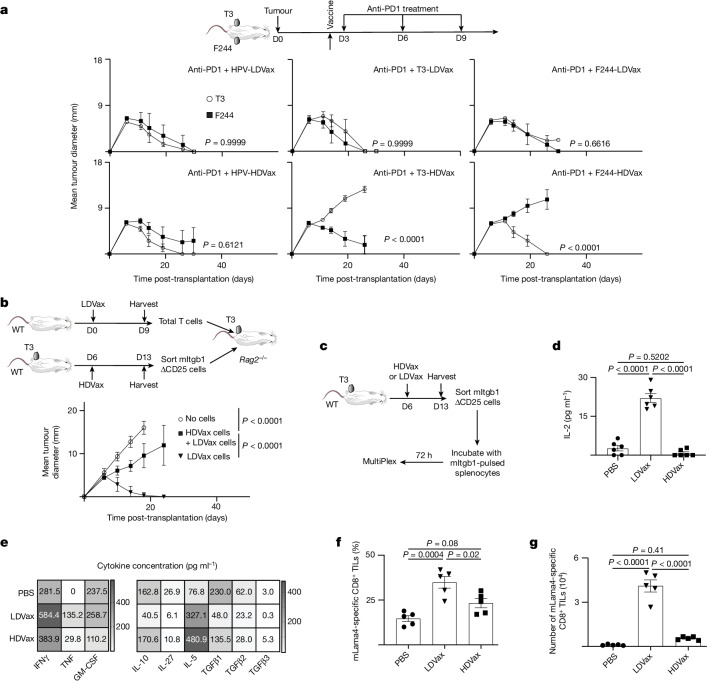
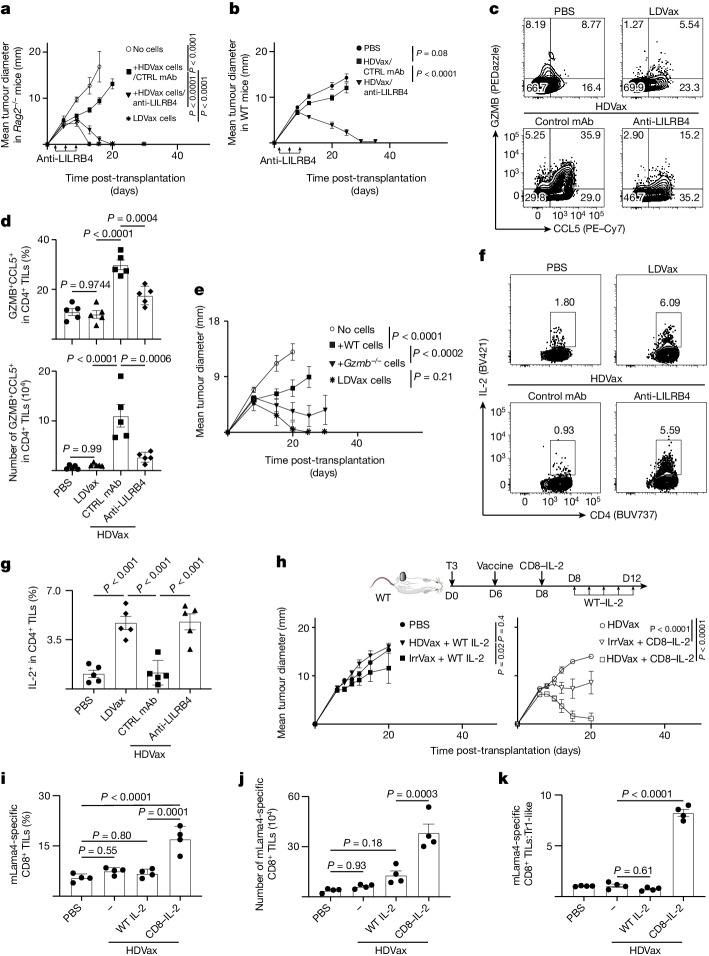
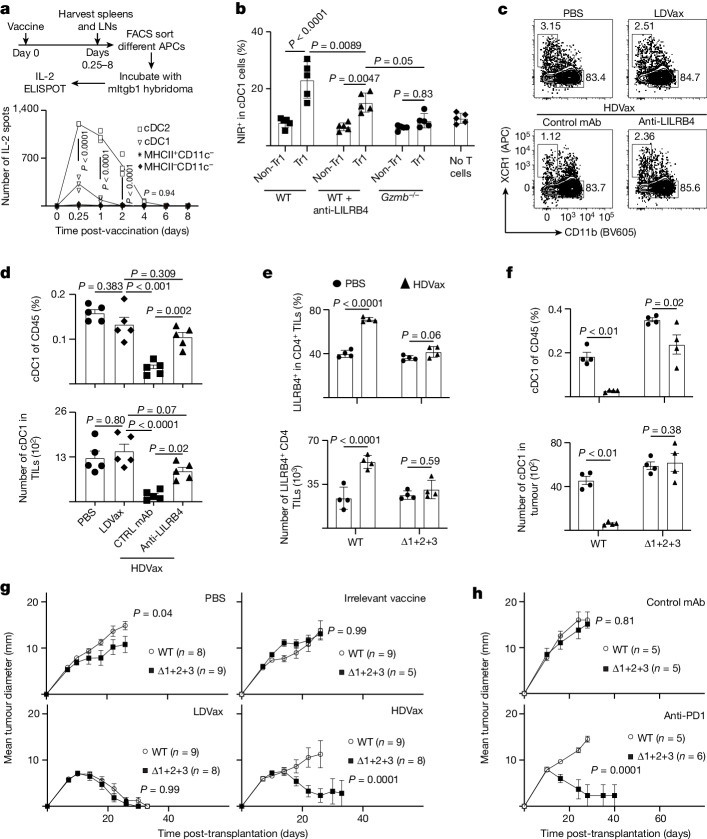
CD4+ T cells can either enhance or inhibit tumour immunity. Although regulatory T cells have long been known to impede antitumour responses1-5, other CD4+ T cells have recently been implicated in inhibiting this response6,7. Yet, the nature and function of the latter remain unclear. Here, using vaccines containing MHC class I (MHC-I) neoantigens (neoAgs) and different doses of tumour-derived MHC-II neoAgs, we discovered that whereas the inclusion of vaccines with low doses of MHC-II-restricted peptides (LDVax) promoted tumour rejection, vaccines containing high doses of the same MHC-II neoAgs (HDVax) inhibited rejection. Characterization of the inhibitory cells induced by HDVax identified them as type 1 regulatory T (Tr1) cells expressing IL-10, granzyme B, perforin, CCL5 and LILRB4. Tumour-specific Tr1 cells suppressed tumour rejection induced by anti-PD1, LDVax or adoptively transferred tumour-specific effector T cells. Mechanistically, HDVax-induced Tr1 cells selectively killed MHC-II tumour antigen-presenting type 1 conventional dendritic cells (cDC1s), leading to low numbers of cDC1s in tumours. We then documented modalities to overcome this inhibition, specifically via anti-LILRB4 blockade, using a CD8-directed IL-2 mutein, or targeted loss of cDC2/monocytes. Collectively, these data show that cytotoxic Tr1 cells, which maintain peripheral tolerance, also inhibit antitumour responses and thereby function to impede immune control of cancer.


Conflict of interest statement

R.D.S. is a cofounder, scientific advisory board member, stockholder and royalty recipient of Asher Biotherapeutics, and is a paid scientific advisory board member for A2 Biotherapeutics, NGM Biopharmaceuticals, BioLegend, Sensei Biotherapeutics Neuvogen and BlueSphere Biopharmaceuticals. K.M.M. is on the Scientific Advisory Board for Harbour Biomed. J.P.A. receives consulting fees from Achelois, Adaptive Biotechnologies, Apricity, BioAtla, BioNTech, Candel Therapeutics, Codiak, Dragonfly, Earli, Enable Medicine, Hummingbird, ImaginAb, Jounce, Lava Therapeutics, Lytix, Marker, PBM Capital, Phenomic AI, Polaris Pharma, Time Bioventures, Trained Therapeutix, Two Bear Capital and Venn Biosciences; and has ownership of stocks for Achelois, Adaptive Biotechnologies, Apricity, BioAtla, BioNTech, Candel Therapeutics, Codiak, Dragonfly, Earli, Enable Medicine, Hummingbird, ImaginAb, Jounce, Lava Therapeutics, Lytix, Marker, PBM Capital, Phenomic AI, Polaris Pharma, Time Bioventures, Trained Therapeutix, Two Bear Capital and Venn Biosciences. T.N.S. is a cofounder, scientific advisory board member and stockholder of Asher Biotherapeutics and Neogene Therapeutics, cofounder and stockholder of Cell Control Bio, consultant and stockholder at Third Rock Ventures, and a scientific advisory board member for Allogene Therapeutics, Celsius, Merus and Scenic Biotech. K.D.M., Y.A.Y. and I.D. are full-time employees of Asher Biotherapeutics. R.B. and H.A.C. are full-time employees of Natera, Inc. All other authors declare no competing interests.

Figures

Fig. 1
Fig. 1. High MHC-II neoAg doses inhibit the antitumour efficacy of SLP vaccines and certain ICTs.
a, Percent survival of T3 tumour-bearing mice after treatments with vaccines containing fixed (1.5 ng) doses of mItgb1 SLP plus different doses of mLama4/mAlg8 SLP or IrrVax. b, Percent survival of T3 tumour-bearing mice after treatments with vaccines containing fixed doses of mLama4/mAlg8 SLP (0.15 μg each) plus different doses of mItgb1 SLP. c, Percent survival of F244 tumour-bearing mice after treatment with vaccines containing fixed doses of mPex14 SLP (15 μg per mouse) plus different doses of mPlec SLP. d, Percent survival of 1956 tumour-bearing mice after treatment with vaccines containing fixed doses of 1956 mPsmd6 SLP (15 μg per mouse) plus different doses of mCs SLP or IrrVax. The numbers above each bar represent the number of mice that rejected the tumours over the total number of mice used. e, T3 tumour outgrowth in mice vaccinated and treated with anti-PD1, anti-41-BB or anti-CTLA4 plus T3-HDVax or T3-LDVax as detailed in the Methods (n = 4). f, F244 tumour outgrowth in WT mice vaccinated and treated with F244-HDVax or F244-LDVax plus different antibodies (n = 4). In panels e,f, treatment with the three monoclonal antibodies was done in the same experiment using the same cohort of untreated mice as a control. g, 1956 Tumour outgrowth in mice vaccinated with 1956-HDVax or 1956-LDVax and treated with anti-PD1 (n = 5). Data in panels eg represent mean tumour diameter ± s.e.m. and are representative of three independent experiments. P values were calculated by comparing the different treatments to untreated control mice and were calculated using two-way analysis of variance (ANOVA), with multiple comparisons corrected using Sidak’s multiple comparison test. Source Data
Fig. 2
Fig. 2. HDVax inhibition is specific for the MHC-II neoAgs in the tumour.
a, T3 and F244 tumour outgrowth in opposite contralateral flanks of male 129S6 WT mice vaccinated and treated with anti-PD1 (n = 5, representative of two experiments). D0, day 0. b, T3 tumour outgrowth in Rag2−/− mice receiving total T cells (5 × 106) from LDVax-treated mice only or plus CD25-negative mItgb1-specific CD4+ T cells (0.5 × 106) sorted from HDVax-treated mice (n = 10). Data in panels a,b are shown as mean tumour diameter ± s.e.m., and statistics were done using two-way ANOVA, with multiple comparisons corrected using Sidak’s multiple comparison test. ce, CD4+ T cells were purified and stimulated as shown. IL-2 production in the supernatant was assessed using MultiPlex (n = 6, pooled from two experiments; d). The heatmap displays the production levels of different cytokines (indicated on the x axis; e). The numbers in panel e represent the mean of two independent biological replicates (representative of two experiments). Frequency (f) and numbers (g) of mLama4+-specific CD8+ TILs in T3 tumours harvested on day 13 (n = 5, representative of three experiments) are also shown. Data in panels d,f,g are expressed as mean ± s.e.m.; statistics were done using one-way ANOVA, with multiple comparisons corrected with Tukey’s method. Source Data
Fig. 3
Fig. 3. HDVax-induced cells are cytotoxic Tr1 cells that are necessary and sufficient for HDVax-mediated inhibition.
a, UMAP shows individual clusters in I-Ab–mItgb1-specific CD4+ TILs under different conditions. b, Frequency of cells populating individual clusters. c, T3 tumour outgrowth in Rag2−/− mice that received T cells from LDVax mice plus total CD25CD4+ T cells (approximately 0.5 × 106) or different subpopulations (approximately 0.2 × 106) sorted from HDVax-treated mice (n = 5). d, Volcano plot of bulk RNA-seq comparing gene expression in cluster 3 cells relative to Treg cells (left) and non-cluster 3/5 cells (right). P values were obtained after applying the DESeq2 tool. e, Representative flow cytometry plot showing LILRB4 and SEMA4a expression in HDVax-induced mItgb1-specific CD4+ TILs in T3 tumours. f, T3 tumour outgrowth in Rag2−/− mice receiving T cells from LDVax mice and different subpopulations (approximately 0.1 × 106) sorted from HDVax-treated mice based on LILRB4 and SEMA4a expression (n = 3 (PBS and LDVax) and n = 8 for the other groups). g,h, Frequency of Treg cells (g) or LILRB4-expressing CD4+ TILs (h) in T3 tumours harvested at multiple days post-tumour inoculation (n = 5). ND, not done. i, Percent of T3 tumour-bearing mice surviving after three doses of anti-PD1 started on different days (6, 8, 9, 10 or 12) post-tumour transplant, followed by two subsequent doses injected every 3 days. The numbers above each bar represent the number of mice that rejected the tumours over the total mice used pooled from two experiments. Data in panels c,f are expressed as mean tumour diameter ± s.e.m. and are representative of three and two experiments, respectively. Statistics were done using two-way ANOVA, with multiple comparisons corrected using Sidak’s multiple comparison test. Data in panels g,h are expressed as mean ± s.e.m. representing two experiments; statistics were performed using one-way ANOVA, with multiple comparisons corrected with Tukey’s method. j, GSEA comparing the gene signature of cluster 3 cells (bulk RNA-seq) to the gene signature of different CD4+ T cell subsets. The red line shows the maximal deviation from zero of the curve, which is basically equal to the enrichment score in these cases. The enrichment score was used to identify the P value identification for each gene set by permutation test. NES, normalized enrichment score. k, Box plot showing the frequency of Tr1-like cells between responders and non-responders within the Sade-Feldman et al. dataset (left) and durable clinical benefits (DCBs) or non-DCBs within the Awad et al. dataset (right). Statistics were performed using t-tests without assuming equal variances. The P values in the Sade-Feldman et al. dataset was P = 0.002, t = 4.98, d.f. = 6.11; no significant difference in the Awad et al. dataset was found (P = 0.55). Data are shown as box plots extending from the 25th to 75th percentiles, with the median as the centre and the whiskers corresponding to the minimum and maximum values. Source Data
Fig. 4
Fig. 4. Anti-LILRB4 treatment reverses HDVax induction of GZMB/CCL5 and suppression of IL-2 production.
a, T3 tumour outgrowth in Rag2−/− mice receiving T cells from LDVax-treated mice plus HDVax-induced, CD25-negative mItgb1-specific CD4+ T cells (approximately 0.5 × 106) followed by anti-LILRB4 or control (CTRL) monoclonal antibody (mAb) treatment (n = 3 (PBS), 5 (LDVax and anti-LILB4) and 8 for control mAb). b, T3 tumour outgrowth in WT mice treated with HDVax alone or plus anti-LILRB4 (n = 5 (PBS) and 10 for other groups). c, Representative flow cytometry plots showing GZMB/CCL5 expression in CD4+ TILs pregated on CD4+CD25FOXP3CD39+. d, Frequency (top) and numbers (bottom) of GZMB/CCL5-expressing CD4+ TILs in T3 tumours 7 days after treatments (n = 5). e, 1956 Tumour outgrowth in Rag2−/− mice receiving T cells from LDVax WT mice and HDVax-induced, CD25-negative mItgb1-specific CD4+ T cells (approximately 0.2 × 106) from WT or Gzmb−/− mice (n = 5 for PBS and LDVax, and 7 for other groups). f, Representative flow cytometry plots show the IL-2 expression in CD4+ TILs. g, Frequency of cells expressing IL-2 in CD4+ T cells in multiple mice (n = 5). h, T3 tumour outgrowth in WT mice treated as shown and detailed in the Methods (n = 5). ik, T3 tumour-bearing mice were treated as in panel h, and the frequency (i) and numbers (j) of mLama4-specific CD8+ TILs, and the ratio of mLama4-specific CD8+ TILs to Tr1-like cells (k) were assessed on day 13 TILs (n = 4). The data in panels a,b,e,h are expressed as mean tumour diameter ± s.e.m. and represent three, two, two and three experiments, respectively; statistics were done using two-way ANOVA, with multiple comparisons corrected using Sidak’s multiple comparison test. Data in panels d,g,ik are shown as mean ± s.e.m. representing three, three, two and three experiments, respectively; statistics were done using one-way ANOVA, with multiple comparisons corrected with Tukey’s method. Source Data
Fig. 5
Fig. 5. HDVax-induced Tr1-like cells arise from preferential cDC2 antigen presentation and kill cDC1 in a GZMB-dependent manner.
a, Sorting protocol and IL-2 production by mItgb1-specific hybridoma (n = 3, representing two experiments). b, Frequency of NIR expression in cDC1 (MHCII+CD11c+XCR1+) after incubation with sorted subpopulations of HDVax-induced CD4+ T cells harvested from WT mice (treated with HDVax plus control mAb or anti-LILRB4) or Gzmb−/− mice (n = 5, representing three experiments). c, Representative flow cytometry plots showing cDC1 and cDC2 in T3 tumours pregated on CD45+MHC-II+CD11c+ and CD64. d, Frequency (top) and numbers (bottom) of cDC1 in T3 tumours assessed 5 days post-vaccination (n = 5, representing three experiments). e, Frequency (top) and numbers (bottom) of LILRB4+CD25FOXP3CD4+ T cells in 1956 TILs harvested from WT or Δ1+2+3 tumour-bearing mice after vaccination (n = 4, representing three experiments). f, Frequency (top) and numbers (bottom) of cDC1 in 1956 tumours in WT and Δ1+2+3 mice assessed 5 days post-vaccination (n = 4, representing three experiments). g, 1956 Tumour outgrowth in WT and Δ1+2+3 mice vaccinated with 1956 HDVax, LDVax or IrrVax on days 5 and 16. h, 1956 Tumour outgrowth in WT and Δ1+2+3 mice treated with 200 μg of anti-PD1 on days 12, 15 and 18 (n = 5–6, representing two experiments). Data in panels a,b,df are expressed as mean ± s.e.m. Data in panels g,h are expressed as mean tumour diameter ± s.e.m. Statistics in panel d were done using one-way ANOVA, with multiple comparisons corrected with Tukey’s method. Statistics in panels a,b,eh were determined by two-way ANOVA, with multiple comparisons corrected using Sidak’s multiple comparison test. Source Data
Extended Data Fig. 1
Extended Data Fig. 1. Phenotypic profiles of HDVax versus LDVax-induced CD4+ T cells.
a, representative flow cytometry plots showing mItgb1 tetramer staining in CD4+ TILs. b, frequency (left) and numbers (right) of mItgb1-specific CD4+ TILs assessed in day 13 T3 tumours (n = 5, representing five experiments). c, representative flow cytometry plots showing CD25 and Foxp3 staining in mItgb1-specific CD4+ TILs. d, frequency of CD25+Foxp3+ cells in mItgb1-specific CD4+ T cells in TILs (left) and spleens (right) of T3 tumour-bearing mice (n = 5, representing five experiments). e, frequency of CD25+Foxp3+ Tregs in CD4+ T cells in tumours (left) and spleens (right) of F244 tumour-bearing mice (n = 5, representing three experiments). f, representative flow cytometry plots showing the frequency of IFNγ/TNFα in CD4+ TILs. g, frequency of IFN-γ/TNF-α expressing CD4+ TILs in multiple mice (n = 6, pooled from two experiments). h, representative flow cytometry plots showing CD40L expression in CD4+ TILs. i, frequency of CD40L expression in CD4+ TILs of T3 tumours after in vitro activation (n = 6, pooled from two experiments). Data in all panels are shown as means ± s.e.m. P values were calculated using one-way ANOVA with multiple comparisons corrected with Tukey’s method. Source Data
Extended Data Fig. 2
Extended Data Fig. 2. Characterization of dendritic cells and CD8+ TILs in HDVax, LDVax and PBS-treated mice.
a, representative flow cytometry plots showing the gating strategy for cDC1 and cDC2. b, expression of CD86, CD70, MHC-II and CD40 on the surface of dendritic cells (CD45+CD90.2CD11c+MHC-II+CD64) in T3 tumours harvested 5 days after vaccination (n = 5, represent two experiments). c, numbers of cDC1 (top) and cDC2 (bottom) in T3 tumours assessed five days post-vaccination (n = 5, represent three experiments). d, representative flow cytometry plots showing the gating strategy for mLama4-specific CD8+ TILs in day 13 T3 TILs. e-h, frequency of mLama4-specific CD8+ TILs expressing e, TOX f, PD-1/CD39 and g, TIM-3/LAG3 (n = 5, represent two experiments). h, frequency of cells expressing IFN-γ/TNF-α in mLama4+ specific CD8+ TILs after in vitro activation with splenocytes pulsed with 1μg/ml mLama4 SLP in the presence of Golgi-plug followed by intracellular staining (n = 8, pooled from three experiments). i, frequency of mLama4-specific CD8+ TILs showing TIM3 and TCF-1. Data in all panels are expressed as means ± s.e.m. P values were calculated using one-way ANOVA with multiple comparisons corrected with Tukey’s method. Source Data
Extended Data Fig. 3
Extended Data Fig. 3. HDVax-induced CD4+ T cells are deficient in Th1 gene signature and express high levels of GZMB and CCL5.
a-b, violin plots showing the expression levels of multiple genes involved in a, exhaustion or b, effector Th1 signature in mItgb1-specific scRNAseq data. c, GSEA showing relative expression of genes involved in the IL-2 signaling pathway. d, violing plots showing the expression levels of different transcription factors involved in IL-2 signaling in mItgb1-specific scRNAseq data. e-f, frequency (left) and numbers (right) of CCL5/GZMB expressing CD4+ T cells in e, TILs and f, spleens of T3 tumour bearing WT mice 5-7 days post vaccinations (n = 7 (TILs) and 5 (spleen) and represent three experiments). g-h, frequency (left) and numbers (right) of CCL5/GZMB expressing CD4+ T cells in g, TILs and h, spleens of F244 tumour-bearing WT mice seven days post vaccinations (n = 4, represent two experiments). i, frequency of CTLA-4 in different clusters of mItgb1-specific CD4+ TILs of T3 tumour-bearing WT mice (n = 5, represent theee experiments). j, frequency of CCL5/GZMB expressing CD4+ TILs of T3 tumour-bearing WT mice treated with HDVax plus αPD-1 or αCTLA-4 (n = 4, represent three experiments). Data in all panels are shown as means ± s.e.m. Statistics were performed using one-way ANOVA with multiple comparisons corrected with Tukey’s method in e-h and j, and two-way ANOVA corrected with sídák’s multiple comparisons test was performed for statistics in i. Source Data
Extended Data Fig. 4
Extended Data Fig. 4. Gating and sorting strategy to patially enrich for cluster-3 cells.
a, feature plot showing the expression of various genes superimposed on I-Ab-mItgb1 specific CD4+ TILs UMAP. b, representative flow cytometry plots showing the sorting strategy for different clusters in mItgb1-specific CD4+ TILs. c, representative flow cytometry plot showing the expression of CD25, CD39 and Foxp3 in different clusters after sorting. d, T3 outgrowth in RAG2−/− mice receiving total T cells from LDVax-treated WT mice (5 × 106) alone or plus; LDVax-induced cluster-3 cells; HDVax-induced, CD25-negative mItgb1-specific; or polyclonal (mItgb1 non-specific) CD4+ T cells (~0.2 × 106). Data expressed as mean tumour diameter ± s.e.m. (n = 5, two experiments). P values were calculated using Two-way ANOVA corrected with sídák’s multiple comparisons test. e-g, frequency of LILRB4 single positive, LILRB4/SEMA4a double positive or SEMA4a single positive expressing mItgb1-specific CD4+ TILs (n = 5, represent three experiments). Data are expressed as mean ± s.e.m. Statistics were performed using one-way ANOVA with multiple comparisons corrected with Tukey’s method. Source Data
Extended Data Fig. 5
Extended Data Fig. 5. Cells populating cluster-3 are distinct from Tregs.
a, GSEA comparing gene signature of cluster-3 cells (bulk-RNAseq) to gene signature of different CD4+ T cell subsets. Enrichment Score was used to identify the p-value identification for each gene set by permutation test. b, flow cytometry plot showing CD25 and Foxp3 staining in sorted Tregs and cells populating cluser-3 after 10 days of in vitro incubation with IL-2 alone (30 IU/ml), or plus IL-10 and or TGFβ (10 ng/ml). The experiment represents two experiments. c, TCR clonotypes in each cluster of HDVax-induced I-Ab-mItgb1 specific CD4+ T were determined by TCRseq and compared to the TCR clonotypes in cells populating cluster-3. d, frequency of cells expressing YFP+ in Tregs (CD25+Foxp3+) or CD25LILRB4+ CD4+ T cells after different treatments in spleens and TILs (n = 4, represent one experiment). e, frequency of cells expressing LAG3 and CD49b in cluster-3 or non-cluster-3/5 of mItgb1-specific CD4+ T cells after different treatments in spleens and TILs (n = 5, represent three experimetns). Data expressed as mean tumour diameter ± s.e.m. and statistics were performed by two-way ANOVA corrected with sídák’s multiple comparisons test. f-g, freshly isolated CD4+ T cells from different clusters were stimulated with 1 μg/ml mItgb1 SLP for 72 hr, and production of active isoforms of TGFβ was assessed by Multiplex (biological replicates = 2 in cluster-5 and 3 replicates in all other clusters and each values are mean of 2 technical replicates, represent two experiments). Statistics in d and f were performed using one-way ANOVA with multiple comparisons corrected with Tukey’s method. g, Heatmap showing levels of different cytokines production (indicated on the heatmap x-axis). Numbers represent the mean of three independent biological replicates and represent two experiments. h, T3 tumour outgrowth in WT mice treated with HDVax or irrelevant vaccines on day 6 and αIL-10 (-1, 4, 7, 10 and 14) post-T3 tumour injection (n = 5, representing two experiments). i, T3 tumour outgrowth in WT mice treated with HDVax on day 3 and αIL-10R (-1, 5, 11 and 18) post tumour transplantation (n = 10, representing one experiment). Data in e, h and i expressed as mean tumour diameter ± s.e.m. and P values were calculated using two-way ANOVA corrected with sídák’s multiple comparisons test. Source Data
Extended Data Fig. 6
Extended Data Fig. 6. related to Fig. 4: αLILRB4 treatment reverses HDVax induction of GZMB/CCL5 and suppression of IL-2 production.
a, 1956 outgrowth in RAG2−/− mice receiving total LILRB4−/− T cells from LDVax-treated LILRB4−/− mice plus HDVax-induced, CD25-negative CD4+ T cells (~0.2 × 106) from WT mice or LILRB4−/− mice (n = (5 for PBS and LDVax) 7 for other groups). b, F244 tumour outgrowth in WT mice treated with HDVax and αLILRB4 as shown (n = 10, represent two experiments). c, 1956 tumour outgrowth in mice treated with HDVax and αLILRB4 as shown (n = 10, represent two experiments). d, frequency of cells expressing LILRB4 in CD4+ T3 TILs after treatment with αLILRB4 or control mAb (n = 5, represent three experimenrts). e, frequency and numbers of GZMB/CCL5 expressing CD4+ TILs in F244 tumour-bearing mice (n = 3, represent two experiments). f, frequency and numbers of GZMB/CCL5 expressing CD4+ TILs in WT and LILRB4−/− 1956 tumour-bearing mice (n = 4, represent two experiments). g-h, frequency of CD4+ TILs expressing g, IFN-γ/TNF-α or h, CD40L in T3 TILs after in vitro activation with mItgb1 peptide in the presence of Golgi-plug (n = 5, represent two experiments). i-j, frequency of CD4+ TILs expressing i, IFN-γ/TNF-α or j, CD40L in F244 TILs after in vitro activation with mPlec peptide in the presence of Golgi-plug (n = 3). Data in a-c expressed as mean tumour diameter ± s.e.m and P values were calculated using Two-way ANOVA corrected with sídák’s multiple comparisons test. Data in d-j are expressed as mean ± s.e.m. and P values were calculated using one-way ANOVA with multiple comparisons corrected with Tukey’s method. Source Data
Extended Data Fig. 7
Extended Data Fig. 7. LILRB4 blockade enhances the phenotype and the effector functions of CD8+ TILs.
a, numbers of mLama4+ specific CD8+ TILs were assessed in T3 TILs (n = 5). b, frequency of CD8+ TILs expressing IFN-γ/TNF-α after in vitro activation with mLama4 SLP. c, frequency of CD8+ TILs expressing IFN-γ/TNF-α after in vitro activation with mPex14 SLP (n = 3). d, expression of several exhaustion markers on mLama4-specific CD8+ T cells in TILs of T3 tumour-bearing mice (n = 5). Data represent two independent experiments and are shown as mean ± s.e.m. e, expression of several exhaustion markers in mPex14-specific CD8+ T cells in F244 TILs (n = 3). Data expressed are shown as mean ± s.e.m. P values were calculated using one-way ANOVA with multiple comparisons corrected with Tukey’s method, which was used for the statistics. Source Data
Extended Data Fig. 8
Extended Data Fig. 8. related to Fig. 4: CD8-directed, cis-targeted IL-2 treatment re-establishes the anti-tumour efficacy of HDVax in F244 and 1956 tumour models.
a, F244 tumour outgrowth in WT mice treated as in Fig. 4h (n = 10, represent two experiments). b, 1956 tumour growth in C57BL6 WT mice treated as in Fig. 5i (n = 5, represent two experiments). Data in a and b are expressed as mean ± s.e.m., and P values were calculated using Two-way ANOVA corrected with sídák’s multiple comparisons test. c, representative flow cytometry plot showing the expression of mLama4+ specific CD8+ TILs in T3 TILs harvested from treated mice, as shown in Fig. 5h. d-f, F244 tumour-bearing mice were treated as in Fig. 5h, and d, frequency, e, numbers of mPex14-specific CD8+ TILs, and f, the ratio of mPex14-specific CD8+ TILs to Tr1-like cells were assessed on day 13 TILs. Data are expressed as mean ± s.e.m., and P values were calculated using one-way ANOVA with multiple comparisons corrected with Tukey’s method. Source Data
Extended Data Fig. 9
Extended Data Fig. 9. related to Fig. 5: HDVax-induced Tr1-like cells kill cDC1 in a GZMB-dependent manner.
a, IL-2 production by mItgb1-specific hybridoma cells after incubation with cDC1 and cDC2 sorted from five mice one day after treatment with T3- LDVax or -HDVax (n = 2 and represent two experiments). b, T3 tumour-bearing mice were vaccinated with LDVax or HDVax (2 doses,11 days apart), serum was collected 7 days after the last vaccination, and antibody titer to mItgb1 SLP was assessed using ELISA (Methods). c, different isotypes of mItgb1-specific antibodies were determined. Data in b and c are shown as means ± s.e.m. and represent three independent experiments (n = 5). d, frequency of perforin (Prf1) expressing CD4+ TILs in different subpopulations of CD4+ TILs (n = 5, represent two experiments). e, frequency of NIR expression (live/dead signal) in cDC1 (MHCII+CD11c+XCR1+) (left) and cDC2 (MHCII+CD11c+CD172a+) (right) after incubation with sorted LDVax-induced or subpopulations of HDVax-induced mItgb1-specific CD4+ T cells (Methods). Data are shown as means ± s.e.m. of three experiments. f, frequency of cDC2 (MHCII+CD11c+CD172a+) expressing NIR after incubation with sorted subpopulations of HDVax-induced mItgb1 specific CD4+ T cells harvested from WT mice (treated with HDVax plus control mAb or αLILRB4) or GZMB−/− mice (related to Fig. 5b). g, frequency (left) and numbers (right) of cDC1 (of CD45+ cells) in F244 TILs treated with HDVax five days post vaccinations (n = 5). Data are representative of two independent experiments and shown as mean ± s.e.m. h, frequency (left) and numbers (right) of cDC1 in 1956 TILs assessed five days post-vaccination in WT and LILRB4−/− mice (n = 4). i, frequency of cDC1 in T3 tumours assessed five days post-vaccination and treatment with 2 doses of αPD-1 or αCTLA-4 in WT mice (n = 4, represent two experiments). j, frequency of cDC1 in 1956 TILs assessed five days post-vaccination in WT and GZMB−/− mice (n = 3). Data in all panels are shown as means ± s.e.m. and P values were calculated using one-way ANOVA with multiple comparisons corrected with Tukey’s method. Source Data
Extended Data Fig. 10
Extended Data Fig. 10. related to Fig. 5: HDVax-induced Tr1-like cells arise from preferential cDC2 antigen presentation.
a, representative flow cytometry plots showing the gating strategy for different antigen-presenting cell subsets in WT and Δ1 + 2 + 3 mice bearing 1956 tumours. b, frequency of Tr1-like cells in spleens of HDVax treated WT, Δ1 + 2 + 3 (cDC2 deficient) or Irf8Δ32 (cDC1 deficient) mice (n = 4, represent two experiments). Data are shown as means ± s.e.m. and P values were calculated using one-way ANOVA with multiple comparisons corrected with Tukey’s method. c, frequency of Tregs and d, Tr1-like cells in 1956 TIL harvested at multiple days post tumour inoculation (n = 4, representing two experiments). Data are expressed as means ± s.e.m. and P values were calculated using Two-way ANOVA corrected with sídák’s multiple comparisons test. Source Data

Comment in

References

    1. Awwad, M. & North, R. J. Immunologically mediated regression of a murine lymphoma after treatment with anti-L3T4 antibody. A consequence of removing L3T4+ suppressor T cells from a host generating predominantly Lyt-2+ T cell-mediated immunity. J. Exp. Med.168, 2193–2206 (1988). - PMC - PubMed
    1. Hori, S., Nomura, T. & Sakaguchi, S. Control of regulatory T cell development by the transcription factor Foxp3. Science299, 1057–1061 (2003). - PubMed
    1. Fontenot, J. D., Gavin, M. A. & Rudensky, A. Y. Foxp3 programs the development and function of CD4+CD25+ regulatory T cells. Nat. Immunol.4, 330–336 (2003). - PubMed
    1. Khattri, R., Cox, T., Yasayko, S. A. & Ramsdell, F. An essential role for scurfin in CD4+CD25+ T regulatory cells. Nat. Immunol.4, 337–342 (2003). - PubMed
    1. Thornton, A. M. & Shevach, E. M. CD4+CD25+ immunoregulatory T cells suppress polyclonal T cell activation in vitro by inhibiting interleukin 2 production. J. Exp. Med.188, 287–296 (1998). - PMC - PubMed

MeSH terms