Case Reports
. 2024 Aug;632(8024):390-400.
doi: 10.1038/s41586-024-07745-x. Epub 2024 Jul 24.

Human TMEFF1 is a restriction factor for herpes simplex virus in the brain

Affiliations
Case Reports

Human TMEFF1 is a restriction factor for herpes simplex virus in the brain

Yi-Hao Chan et al. Nature. 2024 Aug.

Abstract

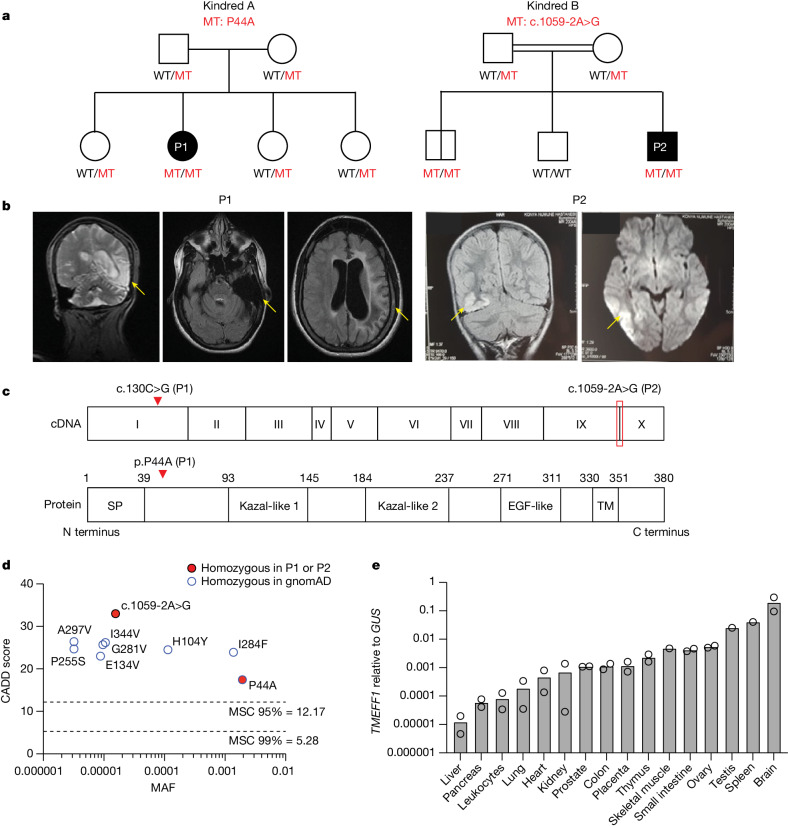
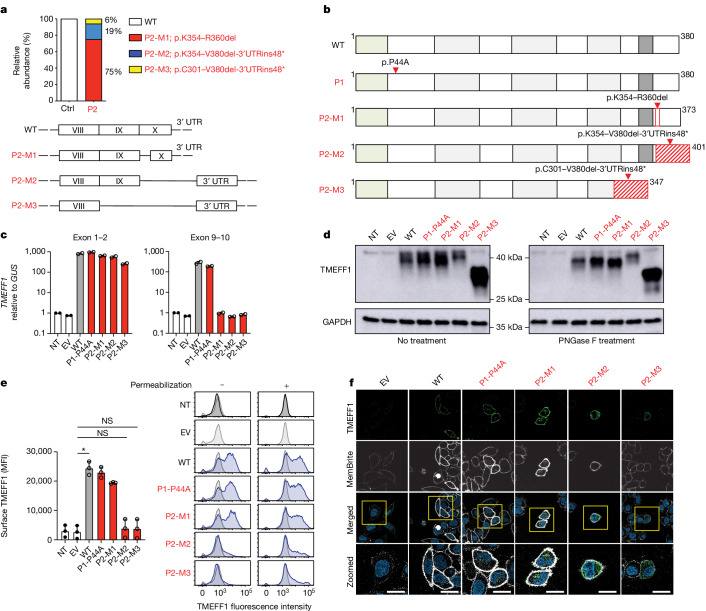
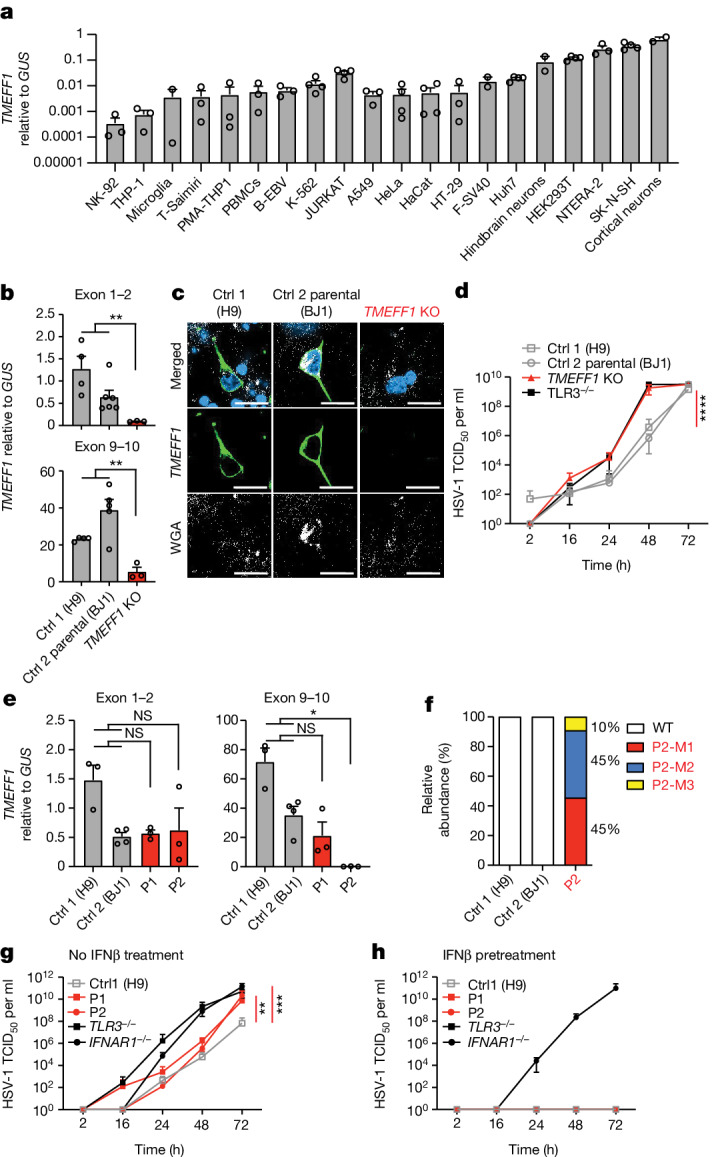
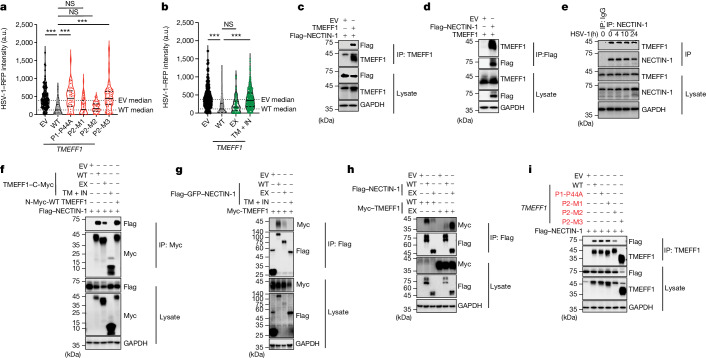
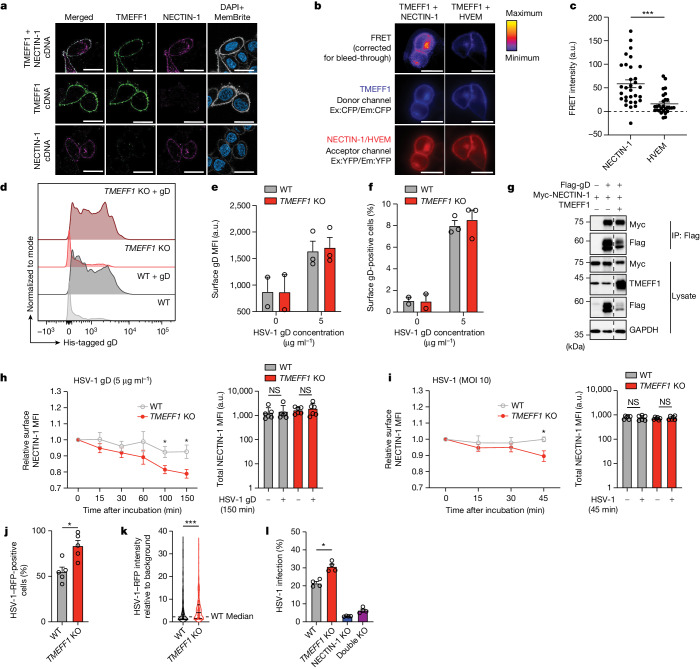
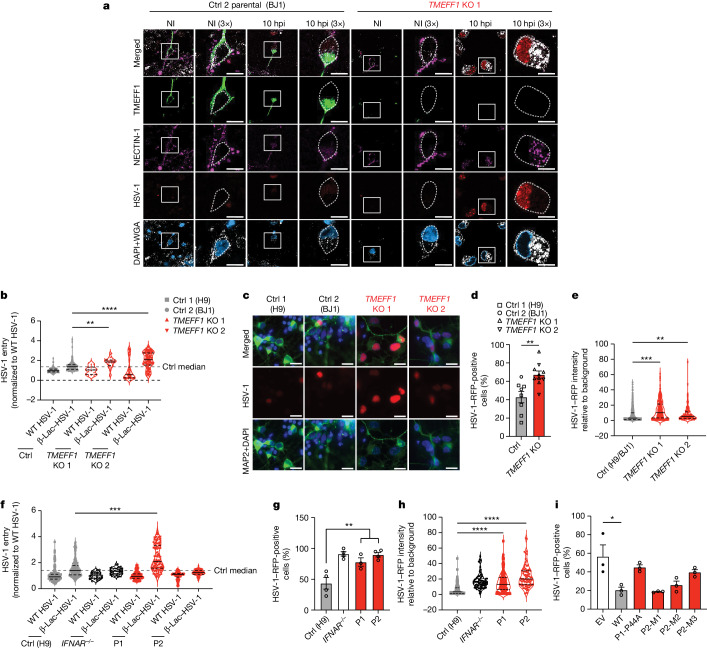
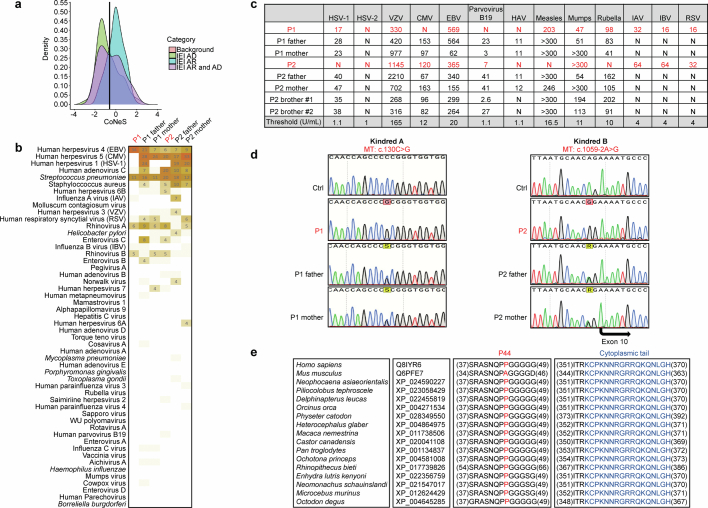
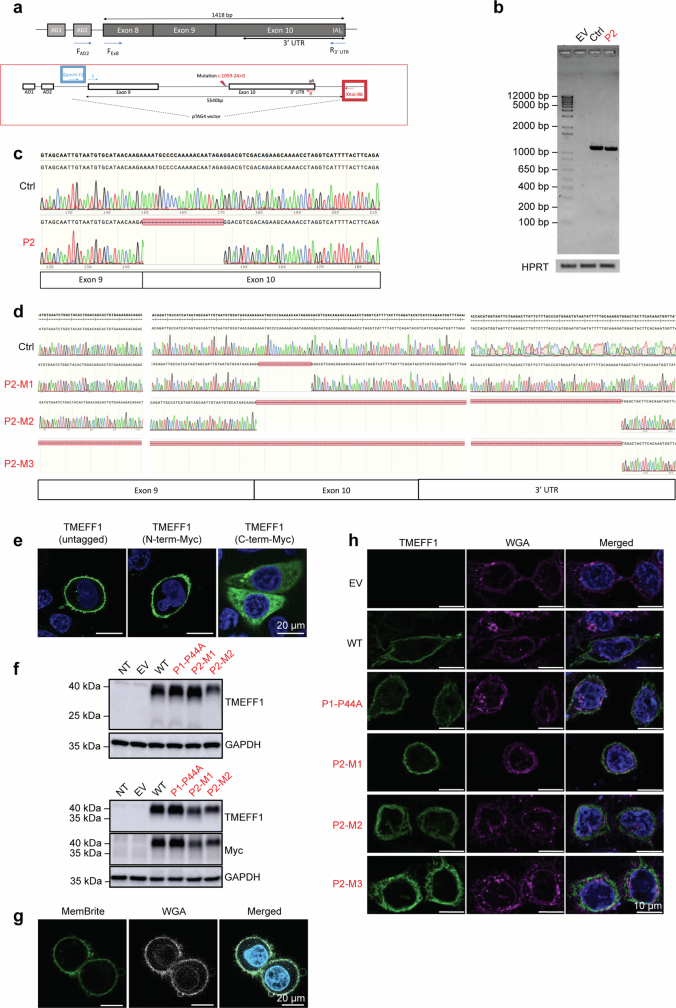
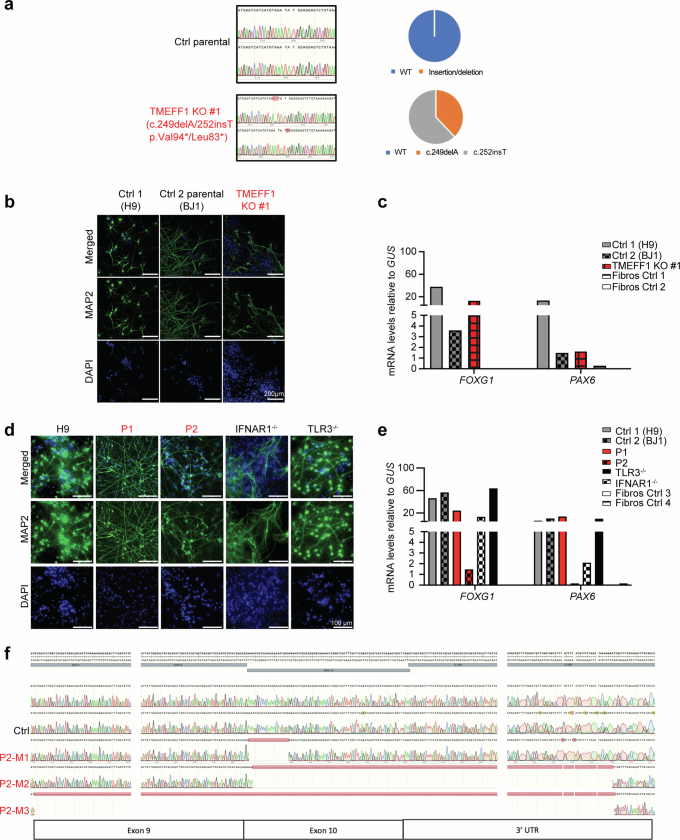
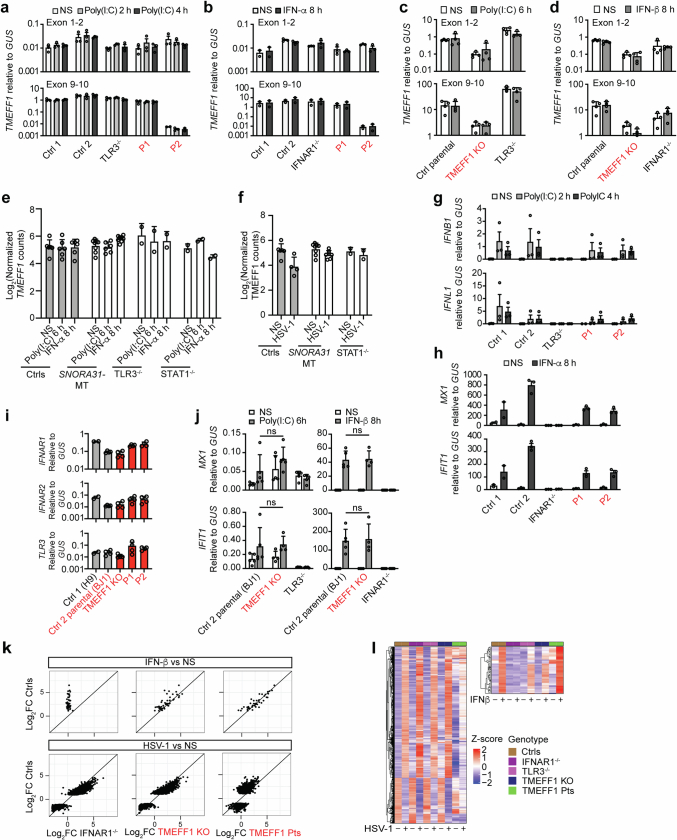
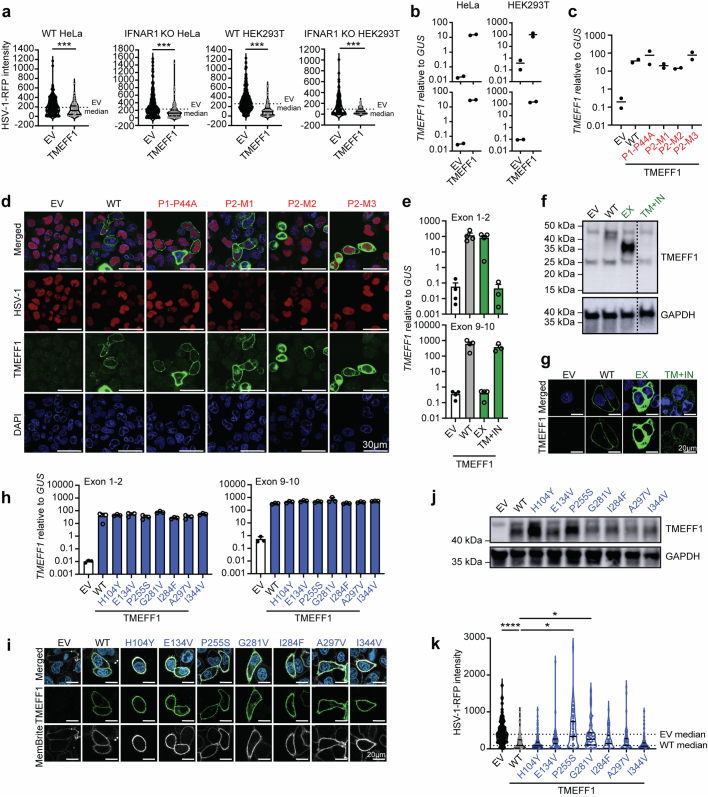
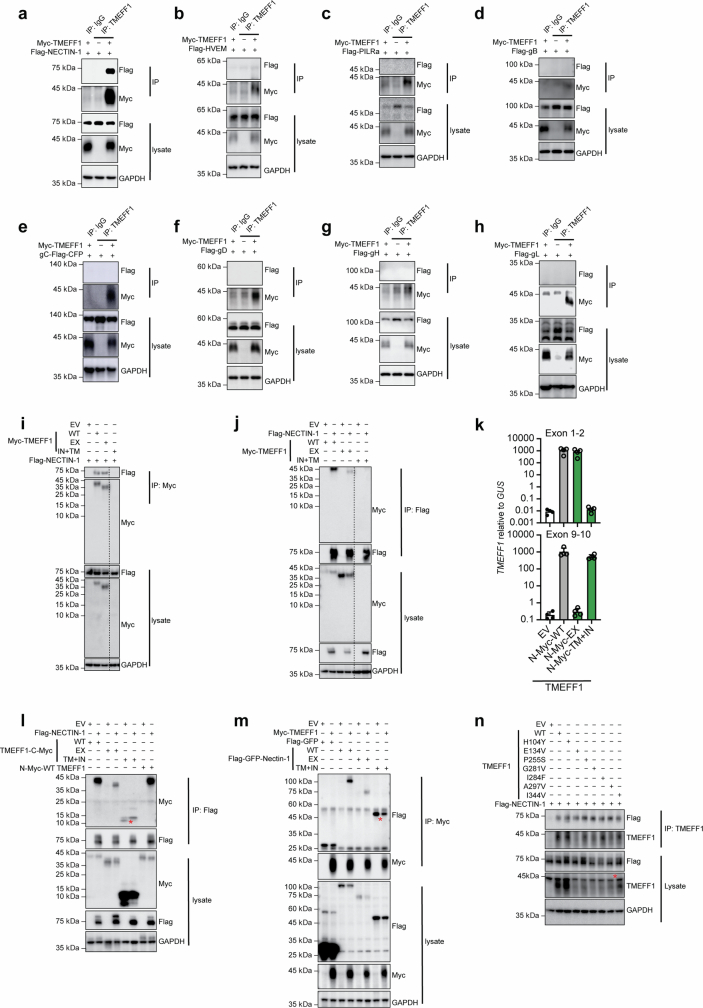
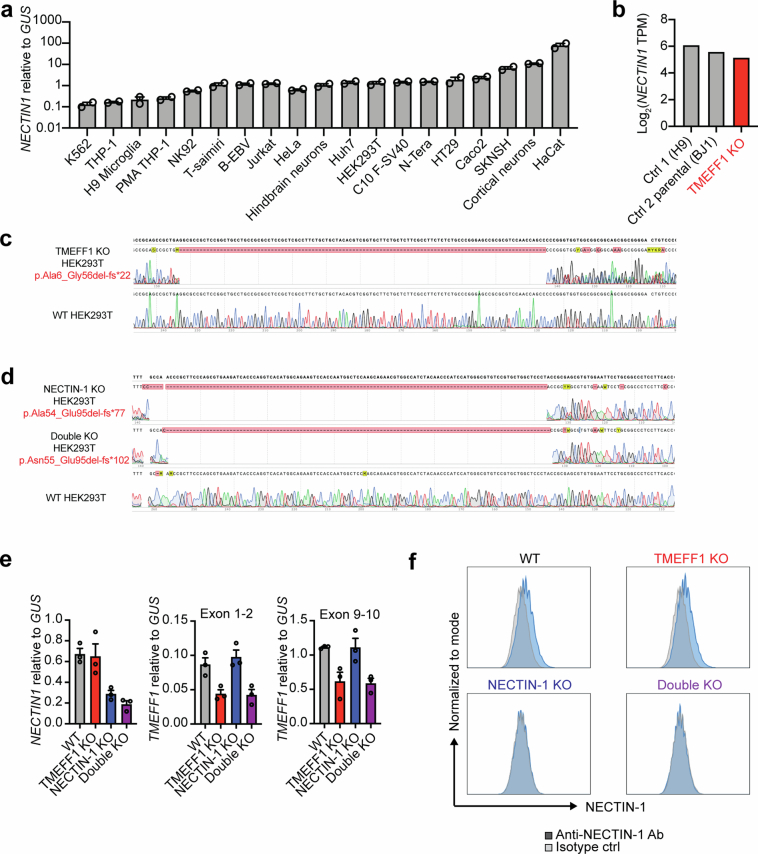
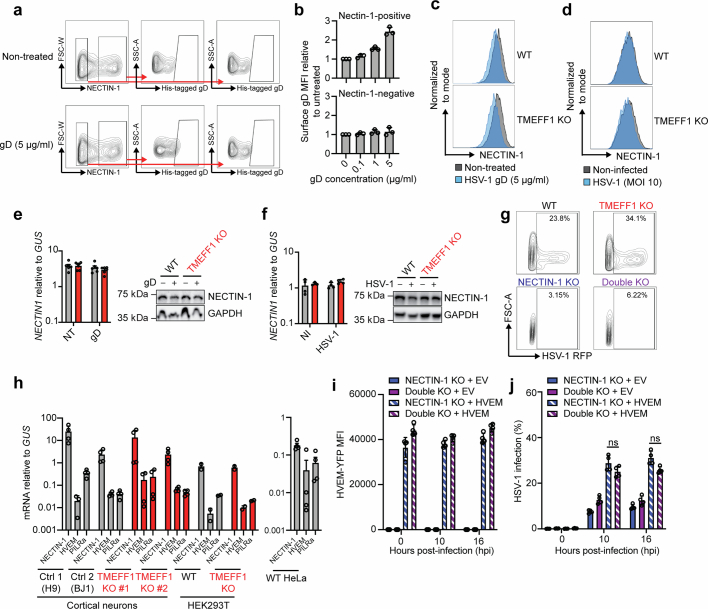
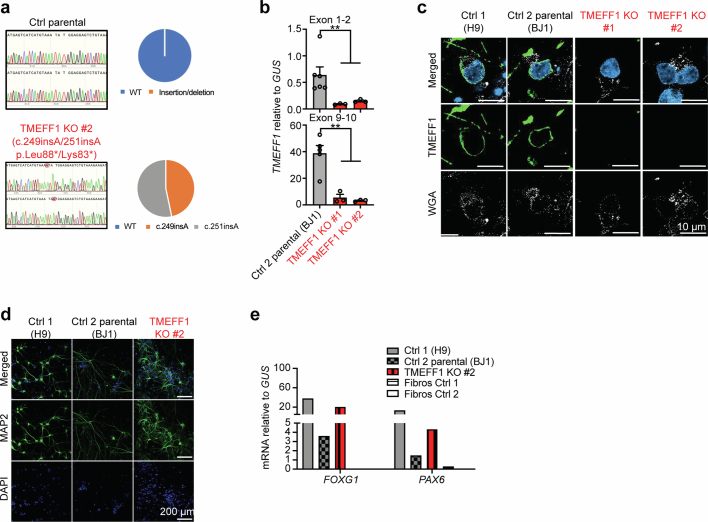
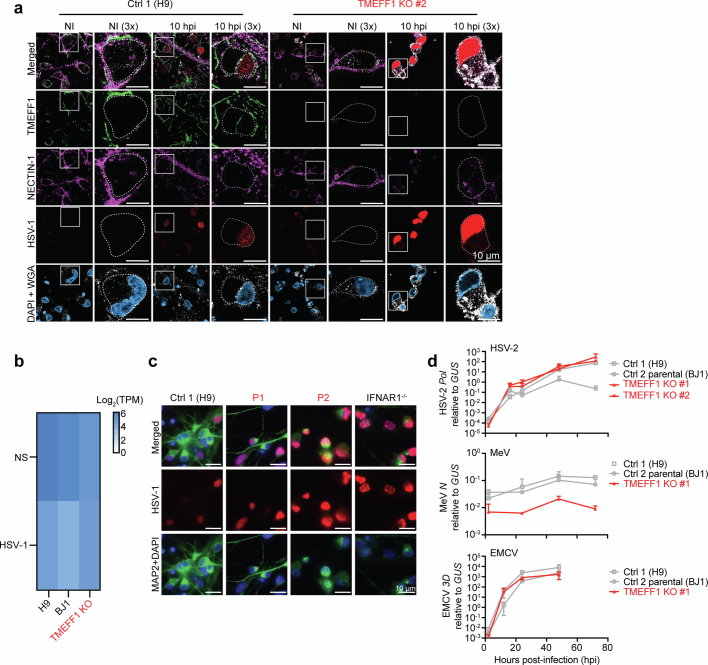
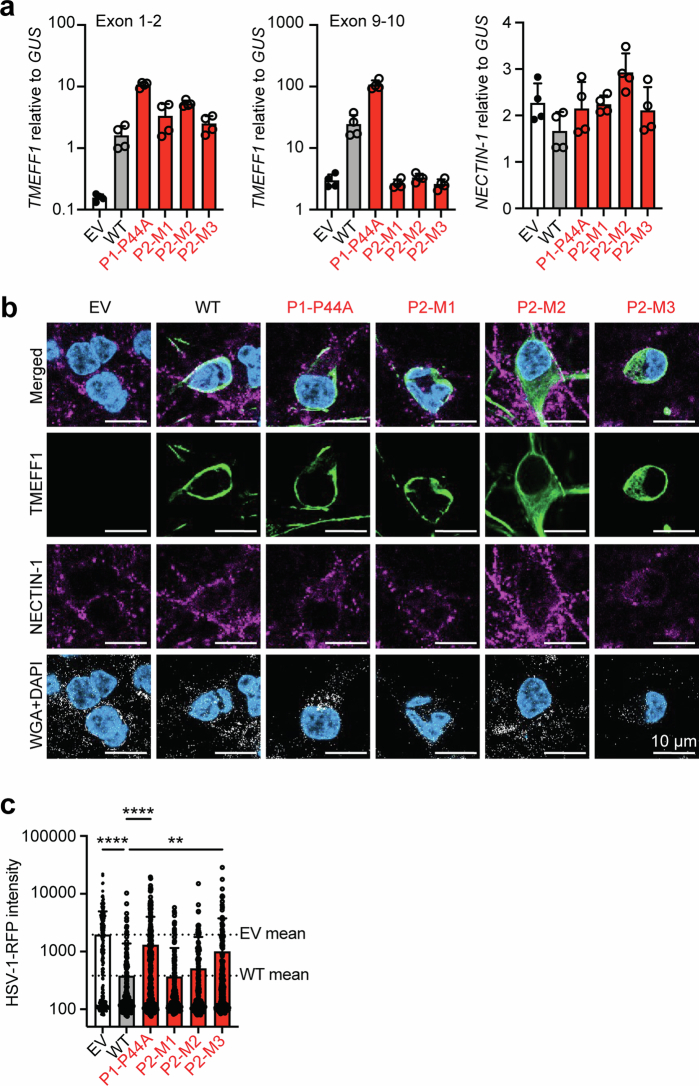
Most cases of herpes simplex virus 1 (HSV-1) encephalitis (HSE) remain unexplained1,2. Here, we report on two unrelated people who had HSE as children and are homozygous for rare deleterious variants of TMEFF1, which encodes a cell membrane protein that is preferentially expressed by brain cortical neurons. TMEFF1 interacts with the cell-surface HSV-1 receptor NECTIN-1, impairing HSV-1 glycoprotein D- and NECTIN-1-mediated fusion of the virus and the cell membrane, blocking viral entry. Genetic TMEFF1 deficiency allows HSV-1 to rapidly enter cortical neurons that are either patient specific or derived from CRISPR-Cas9-engineered human pluripotent stem cells, thereby enhancing HSV-1 translocation to the nucleus and subsequent replication. This cellular phenotype can be rescued by pretreatment with type I interferon (IFN) or the expression of exogenous wild-type TMEFF1. Moreover, ectopic expression of full-length TMEFF1 or its amino-terminal extracellular domain, but not its carboxy-terminal intracellular domain, impairs HSV-1 entry into NECTIN-1-expressing cells other than neurons, increasing their resistance to HSV-1 infection. Human TMEFF1 is therefore a host restriction factor for HSV-1 entry into cortical neurons. Its constitutively high abundance in cortical neurons protects these cells from HSV-1 infection, whereas inherited TMEFF1 deficiency renders them susceptible to this virus and can therefore underlie HSE.


Conflict of interest statement

The authors declare no competing interests.

Figures

Fig. 1
Fig. 1. Homozygous TMEFF1 variants in two unrelated children with HSE.
a, Family pedigree of patients 1 and 2 (P1 and P2), with segregation of the TMEFF1 mutations (red). b, Brain images for P1 and P2, with yellow arrows showing the lesions observed during HSE. c, Schematic of TMEFF1 cDNA and protein structure and the position of the two mutated residues. SP, signal peptide; TM, transmembrane domain. d, Graph showing the CADD scores of all TMEFF1 non-synonymous or essential splice-site variants reported in the homozygous state in the gnomAD database (v.4.1.0.) and their MAFs. Mutation significance cut-offs (MSCs) are shown for 95% and 99% confidence intervals. e, Amounts of TMEFF1 mRNA, as measured by RT–qPCR, in various human tissues. Data shown are from two independent experiments. GUS, β-glucuronidase. Source Data
Fig. 2
Fig. 2. Expression and subcellular distribution of mutant TMEFF1 proteins in vitro.
a, Relative abundance of TMEFF1 cDNA isoforms generated from mRNA extracted from primary fibroblasts from a healthy control (Ctrl) and P2, as assessed by TOPO-TA cloning. Mutant isoforms are shown in red. b, Schematic representation of TMEFF1 protein structure and the impact of P1’s missense mutation, and P2’s mutation resulting in three mutant isoforms (P2-M1, P2-M2, P2-M3). c, Amounts of TMEFF1 mRNA, as measured by RT–qPCR on HEK293T cells, not transfected (NT) or transfected with an empty vector (EV) or with plasmids containing WT or various patient-specific mutant TMEFF1 cDNA sequences. Two probes, targeting exons 1–2 (left) and exons 9–10 (right) of TMEFF1, were used. Data are presented as mean ± s.d. d, TMEFF1 protein levels, as assessed by western blotting on HEK293T cells, NT or transfected with various plasmids as in c. Protein lysates were either left untreated or were treated with peptide:N-glycosidase F (PNGase F). GAPDH, glyceraldehyde-3-phosphate dehydrogenase. e, TMEFF1 protein levels, as assessed by flow cytometry, in permeabilized and unpermeabilized HEK293T cells (right), NT or transfected with various plasmids as in c. Cell-surface TMEFF1 expression was quantified in unpermeabilized cells (left). Data are presented as mean ± s.d. Statistical analysis was done with Kruskal–Wallis tests with Dunn’s test for multiple comparisons. NS, not significant; *P < 0.05. MFI, mean fluorescence intensity. f, TMEFF1 immunostaining in HeLa cells transfected with an EV or with plasmids containing WT or various patient-specific mutant TMEFF1 cDNA sequences. MemBrite is a cell membrane marker. Blue indicates DAPI chromosome staining. Scale bars, 20 μm. The data shown in cf are representative of three independent experiments. Source Data
Fig. 3
Fig. 3. Enhanced HSV-1 susceptibility in TMEFF1-deficient hPSC-derived cortical neurons.
a, Levels of TMEFF1 mRNA, as determined by RT–qPCR, in various human cell lines or primary cells. b, TMEFF1 mRNA levels were determined by RT–qPCR in cortical neurons from control and TMEFF1-KO hPSCs. c, TMEFF1 protein expression was studied by confocal microscopy on cortical neurons derived from healthy control and TMEFF1-KO hPSCs. Cells were fixed and stained for TMEFF1 (anti-TMEFF1 antibody, green), cell membrane (wheat germ agglutinin (WGA), white) and chromosomes (DAPI, blue). Scale bar, 10 μm. d, Cortical neurons derived from hPSCs from healthy controls, TMEFF1-KO hPSCs and TLR3−/− hPSCs were infected with HSV-1 (MOI 0.001) and assessed for HSV-1 titres at the timepoints indicated. TCID50, 50% tissue culture infectious dose. e, TMEFF1 mRNA levels were determined by RT–qPCR on hPSC-derived cortical neurons for healthy controls and the two patients with TMEFF1 mutations (P1 and P2). f, Relative abundance of TMEFF1 cDNA isoforms generated from mRNA extracted from hPSC-derived cortical neurons for healthy controls and P2, as assessed by TOPO-TA cloning. g,h, hPSC-derived cortical neurons from a healthy control (H9), the patients with TMEFF1 mutations (P1 and P2) and other TLR3−/− and IFNAR1−/− HSE patients were infected with HSV-1 (MOI 0.001) and assessed for HSV-1 titres at the timepoints indicated, without (g) or with (h) IFNβ pretreatment for 18 h. The data shown in a, b, d, e, g and h are mean ± s.e.m. of three independent experiments. Statistical analysis: for b and e, two-tailed Mann-Whitney U-tests; for d, g and h, mean log-transformed relative values were compared between control cells and TMEFF1-mutated cells in one-way analysis of variance (ANOVA) with Tukey tests for multiple comparisons. *P < 0.05; **P < 0.01; ***P < 0.001; ****P < 0.0001. Source Data
Fig. 4
Fig. 4. TMEFF1 interacts with NECTIN-1 and restricts the early translocation of HSV-1 to the cell nucleus.
a,b, Measurement of HSV-1–RFP intensity in HeLa cells overexpressing an EV, WT or various patient-specific TMEFF1 mutants (a) or WT full-length TMEFF1, TMEFF1 extracellular domain (EX) or transmembrane and intracellular domains (TM + IN) (b) at 10 h post-infection (hpi). Statistical analysis: Kruskal–Wallis tests with Dunn’s test for multiple comparisons; ***P < 0.001. a.u., arbitrary units. c,d, HEK293T cells were cotransfected with Flag-tagged NECTIN-1 and EV or WT TMEFF1 plasmids (c) or with WT TMEFF1 and EV or Flag-tagged NECTIN-1 plasmids (d), and subjected to immunoprecipitation (IP) with anti-TMEFF1 antibodies or anti-Flag antibody-conjugated agarose beads, and immunoblotting with anti-Flag or anti-TMEFF1 antibodies. e, HEK293T cells were infected with HSV-1 (MOI 1) and subjected to immunoprecipitation with mouse IgG isotype control or anti-NECTIN-1 antibody and immunoblotting with anti-NECTIN-1 or anti-TMEFF1 antibody. f, HEK293T cells were cotransfected with C-terminal Myc-tagged WT full-length or truncated (EX, TM + IN) TMEFF1 or N-terminal Myc-tagged WT full-length TMEFF1 plasmids with EV or Flag-tagged NECTIN-1 plasmids, and subjected to immunoprecipitation with anti-Myc antibody-conjugated agarose beads and immunoblotting with anti-Myc or anti-Flag antibody. g, HEK293T cells were cotransfected with the N-terminal Flag–GFP-tagged full-length or truncated (EX, TM + IN) NECTIN-1 plasmids with N-terminal Myc-tagged TMEFF1 plasmids, and subjected to immunoprecipitation with anti-Flag antibody-conjugated agarose beads and immunoblotting with anti-Myc or anti-Flag antibody. h, HEK293T cells were cotransfected with the N-terminal Flag-tagged WT full-length or EX NECTIN-1 plasmids and N-terminal Myc-tagged WT full-length or EX TMEFF1 plasmids, and subjected to immunoprecipitation with anti-Flag antibody-conjugated agarose beads and immunoblotting with anti-Myc or anti-Flag antibody. i, HEK293T cells were cotransfected with the N-terminal Flag-tagged NECTIN-1 and EV, WT or various patient-specific mutant TMEFF1 plasmids, and subjected to immunoprecipitation with anti-TMEFF1 antibody and immunoblotting with anti-TMEFF1 or anti-Flag antibody. The data shown in ai are representative of three independent experiments. Source Data
Fig. 5
Fig. 5. TMEFF1 interaction with NECTIN-1 on the cell surface impairs HSV-1 entry.
a, TMEFF1 and NECTIN-1 localization in HeLa cells after cotransfection or single transfection with the TMEFF1 and NECTIN-1 plasmids. Green, TMEFF1; purple, NECTIN-1; blue, DAPI; white, MemBrite. Scale bars, 20 μm. b, HeLa cells were cotransfected with CFP-tagged TMEFF1 and YFP-tagged NECTIN-1 or HVEM, and subjected to FRET imaging. Scale bars, 20 μm. CFP, cyan fluorescent protein; YFP, yellow fluorescent protein; Ex, excitation; Em, emission. c, Bleed-through-corrected FRET at the cell surface was quantified. df, Histograms of the surface His-tagged gD signal (d), the MFI of surface gD binding (e) and the percentage of surface gD-positive cells (f) after incubation with a His-tagged gD for 150 min in WT or TMEFF1-KO HEK293T cells stably expressing NECTIN-1. g, HEK293T cells were cotransfected with Flag-tagged gD, Myc-tagged NECTIN-1 and EV or TMEFF1 plasmids, then subjected to immunoprecipitation with anti-Flag antibody-conjugated agarose beads, and immunoblotting with anti-Flag, anti-Myc and anti-TMEFF1 antibodies. The data shown in ag are representative of three independent experiments. h,i, MFI of surface NECTIN-1 after gD treatment (h) or HSV-1 infection (i) relative to untreated cells (left) and MFI of total NECTIN-1 in the presence or absence of gD treatment or HSV-1 infection (right) on WT or TMEFF1-KO HEK293T cells. j, HSV-1–RFP infection rates in WT and TMEFF1-KO HEK293T cells 8 hours after infection. k, HSV-1–RFP intensity in WT and TMEFF1-KO HEK293T cell nucleus 8 hours after infection. Data are shown as median ± interquartile range and are representative of five independent experiments. l, HSV-1–RFP infection rates in WT, TMEFF1 KO, NECTIN-1 KO and TMEFF1-and-NECTIN-1 double-KO HEK293T cells, as assessed by flow cytometry 8 hours after infection. Data are shown as mean ± s.e.m. from three (b, c, e and f), six (h and i), five (j) or four (l) independent experiments. Statistical analysis was done for c, hi, j, k and l using two-tailed Mann–Whitney U tests; *P < 0.05; ***P < 0.001. Source Data
Fig. 6
Fig. 6. Enhanced HSV-1 entry results in greater viral susceptibility in TMEFF1-deficient cortical neurons.
a, Representative images of healthy control (Ctrl 2 parental-BJ1) and TMEFF1-KO hPSC-derived cortical neurons, stained for endogenous TMEFF1 (green), NECTIN-1 (purple), chromosomes (DAPI, blue) and cell membrane (WGA, white) before and 10 h after infection (hpi) with an RFP reporter HSV-1 (red). The dashed grey line is located immediately beneath the WGA-stained cell membrane. The areas in white squares are enlarged in the image on the right. Scale bar, 10 μm. The images are representative of three independent experiments. NI, non-infected. b, Comparison of HSV-1 entry into heathy control (Ctrl 1-H9, Ctrl 2 parental-BJ1) and TMEFF1-KO hPSC-derived cortical neurons in a β-lactamase assay (449/520 nm). Data are shown as median ± interquartile range and are representative of three independent experiments. c, Representative images of hPSC-derived cortical neurons in an HSV-1–RFP cell nuclear translocation reporter assay 10 h after infection. Neurons were identified by staining for microtubule-associated protein 2 (MAP2, green) and chromosomes (DAPI, blue). Scale bar, 10 μm. d,e, Percentage of HSV-1-positive (d) and cell nuclear RFP intensity (e) of healthy control and TMEFF1-KO hPSC-derived cortical neurons 10 h after infection. f, Comparison of HSV-1 entry into healthy control (H9), IFNAR1−/−, P1 and P2 hPSC-derived cortical neurons in the β-lactamase assay. g,h, Percentage of HSV-1-positive (g) and cell nuclear RFP intensity (h) of healthy control, IFNAR1−/−, P1 and P2 hPSC-derived cortical neurons 10 h after infection. i, Percentage of HSV-1-positive TMEFF1-KO cortical neurons transduced with EV, WT TMEFF1 or patient-specific TMEFF1 variant cDNA 10 h after infection. Data are shown as mean ± s.e.m. (d, g and i) or median ± interquartile range (e, f and h) from four (d and e) or three (f, g, h and i) independent experiments. Statistical analysis was done for d, g and i using two-tailed Mann–Whitney U tests, and for b, e, f and h using Kruskal–Wallis tests with Dunn’s test for multiple comparisons. *P < 0.05; **P < 0.01; ***P < 0.001; ****P < 0.0001. Source Data
Extended Data Fig. 1
Extended Data Fig. 1. Homozygous TMEFF1 variants in two unrelated children with HSE.
a, CoNeS analysis of negative selection for TMEFF1 plotted against the density distribution for genes underlying autosomal dominant (AD) inborn errors of immunity (IEI), autosomal recessive (AR) IEI, and AR/AD IEI. b, VirScan test for antibodies against a wide range of viruses and other pathogens in the serum of the two patients, 8 years (P1) and 10 years (P2) after the HSE episode, and in their parents. The numerical values in the heatmap represent the number of enriched non-overlapping peptides recognized by the antibodies in the serological sample. c, Viral serological test on the two patients, 8 years (P1) and 10 years (P2) after the HSE episode, and their relatives. Samples with values below the detection threshold are indicated as N (negative). d, Electropherogram showing the TMEFF1 gDNA sequences surrounding the mutations of interest, in a healthy control (Ctrl), P1, P2, and their parents. e, Alignment of TMEFF1 protein sequences around the P44 residue or the cytoplasmic tail, across species. Numbers in parentheses indicate the amino-acid position in each organism.
Extended Data Fig. 2
Extended Data Fig. 2. Assessment of the impact of P2’s variant, and the subcellular distribution of TMEFF1.
a, Schematic representation of the experimental design of the TOPO-cloning (upper panel) and exon-trapping (lower panel) experiments. In brief, for TOPO-TA, 1418 bp of cDNA, corresponding to exons 8 to 10 and including the 3’UTR and a polyA tail, for a control or P2 was extracted, amplified and inserted into a reporter vector for cDNA sequencing. For the exon-trapping experiment, a 5540 bp gDNA sequence for a control or P2 was amplified with forward and reverse primers, as shown. All of exons 9 and 10, including most of the 3’UTR, was amplified. The amplified gDNA was then digested with the BamHI and Xho1 enzymes and inserted into a pTAG4 vector, which was then used to transfect COS-7 cells for DNA extraction. P2’s essential splice-site mutation is indicated by a lightning bolt. b, Image of the gel, showing the fragment of cDNA amplified in the exon-trapping experiment, after amplification, insertion into the pTAG4 plasmid, the transfection of COS-7 cells, extraction of mRNA and amplification of the cDNA by PCR. The fragment obtained for the patient is of slightly lower molecular weight. Representative data from three independent experiments are shown. c, Sequencing results for the cDNA extracted from COS-7 cells following transfection with the pTAG4 plasmid containing gDNA from a control and P2, after the exon-trapping experiment as described in a-b. Experiments with the patient’s cDNA indicated that a single transcript lacking the first 21 nucleotides of exon 10 was produced. The data shown are representative of three independent experiments. d, Sequencing results for the TMEFF1 cDNA extracted from primary fibroblasts from a control and P2, after the TOPO-TA experiment. Experiments with the patient’s cDNA indicated that a single transcript lacking the first 21 nucleotides of exon 10 (P2-M1) was produced, as in the exon-trapping experiment, but there were also two additional transcripts with larger deletions encompassing the entire coding sequence of exon 10 and part of the 3’UTR (P2-M2) and encompassing the entire coding sequence of exons 9 and 10 and part of the 3’UTR (P2-M3). Data representative of three independent experiments are shown. e, Immunostaining for TMEFF1 in HeLa cells transfected with plasmids containing wild-type (WT) untagged, or N-ter Myc-tagged or C-ter Myc-tagged TMEFF1 cDNA sequences, showing that the C-ter Myc-tag impairs the expression of TMEFF1 at the cell surface. The data shown are representative of three independent experiments. f, Immunoblotting for TMEFF1 in HEK293T cells transfected with plasmids containing wild-type (WT) or mutant TMEFF1 sequences without a tag (upper panel), or with a C-ter Myc-tag (lower panel). The data shown are representative of three independent experiments. g, Cell membrane labeling with two different staining kits, MemBrite (green) and wheatgerm agglutinin (WGA, white). h, TMEFF1 immunostaining in HeLa cells transfected with an empty vector (EV) or with plasmids containing wild-type (WT) or various patient-specific mutant TMEFF1 cDNA sequences. WGA: cell membrane marker. Blue indicates DAPI chromosome staining. Data representative of three independent experiments are shown.
Extended Data Fig. 3
Extended Data Fig. 3. Characterization of hPSC-derived CNS cortical neurons.
a, Electropherogram representation (left panels) of the CRISPR-Cas9-introduced compound-heterozygous TMEFF1 mutations confirmed by Sanger sequencing on genomic DNA from a gene-edited TMEFF1 KO hPSC line (TMEFF1 KO #1). Sequencing results for the parental line (Ctrl parental, BJ1) are also shown. The relative abundance of WT or mutated TMEFF1 cDNA generated from mRNA extracted from the control parental and TMEFF1 KO hPSCs was assessed by TOPO-TA cloning and is shown in the right panels. b, Representative images of cortical neurons from controls (Ctrl 1-H9, Ctrl 2 parental-BJ1) and TMEFF1 KO hPSCs. Cells were fixed and stained with DAPI (blue) and for a neuron-specific marker, microtubule-associated protein 2 (MAP2, green). c, FOXG1 and PAX6 mRNA levels, as measured by RT-qPCR, in cortical neurons from control and TMEFF1 KO hPSCs. SV40-transformed fibroblasts from healthy controls (Fibros ctrl 1, Fibros ctrl 2) were used as a negative control in this assay. d, Representative images of cortical neurons from control (H9) and various patient-specific hPSC lines (P1, P2, IFNAR1−/−, TLR3−/−). Cells were fixed and stained with DAPI (blue), and for a neuron-specific marker MAP2 (green). e, FOXG1 and PAX6 mRNA levels were measured by RT-qPCR in cortical neurons derived from control and patient-specific hPSC lines. SV40-transformed fibroblasts from healthy controls (Fibros ctrl 3, Fibros ctrl 4) were used as a negative control in this assay. f, Electropherogram representation of the three TMEFF1 mutant isoforms, as detected by TOPO-cloning of cDNA from P2’s hPSC-derived cortical neurons. Source Data
Extended Data Fig. 4
Extended Data Fig. 4. Intact TLR3 and type I IFN responses in TMEFF1-mutated cells.
a, TMEFF1 mRNA levels were determined by RT-qPCR, in SV40-transformed fibroblasts from the patients with TMEFF1 mutations, a TLR3−/− HSE patient, and healthy controls treated with poly(I:C) for 2 or 4 h or left untreated (NS). b, TMEFF1 mRNA levels were measured by RT-qPCR, in SV40-transformed fibroblasts from patients with TMEFF1 mutations, an IFNAR1−/− HSE patient, and healthy controls treated with IFN-α2b for 8 h or left untreated. c, TMEFF1 mRNA levels were measured by RT-qPCR in cortical neurons derived from control parental or TMEFF1 KO hPSCs, and hPSCs from a TLR3−/− HSE patient, after treatment with poly(I:C) for 6 h, or without treatment. d, TMEFF1 mRNA levels were measured by RT-qPCR, in cortical neurons derived from control parental or TMEFF1 KO hPSCs, and hPSCs from an IFNAR1−/− HSE patient treated with IFN-β for 8 h or left untreated. In a-d, two probes, targeting exons 1-2 (upper panels) and exons 9-10 (lower panels) of TMEFF1 were used. The data shown are the means ± SEM from three (a,b) or two (c,d) independent experiments. e, Abundance of TMEFF1 mRNA, as assessed by RNAseq, in healthy control neurons (Ctrls, n = 6), SNORA31-mutated (SNORA31-MT, n = 8), TLR3−/− (n = 2) or STAT1−/− (n = 2) hPSC-derived cortical neurons treated with poly(I:C) or IFN-α2b, or left unstimulated (NS). Data are presented as mean ± SD. f, Abundance of TMEFF1 mRNA, as assessed by RNAseq, in healthy controls (Ctrls, n = 6), SNORA31-mutated (SNORA31-MT, n = 8) or STAT1−/− (n = 2) hPSC-derived cortical neurons infected with HSV-1 for 24 h, or left unstimulated (NS). g, IFNB1 (upper panel) or IFNL1 (lower panel) mRNA levels were measured by RT-qPCR, in SV40-transformed fibroblasts from the patients with TMEFF1 mutations, a TLR3−/− HSE patient, and healthy controls, after treatment with poly(I:C) for 2 or 4 h or without treatment. h, MX1 (upper panel) or IFIT1 (lower panel) mRNA levels were measured by RT-qPCR, in SV40-transformed fibroblasts from the patients with TMEFF1 mutations, an IFNAR1−/− HSE patient, and healthy controls, after treatment with IFN-α2b for 8 h, or without treatment. The data shown in g, and h are the means ± SEM from three independent experiments. i, Basal levels of IFNAR1 (top panel), IFNAR2 (middle panel), and TLR3 (lower panel) mRNA were measured by RT-qPCR, in hPSC-derived cortical neurons from healthy controls (Ctrl 1-H9, Ctrl 2-Parental BJ1), TMEFF1 KO hPSCs, or hPSCs from TMEFF1-mutated patients. j, Levels of MX1 (upper panels) or IFIT1 (lower panels) mRNA were measured by RT-qPCR, in cortical neurons derived from control parental or TMEFF1 KO hPSCs, hPSCs from a TLR3−/− HSE patient, and an IFNAR1−/− HSE patient, with and without treatment with poly(I:C) for 6 h (left panels), or with IFN-β for 8 h (right panels). Statistical analysis was performed with two-tailed Mann-Whitney U tests. ns: not significant. k, Scatterplots of the mean log2 fold-changes in RNAseq-quantified gene induction following stimulation with 100 IU/ml IFN-β for 8 h (upper panel) or HSV-1 (MOI 1) for 24 h (lower panel) in hPSC-derived CNS cortical neurons from two healthy controls (Ctrl1-H9, Ctrl2 parental-BJ1), TMEFF1-mutated patients (TMEFF1 Pts) or TMEFF1 KO hPSCS, or hPSCs from an IFNAR1−/− HSE patient. Each point represents a single gene. Genes with an absolute fold-change in expression > 2 in response to IFN-β or HSV-1 treatment relative to NS samples in the Ctrl group are plotted. l, Heatmaps of RNA-Seq-quantified gene expression (z-score-scaled DESeq2 vst-normalization) in hPSC-derived CNS cortical neurons from healthy controls (Ctrl 1-H9, Ctrl 2-Parental BJ1) or TMEFF1 KO hPSCS, or hPSCs from an IFNAR1−/− HSE patient, a TLR3−/− HSE patient and TMEFF1-mutated P1 and P2 (TMEFF1 Pts), not stimulated (NS), stimulated with HSV-1 for 24 h, or stimulated with IFN-β for 8 h. Duplicates were studied for each set of conditions and mean gene expression levels were used for subsequent analyses. The heatmap includes genes with a relative fold-change in expression > 2 in response to HSV-1 or IFN-β treatment relative to NS samples in the Ctrl group. Source Data
Extended Data Fig. 5
Extended Data Fig. 5. TMEFF1 restricts the early translocation of HSV-1 to the cell nucleus.
a, RFP intensity in HeLa and HEK293T cells, as measured in an HSV-1-RFP nuclear translocation reporter assay 10 h after infection with an RFP-reporter HSV-1, on parental WT cells or IFNAR1 KO cells transfected with an empty vector (EV) or WT TMEFF1 expression construct. HeLa or HEK293T cells were labeled with an anti-TMEFF1 antibody. RFP intensity was assessed under a confocal microscope. Statistical analysis was performed with two-tailed Mann-Whitney U tests. ***p-value < 0.001. The data shown are representative of three independent experiments. b, TMEFF1 mRNA levels in HeLa (left panel) and HEK293T cells (right panel), either parental WT (top) or IFNAR1 KO (bottom), transfected with an EV or a WT TMEFF1 expression plasmid, as measured by RT-qPCR. A probe targeting exons 1-2 of TMEFF1 was used. c, TMEFF1 mRNA levels in HeLa cells transfected with an EV, or a WT or mutant TMEFF1 expression plasmid, as measured by RT-qPCR. A probe targeting exons 1-2 of TMEFF1 was used. d, Representative images of HeLa cells transfected with an EV, or a WT or mutant TMEFF1 expression plasmid, in an HSV-1-RFP nuclear translocation reporter assay. The cells were fixed and identified by DAPI staining (blue). HSV-1-RFP infection results in the expression of RFP, the levels of which were assessed in the nucleus at 10 hpi. e, TMEFF1 mRNA levels in HeLa cells transfected with an EV, or a WT full-length (FL) TMEFF1 or different domains of TMEFF1 in an expression plasmid (EX: extracellular domain; TM + IN: transmembrane and intracellular domains), as measured by RT-qPCR. Two probes, targeting exons 1-2 (upper panel) and exons 9-10 (lower panel) of TMEFF1, were used. The data shown are representative of three independent experiments. f, TMEFF1 protein levels, as assessed by western blotting in HeLa cells transfected with an EV, or a WT FL or different domains of TMEFF1 in an expression plasmid. g, TMEFF1 immunostaining in HeLa cells transfected with an EV, or a WT FL or different domains of TMEFF1 in an expression plasmid. HeLa cells were labeled with anti-TMEFF1 antibody (green) and DAPI (blue) and TMEFF1 overexpression was assessed under a confocal microscope. h, TMEFF1 mRNA levels in HeLa cells transfected with an EV or with plasmids containing WT or gnomAD homozygous mutant (H104Y, E134V, P255S, G281V, I284F, A297V, I344V) TMEFF1 cDNAs, as measured by RT-qPCR. Two probes, targeting exons 1-2 (upper panel) and exons 9-10 (lower panel) of TMEFF1, were used. i, TMEFF1 immunostaining in HeLa cells transfected with an EV or with plasmids containing WT or gnomAD homozygous mutant (H104Y, E134V, P255S, G281V, I284F, A297V, I344V) TMEFF1 cDNAs. HeLa cells were labeled with anti-TMEFF1 antibody (green), membrane stain (MemBrite, white), and DAPI (blue) and TMEFF1 overexpression was assessed under a confocal microscope. The data shown in c-i are representative of three independent experiments. j, TMEFF1 protein levels, as assessed by western blotting on HeLa cells transfected with an EV or with plasmids containing WT or gnomAD homozygous mutant (H104Y, E134V, P255S, G281V, I284F, A297V, I344V) TMEFF1 cDNAs. k, Measurement of RFP intensity in an HSV-1-RFP nuclear translocation reporter assay, 10 h after infection, in HeLa cells cells transfected with an EV or with plasmids containing WT or gnomAD homozygous mutant (H104Y, E134V, P255S, G281V, I284F, I344V) TMEFF1 cDNAs. HeLa cells were labeled with anti-TMEFF1 antibody and DAPI. RFP intensity was assessed under a confocal microscope. Statistical analysis was conducted with Kruskal-Wallis tests with Dunn’s test for multiple comparisons. ns: not significant, *p-value < 0.05; **** p-value < 0.0001. The data shown in j-k are representative of three independent experiments. Source Data
Extended Data Fig. 6
Extended Data Fig. 6. TMEFF1 does not interact with cellular receptors of HSV-1 other than nectin-1 or with HSV-1 glycoproteins.
a-h, HEK293T cells were cotransfected with N-ter Myc-tagged TMEFF1 constructs and Flag-tagged NECTIN-1 (a), HVEM (b), PILRa (c), gB (d), gC (e), gD (f), gH (g), or gL (h). The cells were then subjected to immunoprecipitation (IP) with mouse IgG isotype control or anti-TMEFF1 Ab, and immunoblotting with anti-Flag or anti-Myc Abs. i-j, N-ter Flag-tagged NECTIN-1 constructs were co-expressed with N-ter Myc-tagged WT full-length (FL) or different domains (EX, TM + IN) of TMEFF1 in expression constructs in HEK293T cells, which were subjected to IP with anti-Myc Ab-conjugated agarose beads (i), or anti-Flag Ab-conjugated agarose beads (j), and immunoblotting with anti-Myc or anti-Flag Ab. k, TMEFF1 mRNA levels, as determined by RT-qPCR, in HEK293T cells 24 h after transfection with N-ter Myc-tagged WT full-length (FL) or different domains (EX, TM + IN) of TMEFF1 in expression constructs. l, HEK293T cells were cotransfected with C-ter Myc-tagged WT FL, different domains (EX, TM + IN) of TMEFF1 in expression constructs, or an N-ter Myc-tagged WT FL TMEFF1 plasmid, together with EV or N-ter Flag-tagged NECTIN-1-expressing constructs. The cells were then subjected to IP with anti-Flag Ab-conjugated agarose beads and immunoblotting with anti-Myc or anti-Flag Ab. m, HEK293T cells were cotransfected with the N-ter Flag-GFP-tagged WT FL or different domains (EX, TM + IN) of NECTIN-1 in expression constructs together with N-ter Myc-tagged TMEFF1 constructs, and subjected to IP with anti-Myc Ab-conjugated agarose beads and immunoblotting with anti-Myc or anti-Flag Ab. For l-m, the red asterisk indicates non-specific binding. n, HEK293T cells were cotransfected with N-ter Flag-tagged NECTIN-1-expressing constructs and TMEFF1-expressing constructs containing the cDNA for the WT or homozygous TMEFF1 variants from the gnomAD database (H104Y, E134V, P255S, G281V, I284F, A297V, I344V). The cells were then subjected to IP with anti-Flag Ab-conjugated agarose beads, and immunoblotting with anti-TMEFF1 or anti-Flag antibodies. The red asterisk indicates non-specific binding. The data shown in a-n are representative of three independent experiments. Source Data
Extended Data Fig. 7
Extended Data Fig. 7. Characterization of gene-edited HEK293T lacking TMEFF1 or NECTIN-1.
a, Levels of NECTIN1 mRNA, as determined by RT-qPCR, in various human cell lines or primary cells. The data shown are from two independent experiments. b, Abundance of the canonical NECTIN1 transcript (isoform 1, delta, ENST00000264025.8) as assessed by RNAseq, in cortical neurons derived from gene-edited line of TMEFF1 KO hPSCs, and from healthy controls (H9, BJ1). NECTIN1 transcripts for isoform 2 (ENST00000341398.6) and 3 (ENST00000340882.2) were undetectable. c, Electropherogram showing the TMEFF1 gDNA sequence at the sgRNA target region in WT and TMEFF1 KO HEK293T cells. d, Electropherogram showing the NECTIN1 gDNA sequence at the sgRNA target region in WT, NECTIN-1 KO, and TMEFF1 and NECTIN-1 double KO HEK293T cells. e, Levels of NECTIN1 (left panel) and TMEFF1 (center and right panels) mRNA, as determined by RT-qPCR, in WT, TMEFF1 KO, NECTIN-1 KO, and TMEFF1 and NECTIN-1 double KO HEK293T cells. Two probes, targeting exons 1-2 (center panel) and exons 9-10 (right panel), were used for TMEFF1. f, Cell-surface NECTIN-1 protein expression assessed by flow cytometry in WT, TMEFF1 KO, NECTIN-1 KO, and TMEFF1 and NECTIN-1 double KO HEK293T cells. Source Data
Extended Data Fig. 8
Extended Data Fig. 8. TMEFF1 restricts the early translocation of HSV-1 to the cell nucleus by interfering with gD-NECTIN-1-mediated viral entry.
a, Representative gating strategy for HEK293T cells stably expressing NECTIN-1, not treated or treated with recombinant His-tagged HSV-1 gD for 150 min. b, Mean fluorescence intensity (MFI) of surface gD binding in NECTIN-1-positive or NECTIN-1-negative fractions of HEK293T cells stably expressing NECTIN-1, following incubation with different concentrations of His-tagged gD (gD-His-Tag) for 150 min. c, Histogram of surface NECTIN-1 expression in WT and TMEFF1 KO HEK293T cells incubated with recombinant His-tagged HSV-1 gD (5 µg/ml) for 150 min. The data shown are representative of three independent experiments. d, Histogram of surface NECTIN-1 expression in WT and TMEFF1 KO HEK293T cells infected with HSV-1 (MOI 10) for 45 min. The data shown are representative of three independent experiments. e, NECTIN1 mRNA levels (left panel) as determined by RT-qPCR in total RNA, and protein expression in cell total lysates as assessed by immunoblotting (right panel), in TMEFF1 KO or parental WT HEK293T cells upon gD treatment for 150 min or without treatment. f, NECTIN1 mRNA levels (left panel) as determined by RT-qPCR in total RNA, and protein expression in cell total lysates as assessed by immunoblotting (right panel), in TMEFF1 KO or parental WT HEK293T cells after infection with HSV-1 for 45 min, or without infection. g, Representative contour plots of the RFP signal in WT, TMEFF1 KO, NECTIN-1 KO, and TMEFF1 and NECTIN-1 double KO HEK293T cells infected with HSV-1-RFP (MOI 10) at 8 hpi. h, Basal mRNA levels for NECTIN-1, HVEM, and PILRa, as assessed by RT-qPCR, in WT parental or TMEFF1 KO hPSC-derived cortical neurons and HEK293T cells (left panel), and WT HeLa cells (right panel). The data shown are the mean ± SEM from three independent experiments. i, MFI of N-ter YFP-tagged HVEM on the cell surface in NECTIN-1 KO and TMEFF1 and NECTIN-1 double KO HEK293T cells transfected with an empty vector (EV), or N-ter YFP-tagged HVEM-expressing plasmid. The data shown are the mean ± SEM from four independent experiments. j, Percentage of HSV-1-positive cells, as assessed in an assay of HSV-1 translocation to the cell nucleus 10 h after infection with an RFP-reporter HSV-1, in NECTIN-1 KO or TMEFF1 and NECTIN-1 double KO HEK293T cells transfected with an empty vector (EV) or HVEM-expressing plasmid. The data are presented as the mean ± SEM from four independent experiments. Statistical analysis was conducted with Kruskal-Wallis tests with Dunn’s test for multiple comparisons. ns: not significant. Source Data
Extended Data Fig. 9
Extended Data Fig. 9. Characterization of additional gene-edited line of hPSC-derived cortical neurons lacking TMEFF1.
a, Electropherogram representation (left panels) of the CRISPR-Cas9-introduced compound-heterozygous TMEFF1 mutations confirmed by Sanger sequencing on genomic DNA from an additional gene-edited line of TMEFF1 KO hPSCs (TMEFF1 KO #2). Sequencing results for the parental line (Ctrl parental, BJ1) are also shown. The relative abundance of WT and mutated TMEFF1 cDNAs generated from mRNA extracted from the parental control and TMEFF1 KO hPSC clone #2 was assessed by TOPO-TA cloning and is shown in the panels on the right. b, TMEFF1 mRNA levels were determined by RT-qPCR on cortical neurons from control parental clones and two different clones of TMEFF1 KO human pluripotent stem cells (hPSCs). Two probes, targeting exons 1-2 (upper panel) and exons 9-10 (lower panel) of TMEFF1, were used. The data shown are the mean ± SEM from three independent experiments. Statistical analysis was conducted with two-tailed Mann-Whitney U tests. **p-value < 0.01. c, TMEFF1 protein expression was studied by confocal microscopy on cortical neurons derived from healthy control H9, control parental (BJ1) and TMEFF1 KO hPSCs. Cells were fixed and stained for TMEFF1 with anti-TMEFF1 antibody (green), the cell membrane was stained with WGA (white), and chromosomes were stained with DAPI (blue). d, Representative images of cortical neurons from controls (Ctrl 1-H9, Ctrl 2 parental-BJ1) and TMEFF1 KO hPSC line #2. Cells were fixed and stained with DAPI (blue) and with microtubule-associated protein 2 (MAP2, green) as a neuron-specific marker. e, FOXG1 and PAX6 mRNA levels, as measured by RT-qPCR, in cortical neurons from a control and TMEFF1 KO hPSC line #2. SV40-transformed fibroblasts from healthy controls (Fibros ctrl 1, Fibros ctrl 2) were used as a negative control in this assay. Source Data
Extended Data Fig. 10
Extended Data Fig. 10. Enhanced HSV-1 entry resulting in greater viral susceptibility in cortical neurons lacking TMEFF1.
a, Immunostaining of hPSC-derived cortical neurons from healthy control (H9) and TMEFF1 KO hPSCs (TMEFF1 KO #2) for endogenous TMEFF1 (green), NECTIN-1 (purple), AT-rich DNA (DAPI, blue) and the cell membrane (WGA, white) before and 10 h after infection with an RFP-reporter HSV-1 (red). The dashed white line is immediately beneath the WGA-stained cell membrane. b, Abundance of NECTIN1 mRNA, as assessed by RNAseq, in WT controls (Ctrl1-H9, Ctrl2 parental-BJ1) and TMEFF1 KO hPSC-derived cortical neurons infected with HSV-1 for 24 h or left unstimulated (NS). c, Immunostaining of hPSC-derived cortical neurons from a healthy control (Ctrl1-H9), an IFNAR1−/− patient, and P1 and P2 with TMEFF1 mutations, in a reporter assay for the nuclear translocation of HSV-1, 10 h after infection with an RFP-reporter HSV-1. Neurons were fixed and identified by staining for a neuron-specific microtubule-associated protein 2 (MAP2, green) and with DAPI (blue). HSV-1-RFP infection results in the expression of RFP, which was detected in the nucleus 10 hpi. d, Replication levels for HSV-2, measles virus (MeV), or EMCV, following infection at various time points as indicated, in hPSC-derived cortical neurons from healthy controls (Ctrl1-H9, Ctrl2 parental-BJ1), or TMEFF1 KO hPSCs. RT-qPCR was performed with the SYBR green assay, to assess HSV-2 polymerase (Pol), MeV nucleocapsid (N) or EMCV 3D gene expression indicative of viral replication levels. The data are presented as the mean ± SD and are representative of four independent experiments. Source Data
Extended Data Fig. 11
Extended Data Fig. 11. Exogenous expression of wild-type but not mutant TMEFF1 renders TMEFF1 KO neurons normally resistant to HSV-1 infection.
a, TMEFF1 and NECTIN1 mRNA levels, as measured by RT-qPCR, in TMEFF1 KO cortical neurons transduced with an EV, WT TMEFF1 or patient-specific mutant TMEFF1-expressing lentivirus. Two probes, targeting exons 1-2 (left) and exons 9-10 (center) of TMEFF1, were used. The data shown are representative of two independent experiments. b, Immunostaining of exogenous TMEFF1 (green), endogenous NECTIN-1 (purple), AT-rich DNA (DAPI, blue) and the cell membrane (WGA, white), for hPSC-derived TMEFF1 KO cortical neurons transduced with EV, WT TMEFF1 or patient-specific mutant TMEFF1-expressing lentiviruses. The data shown are representative of three independent experiments. c, Measurement of RFP intensity, 10 h after infection with HSV-1-RFP, in TMEFF1 KO cortical neurons transduced with EV, WT TMEFF1 or patient-specific mutant TMEFF1-expressing lentiviruses. Cortical neurons were labeled with anti-TMEFF1 antibody (green) and DAPI (blue). RFP intensity was assessed under a confocal microscope. HSV-1 infection results in the expression of RFP, which is detected in the nucleus at 10 hpi. Statistical analysis was conducted with Kruskal-Wallis tests with Dunn’s test for multiple comparisons. **p-value < 0.01; ****p-value < 0.0001. The data are presented as the mean ± SEM from three independent experiments. Source Data

Similar articles

Cited by

References

    1. Zhang, S.-Y., Harschnitz, O., Studer, L. & Casanova, J.-L. Neuron-intrinsic immunity to viruses in mice and humans. Curr. Opin. Immunol.72, 309–317 (2021). 10.1016/j.coi.2021.07.004 - DOI - PMC - PubMed
    1. Casanova, J.-L. & Abel, L. Mechanisms of viral inflammation and disease in humans. Science374, 1080–1086 (2021). 10.1126/science.abj7965 - DOI - PMC - PubMed
    1. Gnann, J. W. Jr & Whitley, R. J. Herpes simplex encephalitis: an update. Curr. Infect. Dis. Rep.19, 13 (2017). 10.1007/s11908-017-0568-7 - DOI - PubMed
    1. Abel, L. et al. Age-dependent Mendelian predisposition to herpes simplex virus type 1 encephalitis in childhood. J. Pediatr.157, 623–629 (2010). 10.1016/j.jpeds.2010.04.020 - DOI - PubMed
    1. Jubelt, B., Mihai, C., Li, T. M. & Veerapaneni, P. Rhombencephalitis / brainstem encephalitis. Curr. Neurol. Neurosci. Rep.11, 543–552 (2011). 10.1007/s11910-011-0228-5 - DOI - PubMed

Publication types

MeSH terms

LinkOut - more resources