. 2024 Jul 24;23(1):208.
doi: 10.1186/s12934-024-02455-5.

Producing recombinant proteins in Vibrio natriegens

Affiliations

Producing recombinant proteins in Vibrio natriegens

Matthew Smith et al. Microb Cell Fact. .

Abstract

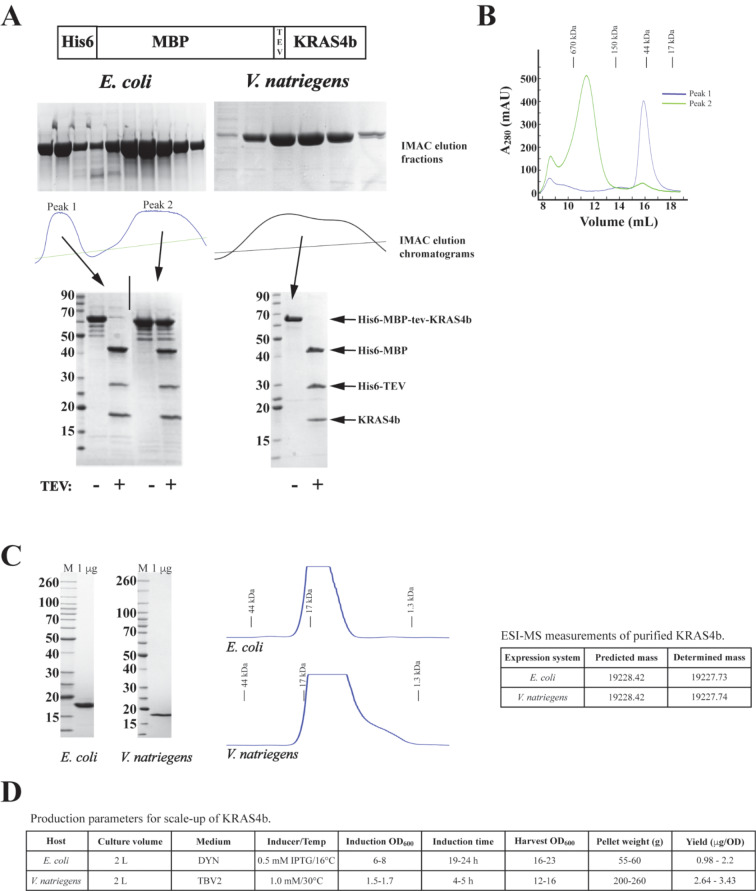
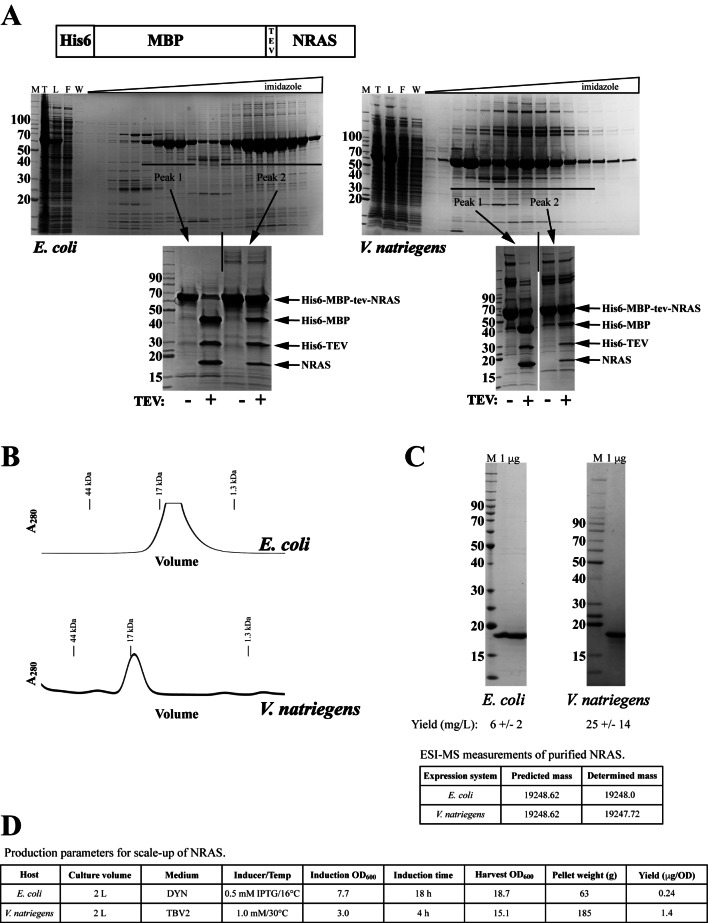
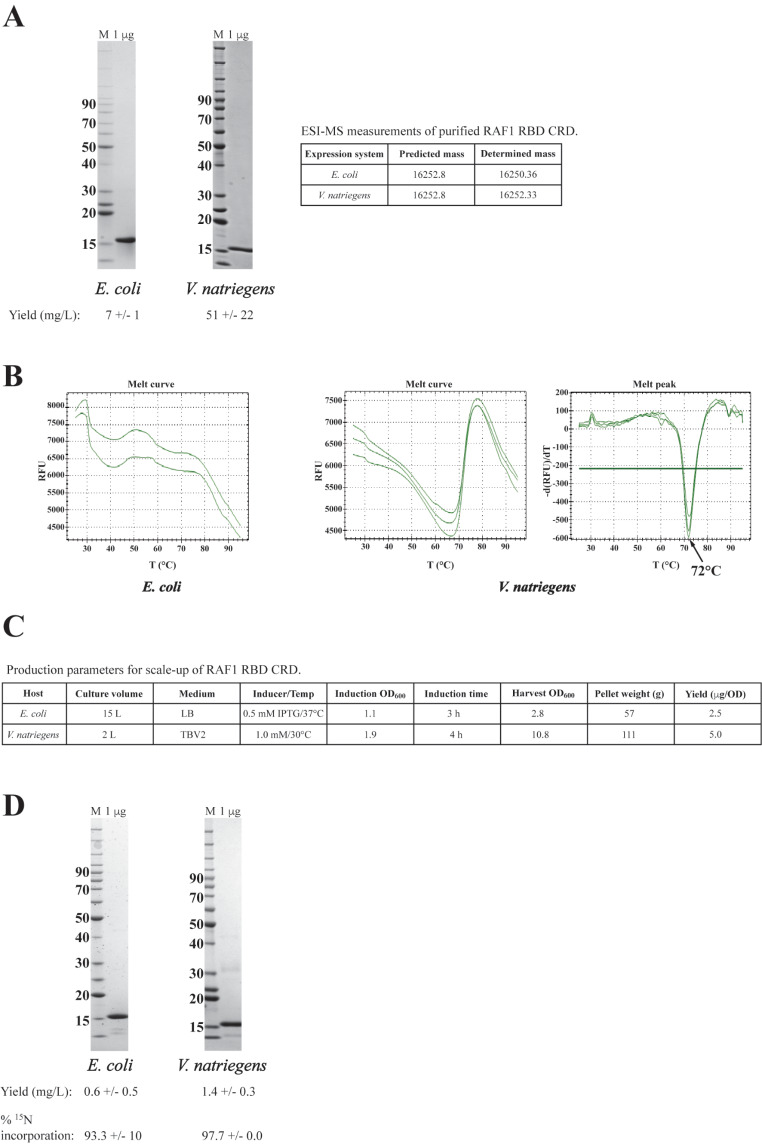
The diversity of chemical and structural attributes of proteins makes it inherently difficult to produce a wide range of proteins in a single recombinant protein production system. The nature of the target proteins themselves, along with cost, ease of use, and speed, are typically cited as major factors to consider in production. Despite a wide variety of alternative expression systems, most recombinant proteins for research and therapeutics are produced in a limited number of systems: Escherichia coli, yeast, insect cells, and the mammalian cell lines HEK293 and CHO. Recent interest in Vibrio natriegens as a new bacterial recombinant protein expression host is due in part to its short doubling time of ≤ 10 min but also stems from the promise of compatibility with techniques and genetic systems developed for E. coli. We successfully incorporated V. natriegens as an additional bacterial expression system for recombinant protein production and report improvements to published protocols as well as new protocols that expand the versatility of the system. While not all proteins benefit from production in V. natriegens, we successfully produced several proteins that were difficult or impossible to produce in E. coli. We also show that in some cases, the increased yield is due to higher levels of properly folded protein. Additionally, we were able to adapt our enhanced isotope incorporation methods for use with V. natriegens. Taken together, these observations and improvements allowed production of proteins for structural biology, biochemistry, assay development, and structure-based drug design in V. natriegens that were impossible and/or unaffordable to produce in E. coli.

Keywords: Escherichia coli; Vibrio natriegens; KRAS4b; TEV protease; auto-induction; isotopic labeling; protein aggregation; protein folding; recombinant protein expression; small GTPase.


Conflict of interest statement

The authors declare no competing interests.

Figures

Fig. 1
Fig. 1
V. natriegens antibiotic resistance and transformation. (A) Photographs of agar plates spread with V. natriegens. Empty cells (‘-‘ plasmid) were plated on plates with zero or 5 ug/mL of ampicillin. V. natriegens transformation mixes (‘+’ plasmid, Ampr) were plated on plates with 5 µg/mL or 50 µg/mL ampicillin. A single isolated colony from the 5 µg/mL ampicillin plate was streak for isolation on a 50 µg/mL ampicillin plate (far right plate). (B) Analysis of competent cells. CFUs/mL were determined by plating dilutions of samples on non-selective plates. Transformants were plated after grow-out times indicated on plates with different ampicillin concentration. Representative colony counts from a transformation are listed. Nd – not determined, TNTC – too numerous to count. (C) Schematic of V. natriegens transformation protocols. Top path [4]. Bottom path, this work
Fig. 2
Fig. 2
Growth parameters of V. natriegens and E. coli and schematic of protein production workflow (A) Dissolved oxygen profiles of V. natriegens and E. coli in standard growth media. Dissolved oxygen levels were measured of log phase cultures grown in protein production conditions. (B) Growths curves +/- oxygen supplementation of V. natriegens cultures in production media. Profiles of standard E. coli productions that typically do not receive supplemental oxygen are overlaid for comparison. (C) Protein yields for V. natriegens cultures depicted in panel B illustrating the effect of supplementing with dissolved oxygen. (D) Comparison of the workflow schematics for E. coli and V. natriegens. Arrows indicate approximate length of procedures (including incubation time) with the relevant procedure noted above the arrow. TFN – transformation, streak – T-streak for isolated colonies, seed – overnight culture from isolated colony (or glycerol stock, preferred for consistent subsequent culture growth)
Fig. 3
Fig. 3
Small-scale screening comparison of FLAG-Mm.AMHR2(18–142)-His6 in E. coli and V. natriegens and final protein. (A) Representative results of small-scale purification screens from three conditions (two from E. coli and one from V. natriegens) analyzed by SDS-PAGE/Coomassie staining. M- protein standards (kDa), T – total lysate, L – column load, F – column flow through. (B) Final FLAG-Mm.AMHR2(18–142)-His6 purified from V. natriegens after scale-up expression, IMAC in denaturing condition, and SEC refolding (manuscript in preparation). One microgram of final protein was analyzed by SDS-PAGE/Coomassie staining
Fig. 4
Fig. 4
Comparison of E. coli and V. natriegens nanobody protein screening and production. (A) SDS-PAGE/Coomassie analysis of small-scale screening purification of nanobody RBD-1-1G expressed in E. coli under three standard conditions. M- protein standards (kDa), T – total lysate, L – column load, F – column flow through. (B) SDS-PAGE/Coomassie staining analysis of small-scale screening purification of four nanobodies expressed in V. natriegens (top) and E. coli (bottom). (C) Final protein analysis by SDS-PAGE/Coomassie staining of final proteins purified from scale-up expression in V. natriegens. One microgram of each final lot was loaded. (D) Scale-up purification of nanobody RBD-1-2G; comparison between V. natriegens (top panels) and E. coli (bottom panels). IMAC Load (L) is the soluble portion of the lysate, SEC load is the concentrated pool from IMAC step. W – column wash. (E) SDS-PAGE/Coomassie-stained gel of final nanobody RBD-1-2G preparations. One microgram of each preparation (three from V. natriegens, two from E. coli) was loaded. (F) Representative production parameters for RBD-1-2G productions
Fig. 5
Fig. 5
Comparison of the scale-up production of GG-Hs.KRAS4b(2-169) from E. coli and V. natriegens. (A) Top – schematic of expressed protein and SDS-PAGE/Coomassie analysis of IMAC elution fractions aligned with the A280 trace from the chromatograms. Bottom - TEV protease treatment of the resolved peaks (denoted by arrows) from the IMAC is analyzed by SDS-PAGE/Coomassie staining. (B) Overlaid analytical size exclusion chromatography (ANSEC) A280 traces from separate runs of Peak 1 and Peak 2 IMAC elution pools from E. coli purification in panel A. Elution of SEC standards are noted. (C) Representative QC of final RAS proteins from the two expression systems, left to right: SDS-PAGE/Coomassie-stained gel analysis, A280 trace of ANSEC, intact mass data from ESI-MS. (D) Representative production parameters for KRAS4b productions
Fig. 6
Fig. 6
Comparison of the scale-up production of Hs.NRAS(1-169) from E. coli and V. natriegens. (A) Top – schematic of expressed protein. Bottom - SDS-PAGE/Coomassie analysis of IMAC elution fractions from representative purifications. SDS-PAGE/Coomassie analysis of TEV protease digestions of pooled fractions from designated peaks are shown below the IMAC analysis. (B) Representative A280 traces from preparative SEC of NRAS proteins. Elution of SEC standards are noted. (C) QC of final proteins from the two expression systems: SDS-PAGE/Coomassie-stained gel analysis and intact mass data from ESI-MS. (D) Representative production parameters for NRAS productions
Fig. 7
Fig. 7
Comparison of scale-up productions of RAF1(52–192) from E. coli and V. natriegens. (A) SDS-PAGE/Coomassie-stained gel analysis, yield, and intact mass data from ESI-MS for representative final proteins from the two systems. (B) Representative Tm analysis data from the final proteins from each system. (C) Representative production parameters for RAF1(52–192) productions. (D) SDS-PAGE/Coomassie stain analysis of representative final samples of 15N labeled RAF1(52–192), yield and 15N incorporation data (n = 3 for each system)

References

    1. Rosano GL, Morales ES, Ceccarelli EA. New tools for recombinant protein production in Escherichia coli: a 5-year update. Protein Sci. 2019;28(8):1412–22. 10.1002/pro.3668 - DOI - PMC - PubMed
    1. Shilling PJ, Daley DO. Implementing novel designs in pET expression plasmids that increase protein production. Bio Protoc. 2021;11(16):e4133. 10.21769/BioProtoc.4133 - DOI - PMC - PubMed
    1. Schutz A, et al. A concise guide to choosing suitable gene expression systems for recombinant protein production. STAR Protoc. 2023;4(4):102572. 10.1016/j.xpro.2023.102572 - DOI - PMC - PubMed
    1. Weinstock MT, et al. Vibrio natriegens as a fast-growing host for molecular biology. Nat Methods. 2016;13(10):849–51. 10.1038/nmeth.3970 - DOI - PubMed
    1. Thoma F, Blombach B. Metabolic engineering of Vibrio natriegens. Essays Biochem. 2021;65(2):381–92. 10.1042/EBC20200135 - DOI - PMC - PubMed

Substances

Supplementary concepts

LinkOut - more resources