. 2024 Jul 17:17:3147-3169.
doi: 10.2147/IJGM.S462895. eCollection 2024.

Comprehensive Analysis of Immune Cell Infiltration and M2-Like Macrophage Biomarker Expression Patterns in Atrial Fibrillation

Affiliations

Comprehensive Analysis of Immune Cell Infiltration and M2-Like Macrophage Biomarker Expression Patterns in Atrial Fibrillation

Man Yang et al. Int J Gen Med. .

Abstract

Background: Macrophages play a crucial role in the progression of AF, closely linked to atrial inflammation and myocardial fibrosis. However, the functions and molecular mechanisms of different phenotypic macrophages in AF are not well understood. This study aims to analyze the infiltration characteristics of atrial immune cells in AF patients and further explore the role and molecular expression patterns of M2 macrophage-related genes in AF.

Methods: This study integrates single-cell and large-scale sequencing data to analyze immune cell infiltration and molecular characterization of the LAA in patients with AF, using SR as a control group. CIBERSORT assesses immune cell types in LAA tissues; WGCNA identifies signature genes; cell clustering analyzes cell types and subpopulations; cell communication explores macrophage interactions; hdWGCNA identifies M2 macrophage gene modules in AF. AF biomarkers are identified using LASSO and Random Forest, validated with ROC curves and RT-qPCR. Potential molecular mechanisms are inferred through TF-miRNA-mRNA networks and single-gene enrichment analyses.

Results: Myeloid cell subsets varied considerably between the AF and SR groups, with a significant increase in M2 macrophages in the AF group. Signals of inflammation and matrix remodeling were observed in AF. M2 macrophage-related genes IGF1, PDK4, RAB13, and TMEM176B were identified as AF biomarkers, with RAB13 and TMEM176B being novel markers. A TF-miRNA-mRNA network was constructed using target genes, which are enriched in the PPAR signaling pathway and fatty acid metabolism.

Conclusion: Over infiltration of M2 macrophages may be an important factor in the progression of AF. The M2 macrophage-related genes IGF1, RAB13, TMEM176B and PDK4 may regulate the progression of AF through the PPAR signaling pathway and fatty acid metabolism.

Keywords: M2 macrophage; atrial fibrillation; bulk RNA-sequencing; cardiac fibrosis; inflammation; single-cell RNA-sequencing.


Conflict of interest statement

The authors have no conflicts of interest to declare in this work.

Figures

Figure 1
Figure 1
Flowchart of the study.
Figure 2
Figure 2
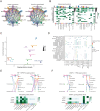
Identification of DEGs between AF and SR samples and enrichment analysis of DEGs using the GO and KEGG databases. (A) Principal component analysis clustering of gene expression in AF and SR tissues. (B) Volcano plots for the genetic differential analysis. The red points represent upregulated DEGs, and the blue points denote downregulated DEGs. (C) The circled graph on the left shows the relationship between key DEGs and the most enriched biological processes, while the graph on the right illustrates the top 6 enriched BPs, CCs, and MFs. (D) Functional enrichment analysis of the KEGG database. The words on the left indicate enriched KEGG, the size of the balls indicates the number of genes enriched, and the color indicates the level of enrichment.
Figure 3
Figure 3
Visualization and assessment of immune cell infiltration. (A) The relative percentages of the 22 immune cell types in 75 left atrial appendage samples. Each color represents one cell type. (B) Heatmap showing the correlation of the 22 immune cell types. Red signifies a positive correlation, whereas blue indicates a negative correlation. (C) The fraction of infiltrating immune cells in the AF and SR groups. The SR group is denoted by the color blue, while the AF group is denoted by the color red. A significance level of P<0.05 was used to indicate statistical significance.
Figure 4
Figure 4
WGCNA screening of M2 macrophage-associated gene modules. (A) Evaluation of the scale-free fit index and mean connectivity across different soft-thresholding powers. (B) Associations between consensus modules and samples, each comprising a group of closely connected genes. Each branch represents an individual gene, with each color indicating a co-expression module. (C) Trait heatmap displaying the distribution of the seven immune cell types in each sample. (D) Heatmaps showing the correlations between 4 modules and 7 types of immune cells. (E) Scatter plots describing the relationship between gene significance and gene module membership in the black module. Each dot represents a gene in the black module.
Figure 5
Figure 5
Heterogeneity of immune cells in the AF and SR groups. (A) UMAP plot showing the cell distribution of the AF and SR groups. (B) UMAP plot showing the results of the cell annotation between the AF and SR groups. (C) Bubble dot graphs showing the expression of the top three different marker genes for each cell type. The colors of the dots represent the average expression, and the sizes of the dots represent the average percentage of cells that expressed the DEGs. (D) Stacked plot of cell proportions between different groups and each sample.
Figure 6
Figure 6
Cell annotation for myeloid cell subsets between groups in the AF and SR cohorts. (A) UMAP plot showing the distribution of myeloid cell subsets in the AF and SR groups. (B) Bar graphs showing the proportions of cell clusters in the different groups. (C) Heatmap showing the DEGs in the myeloid cell subsets. Yellow for high expression, purple for low expression. (D) Distribution of myeloid cell subsets in each group was determined using a UMAP plot and a stacked plot of myeloid cell subset proportions between the different groups.
Figure 7
Figure 7
Cell‒cell communications in AF. (A) Integrated cell‒cell communication network plotted by interaction and weight. The circle sizes are proportional to the number of cells in each cell group, and the edge width represents the communication probability. (B) Heatmaps showing the relative strength of the signaling pathways among the 11 cell populations in the outgoing and incoming signaling patterns. A gradual change in color from green to white indicates a change in the relative interaction strength from high to low. (C) Dot plot of outgoing/incoming interaction strength for 11 cell clusters. Dot size is positively correlated with strength. (D) Bubble plot of macrophage subsets outgoing interaction signaling pathways. The dot color reflects the communication probabilities, and the dot size represents the computed p value. (E and F) The relative contribution of TNF-α and ANGPTL signaling to each cell group. The term “sender” refers to a source of signaling, “receiver” refers to the target of signaling, “mediator” refers to the gatekeeper of a cell, and “influencer” refers to the ability to influence the flow of information within a signaling network.
Figure 8
Figure 8
hdWGCNA identifies the modular signature genes of macrophage subsets in AF. (A) Soft power = 5 was selected to construct the scale-free network. (B) Hypervariable genes were clustered by hdWGCNA into 9 modules. Each leaf in the dendrogram represents an individual gene, while the color assigned at the bottom indicates its membership in a specific co‐expression module. The “gray” module consists of genes that were not grouped into any co‐expression module. (C) t-SNE plot showing the expression distribution of hub genes for each module across the 9 clusters. Darker colors represent higher module gene expression. (D) Dot plot presenting the average expression of module-specific hub genes in different macrophage subsets. The size of the dots represents the percentage of cell subtypes and the color of the dots represents the average expression of the module genes.
Figure 9
Figure 9
Machine learning algorithms to identify Hub genes and ROC curve validation. (A) The feature gene selection from different dimensions. Set1 includes the genes highly associated with M2 macrophages in WGCNA; Set2 consists of the DEGs from the bulk RNA-seq dataset; Set3 comprises the differentially expressed genes of M2 macrophages in the scRNA-seq; Set4 contains the genes highly correlated with the subpopulation of M2 macrophages in the hdWGCNA. (B and C) Adjustment for feature selection by LASSO logistic regression analysis. (D) Genes are displayed in descending order of importance by random forests. (E) The diagnostic efficacy of the 2 algorithms for the 4 crossover genes is represented by ROC curves. (F) Model stability was assessed using fivefold cross-validation.
Figure 10
Figure 10
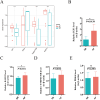
Validation of the key genes in AF patients through qPCR (A) Expression levels of the Hub genes in the merged Bulk-seq dataset. (BE) The relative expression levels of key genes in whole blood between the SR and AF groups. (B) IGF1; (C) RAB13; (D) TMEM176B; (E) PDK4. *P < 0.05, ***P < 0.001.
Figure 11
Figure 11
The TF-miRNA‒mRNA regulatory network. The red balls depict mRNAs, the blue balls represent miRNAs, and the brown balls represent TFs.
Figure 12
Figure 12
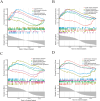
Identification of signaling pathways affected by target genes via GSEA. The major signaling pathways were enriched based on the expression of target genes in the merged Bulk RNA-seq dataset. (A) IGF1; (B) RAB13; (C) TMEM176B; (D) PDK4.

References

    1. Heijman J, Guichard JB, Dobrev D, Nattel S. Translational Challenges in Atrial Fibrillation. Circ Res. 2018;122(5):752–773. doi:10.1161/circresaha.117.311081 - DOI - PubMed
    1. Lippi G, Sanchis-Gomar F, Cervellin G. Global epidemiology of atrial fibrillation: an increasing epidemic and public health challenge. Int J Stroke. 2021;16(2):217–221. doi:10.1177/1747493019897870 - DOI - PubMed
    1. Nattel S, Sager PT, Hüser J, Heijman J, Dobrev D. Why translation from basic discoveries to clinical applications is so difficult for atrial fibrillation and possible approaches to improving it. Cardiovasc Res. 2021;117(7):1616–1631. doi:10.1093/cvr/cvab093 - DOI - PMC - PubMed
    1. Dzeshka MS, Lip GY, Snezhitskiy V, Shantsila E. Cardiac fibrosis in patients with atrial fibrillation: mechanisms and clinical implications. J Am Coll Cardiol. 2015;66(8):943–959. doi:10.1016/j.jacc.2015.06.1313 - DOI - PubMed
    1. Nattel S, Harada M. Atrial remodeling and atrial fibrillation: recent advances and translational perspectives. J Am Coll Cardiol. 2014;63(22):2335–2345. doi:10.1016/j.jacc.2014.02.555 - DOI - PubMed