. 2024 Jul 24:6:0215.
doi: 10.34133/plantphenomics.0215. eCollection 2024.

Phenomic Selection for Hybrid Rapeseed Breeding

Affiliations

Phenomic Selection for Hybrid Rapeseed Breeding

Lennard Roscher-Ehrig et al. Plant Phenomics. .

Abstract

Phenomic selection is a recent approach suggested as a low-cost, high-throughput alternative to genomic selection. Instead of using genetic markers, it employs spectral data to predict complex traits using equivalent statistical models. Phenomic selection has been shown to outperform genomic selection when using spectral data that was obtained within the same generation as the traits that were predicted. However, for hybrid breeding, the key question is whether spectral data from parental genotypes can be used to effectively predict traits in the hybrid generation. Here, we aimed to evaluate the potential of phenomic selection for hybrid rapeseed breeding. We performed predictions for various traits in a structured population of 410 test hybrids, grown in multiple environments, using near-infrared spectroscopy data obtained from harvested seeds of both the hybrids and their parental lines with different linear and nonlinear models. We found that phenomic selection within the hybrid generation outperformed genomic selection for seed yield and plant height, even when spectral data was collected at single locations, while being less affected by population structure. Furthermore, we demonstrate that phenomic prediction across generations is feasible, and selecting hybrids based on spectral data obtained from parental genotypes is competitive with genomic selection. We conclude that phenomic selection is a promising approach for rapeseed breeding that can be easily implemented without any additional costs or efforts as near-infrared spectroscopy is routinely assessed in rapeseed breeding.


Conflict of interest statement

Competing interests: A.A. and M.M. were employed by the company NPZ Innovation GmbH. S.A. and R.H. were employed by the company Limagrain GmbH. The remaining authors declare that they have no conflict of interest regarding the publication of this article.

Figures

Fig. 1.
Fig. 1.
Overview of the experimental design. The rapeseed population used in this study was based on crossings of 5 different founder lines (P1 to P5) with a common elite line (L1). The resulting 251 pollinators were crossed with 2 different male-sterile inbred lines (M1 and M2), resulting in 410 test hybrids (A). Across-generation prediction was performed by using NIRS data obtained from the pollinators, grown at 1 location, to predict phenotypic traits of the hybrids, grown at 5 locations (B). Within-generation predictions were performed by using NIRS data and phenotypic traits both obtained from the hybrids (C to E). Here, phenotypic traits were obtained from all 5 locations, while NIRS data was obtained either from all 5 locations (C and E) or from single locations (D). Cross-validation was performed by randomly dividing the hybrid population into 80% for the training set and 20% for the test set with 200 repetitions (B to D) or by using hybrids, which descend from 4 of the 5 original crosses as the training set and the remaining subfamily as test set (E).
Fig. 2.
Fig. 2.
Comparison of prediction accuracy of GP based on SNP markers, PP based on NIRS data, and a combined approach based on both kinds of data with 5 different models (GBLUP/NIRS-BLUP, BL, RKHS, RF, and SVM) for seed yield (A), plant height (B), and flowering time (C) obtained by 200 cross-validation splits. Values above/underneath the boxplots represent median accuracies across all cross-validation runs. NIRS data was obtained within the hybrid generation from harvested seeds.
Fig. 3.
Fig. 3.
Comparison of selection accuracy for selecting the top 80 genotypes (A to C) or top 40 genotypes (D to F) with GS (A and D), PS (B and E), and combined selection (C and F) for seed yield based on the measured values (adjusted means) and predicted values (means of 200 cross-validations) with GBLUP/NIRS-BLUP. Genotypes that were in or out of the selected fraction based on both predicted and actual performance were classified as “correctly selected” (CS) or “correctly discarded” (CD), respectively. Genotypes that were in the selected fraction based on the prediction when in reality they performed worse, and vice versa, were classified as “wrongly selected” (WS) or “wrongly discarded” (WD), respectively. The respective percentage numbers indicate the corresponding faction sizes. Czekanowski coefficient of similarity (CZ) indicates the selection accuracy based on the predicted values. Pearson correlation coefficient (r) indicates the respective prediction accuracy. NIRS data was obtained within the hybrid generation from harvested seeds.
Fig. 4.
Fig. 4.
Comparison of prediction accuracy of PP based on NIRS data aggregated across all locations and obtained from single locations (HOH, LAU, MOO, RHH, or ROS) with 5 different models (GBLUP/NIRS-BLUP, BL, RKHS, RF, and SVM) for seed yield (A), plant height (B), and flowering time (C) obtained by 200 cross-validation splits. Values above the boxplots represent median accuracies across all cross-validation runs. NIRS data was obtained within the hybrid generation from harvested seeds.
Fig. 5.
Fig. 5.
Population structure displayed by the first 2 principal components (A and C) as well as by the second and third principal components (B and D) based on SNP marker (A and B) and NIRS data (C and D). The colors indicate the affiliation to the 5 different subfamilies based on descent from the 5 founder lines. Both SNP and NIRS data were obtained from the pollinators.
Fig. 6.
Fig. 6.
Comparison of prediction accuracy of GP based on SNP markers, PP based on NIRS data, and a combined approach based on both kinds of data for predicting the performance of one subfamily (P1 to P5) when trained on the remaining 4 subfamilies with 5 different models (GBLUP/NIRS-BLUP, BL, RKHS, RF, and SVM) for seed yield (A), plant height (B), and flowering time (C). NIRS data was obtained within the hybrid generation from harvested seeds.
Fig. 7.
Fig. 7.
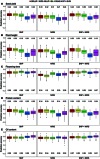
Comparison of prediction accuracy of GP based on SNP markers, PP based on NIRS data, and a combined approach based on both kinds of data with 5 different models (GBLUP/NIRS-BLUP, BL, RKHS, RF, and SVM) for seed yield (A), plant height (B), flowering time (C), protein content (D), and oil content (E) obtained by 200 cross-validation splits. Values above/underneath the boxplots represent median accuracies across all cross-validation runs. NIRS data was obtained from harvested seeds of the pollinators.
Fig. 8.
Fig. 8.
Comparison of selection accuracy of selecting the top 80 genotypes (A to C) or top 40 genotypes (D to F) with GS (A and D), PS (B and E), and combined selection (C and F) for seed yield based on the measured values (adjusted means) and predicted values (means of 200 cross-validations) with GBLUP/NIRS-BLUP. Genotypes that were in or out of the selected fraction based on both predicted and actual performance were classified as “correctly selected” (CS) or “correctly discarded” (CD), respectively. Genotypes that were in the selected fraction based on the prediction when in reality they performed worse, and vice versa, were classified as “wrongly selected” (WS) or “wrongly discarded” (WD), respectively. The respective percentage numbers indicate the corresponding faction sizes. Czekanowski coefficient of similarity (CZ) indicates the selection accuracy based on the predicted values. Pearson correlation coefficient (r) indicates the respective prediction accuracy. NIRS data was obtained from harvested seeds of the pollinators.

References

    1. Bernardo R. Prediction of maize single-cross performance using RFLPs and information from related hybrids. Crop Sci. 1994;34(1):20–25.
    1. Meuwissen THE, Hayes BJ, Goddard ME. Prediction of total genetic value using genome-wide dense marker maps. Genetics. 2001;157(4):1819–1829. - PMC - PubMed
    1. Heffner EL, Sorrells ME, Jannink J-L. Genomic selection for crop improvement. Crop Sci. 2009;49(1):1–12.
    1. Lynch M. Estimation of relatedness by DNA fingerprinting. Mol Biol Evol. 1988;5(5):584–599. - PubMed
    1. VanRaden PM. Efficient methods to compute genomic predictions. J Dairy Sci. 2008;91(11):4414–4423. - PubMed

LinkOut - more resources