

Possible roles of phytochemicals with bioactive properties in the prevention of and recovery from COVID-19
- PMID: 39050135
- PMCID: PMC11266003
- DOI: 10.3389/fnut.2024.1408248
Possible roles of phytochemicals with bioactive properties in the prevention of and recovery from COVID-19
Abstract
Introduction: There have been large geographical differences in the infection and death rates of COVID-19. Foods and beverages containing high amounts of phytochemicals with bioactive properties were suggested to prevent contracting and to facilitate recovery from COVID-19. The goal of our study was to determine the correlation of the type of foods/beverages people consumed and the risk reduction of contracting COVID-19 and the recovery from COVID-19.
Methods: We developed an online survey that asked the participants whether they contracted COVID-19, their symptoms, time to recover, and their frequency of eating various types of foods/beverages. The survey was developed in 10 different languages.
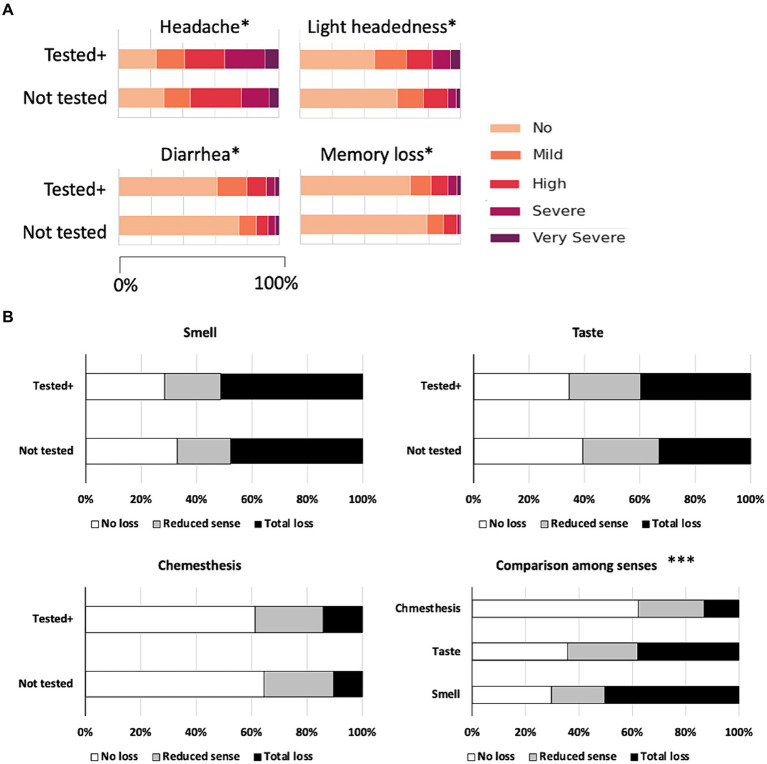
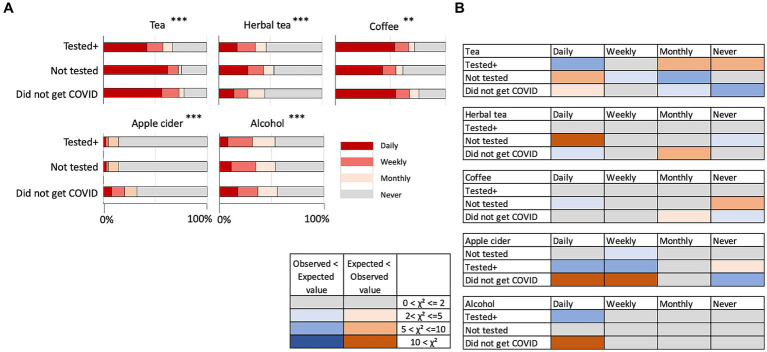
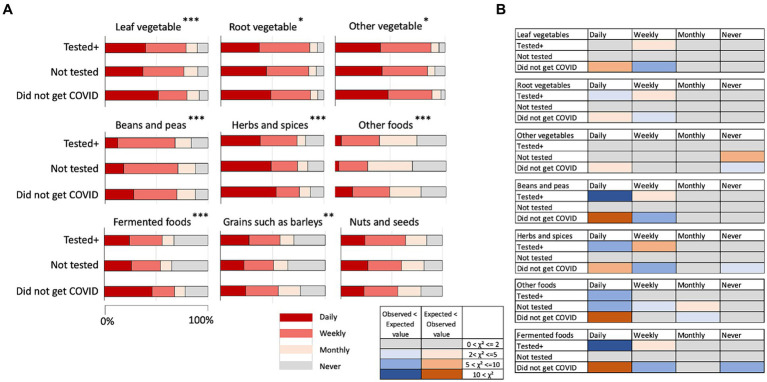
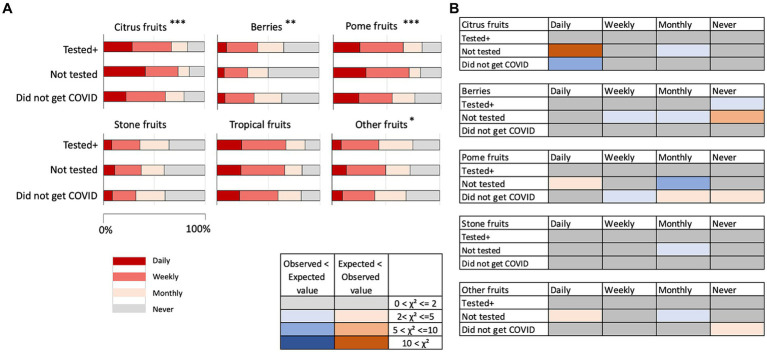
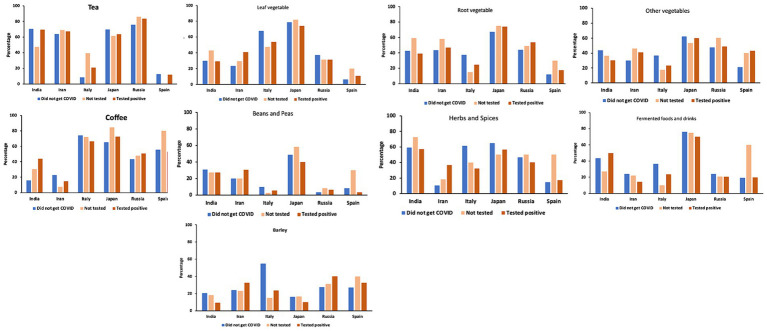
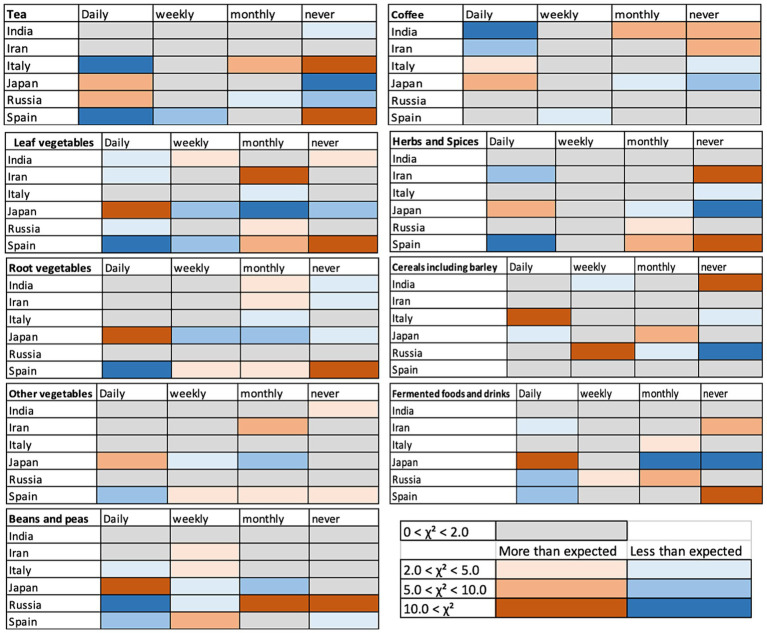
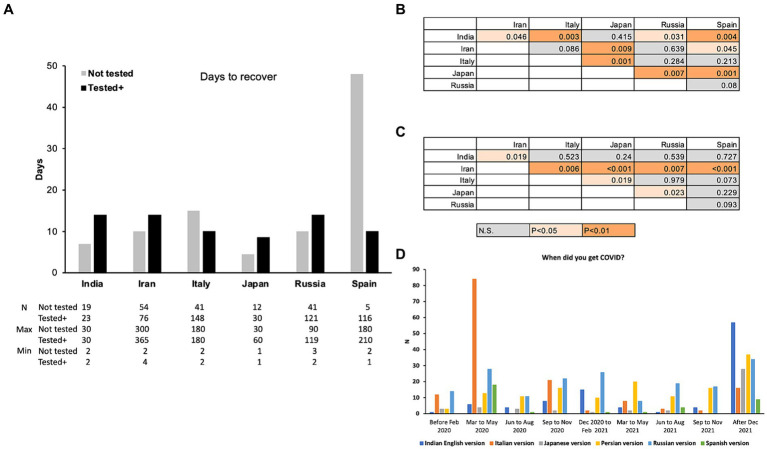
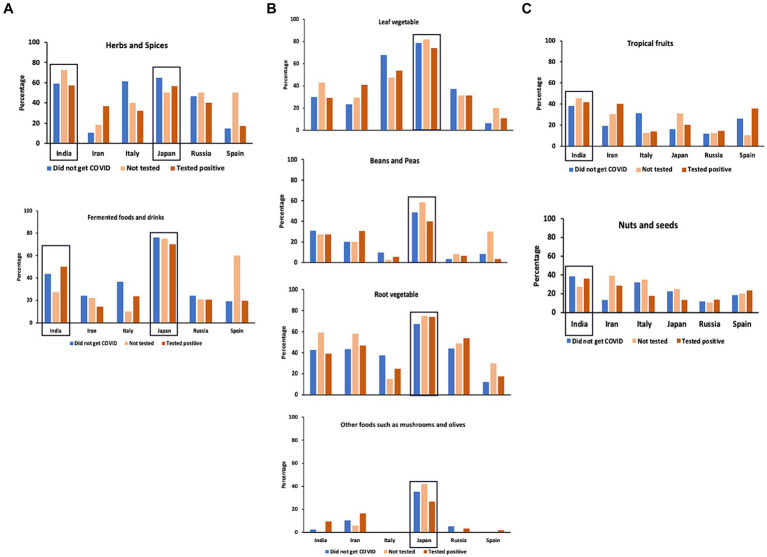
Results: The participants who did not contract COVID-19 consumed vegetables, herbs/spices, and fermented foods/beverages significantly more than the participants who contracted COVID-19. Among the six countries (India/Iran/Italy/Japan/Russia/Spain) with over 100 participants and high correspondence between the location of the participants and the language of the survey, in India and Japan the people who contracted COVID-19 showed significantly shorter recovery time, and greater daily intake of vegetables, herbs/spices, and fermented foods/beverages was associated with faster recovery.
Conclusions: Our results suggest that phytochemical compounds included in the vegetables may have contributed in not only preventing contraction of COVID-19, but also accelerating their recovery.
Keywords: COVID-19; beverages; consumption habits; foods; phytochemicals; prevention; recovery.
Copyright © 2024 Koyama, Joseph, Shields, Heinbockel, Adhikari, Kaur, Kumar, Alizadeh, Bhutani, Calcinoni, Mucignat-Caretta, Chen, Cooper, Das, Rohlfs Domínguez, Guàrdia, Klyuchnikova, Laktionova, Mori, Namjoo, Nguyen, Özdener, Parsa, Özdener Poyraz, Strub, Taghizadeh-Hesary, Ueha and Voznessenskaya.
Figures
Similar articles
-
"Ethno-microbiology" of ethnic Indian fermented foods and alcoholic beverages.J Appl Microbiol. 2022 Jul;133(1):145-161. doi: 10.1111/jam.15382. Epub 2021 Nov 30. J Appl Microbiol. 2022. PMID: 34821430 Review.
-
Health benefits of herbs and spices: the past, the present, the future.Med J Aust. 2006 Aug 21;185(S4):S1-S24. doi: 10.5694/j.1326-5377.2006.tb00548.x. Med J Aust. 2006. PMID: 17022438 Review.
-
The total antioxidant content of more than 3100 foods, beverages, spices, herbs and supplements used worldwide.Nutr J. 2010 Jan 22;9:3. doi: 10.1186/1475-2891-9-3. Nutr J. 2010. PMID: 20096093 Free PMC article.
-
A cross-cultural perspective on feeling good in the context of foods and beverages.Food Res Int. 2019 Jan;115:292-301. doi: 10.1016/j.foodres.2018.12.012. Epub 2018 Dec 12. Food Res Int. 2019. PMID: 30599944 Review.
-
Characteristics Associated with Being a High Consumer of Sweet Foods and Sugar-Sweetened Beverages among US Adults during the COVID-19 Pandemic, 2021.Nutrients. 2023 May 18;15(10):2363. doi: 10.3390/nu15102363. Nutrients. 2023. PMID: 37242246 Free PMC article.
References
-
- WHO (2023) End of pandemic declaration by the head of the UN World Health Organization (WHO). Available at: https://www.who.int/news-room/speeches/item/who-director-general-s-openi....
-
- CDC (2024) COVID Data Tracker . Available at: https://covid.cdc.gov/covid-data-tracker/#maps_positivity-week.
-
- WHO (2024) WHO COVID-19 dashboard. Available at: https://data.who.int/dashboards/covid19/cases?n=c.
LinkOut - more resources
Full Text Sources