. 2024 Jul 24;14(7):e70027.
doi: 10.1002/ece3.70027. eCollection 2024 Jul.

Population genomics and distribution modeling revealed the history and suggested a possible future of the endemic Agave aurea (Asparagaceae) complex in the Baja California Peninsula

Affiliations

Population genomics and distribution modeling revealed the history and suggested a possible future of the endemic Agave aurea (Asparagaceae) complex in the Baja California Peninsula

Anastasia Klimova et al. Ecol Evol. .

Abstract

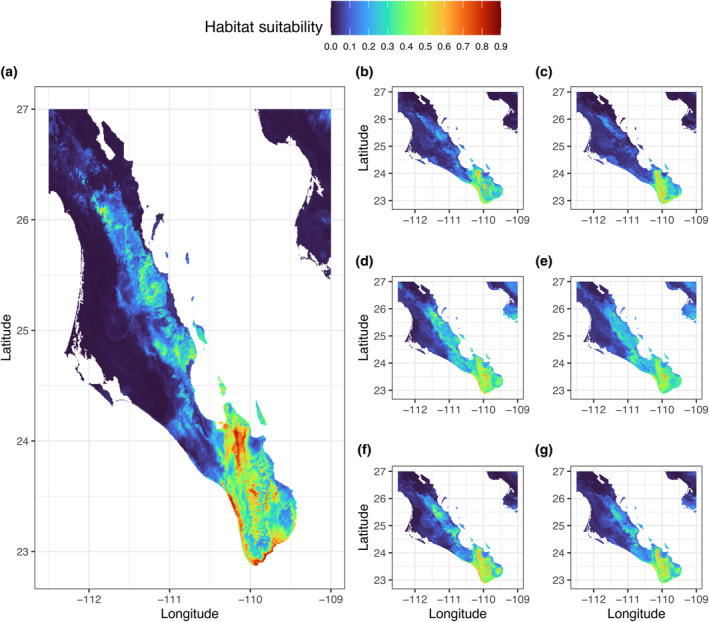
Agaves are an outstanding arid-adapted group of species that provide a unique chance to study the influence of multiple potential factors (i.e., geological and ecological) on plant population structure and diversification in the heterogeneous environment of the Baja California Peninsula. However, relatively little is known about the phylogeography of the endemic agave species of this region. Herein, we used over 10,000 single-nucleotide polymorphisms (SNPs) and spatial data from the Agave aurea species complex (i.e., A. aurea ssp. aurea, A. aurea ssp. promontorii, and A. aurea var. capensis) to resolve genetic relationships within this complex and uncover fine-scale population structure, diversity patterns, and their potential underlying drivers. Analyses resolved low genetic structure within this complex, suggesting that A. aurea is more likely to represent several closely related populations than separate species or varieties/subspecies. We found that geographical and historical ecological characteristics-including precipitation, latitude, and past climatic fluctuations-have played an important role in the spatial distribution of diversity and structure in A. aurea. Finally, species distribution modeling results suggested that climate change will become critical in the extinction risk of A. aurea, with the northernmost population being particularly vulnerable. The low population genetic structure found in A. aurea is consistent with agave's life history, and it is probably related to continuity of distribution, relatively low habitat fragmentation, and dispersion by pollinators. Together, these findings have important implications for management and conservation programs in agave, such as creating and evaluating protected areas and translocating and augmentation of particular populations.

Keywords: Agavoideae; Baja California Peninsula; Sonoran Desert; climate change; genomic diversity; pollinators.


Conflict of interest statement

None declared.

Figures

FIGURE 1
FIGURE 1
Map of the southern Baja California Peninsula, Mexico, with a background representing the topography of the area and black dots representing 29 sample site locations of Agave aurea sensu Webb and Starr (2015). Sampling site abbreviations can be found in Table S1; the subspecies of A. aurea var. capensis and A. aurea ssp. promontorii are coded and colored as SLL_18_C (dark green) and SLL_19_P (dark red), respectively. Inset at the left corner is a picture of A. aurea spp. aurea collected in Sierra La Giganta. Inset at the right corner is a map of North America, with the Baja California Peninsula highlighted in dark blue.
FIGURE 2
FIGURE 2
Population genetic structure of Agave aurea sensu Webb and Starr (2015) from Baja California Peninsula, Mexico, based on 10,765 genome‐wide SNPs. (a) Principal component analysis (PCA) of the individuals of A. aurea. (b) Neighbor‐joining (NJ) network of 98 individuals of A. aurea. PCA and NJ tree tips are colored according to the three subspecies of A. aurea sensu Webb and Starr (2015), green – A. aurea ssp. aurea, brown – A. aurea ssp. promontorii, and blue – A. aurea var. capensis. Shapes on PCA and NJ tree tips correspond to the mountain ranges from where samples were collected, such as the circle Sierra La Laguna and the triangle Sierra La Giganta.
FIGURE 3
FIGURE 3
Population genetic structure of A. aurea from Baja California Peninsula, Mexico, based on 10,765 genome‐wide SNPs, represented by a Neighbor‐joining (NJ) network of 29 sampling sites. NJ tree tips are colored according to the mountain range: Blue – Sierra La Laguna and brown – Sierra La Giganta. Sampling site abbreviations can be found in Table S1.
FIGURE 4
FIGURE 4
Population genetic structure of the 98 A. aurea samples collected in the Baja California Peninsula, Mexico, based on 10,765 SNPs. Bar plots of the individual assignment probabilities (vertical axis) for the number of genetic clusters from K = 2 (a) to K = 3 (b) inferred using the program ADMIXTURE. Samples were clustered according to sampling sites and arranged from the southernmost sampling site (left) to the northernmost sites (right). Above each Bar plot, the ADMIXTURE Q‐values represented as pie charts for each sampling site, for the clustering of K = 2 (c) and K = 3 (d), plotted on a study area map. Population codes as given in Table S1.
FIGURE 5
FIGURE 5
FineRADstructure analysis of haplotype similarity among A. aurea specimens. A co‐ancestry matrix was reconstructed using 10,765 SNPs. Colors indicate the scale of relatedness between individuals, with yellow representing low relatedness and blue/black indicating high relatedness. Colored boxes over the phylogram correspond to the two main geographic regions (Sierra La Laguna in blue and Sierra La Giganta in brown). Samples are coded as given in Table S1.
FIGURE 6
FIGURE 6
Spatial distribution of individual‐based diversity of A. aurea samples. (a) Multilocus heterozygosity and (c) Fhat3 inbreeding index. (b) Relationship (quadratic regression) between MLH and latitude (R 2 = .46, p < .0001) and (d) between Fhat3 and latitude (R 2 = .3, p < .003).
FIGURE 7
FIGURE 7
Current (a) and future (b–g) species distribution models (SDMs) and the respective spatial shifts for Agave aurea under different climate change scenarios and shared socioeconomic pathways (SSP 245 and SSP 585). (b, c) SDM for A. aurea under future climate scenario based on the ACCESS‐ESM1‐5 model under SSP 245 (b) and SSP 585 (c) in the years 2060–2080. (d, e) SDM for A. aurea under future climate scenario based on the MIROC6 model under SSP 245 (d) and SSP 585 (e) in the years 2060–2080. (f, g) SDM for A. aurea under future climate scenario based on the MPI‐ESM1‐2‐LR model under SSP 245 (f) and SSP 585 (g) in the years 2060–2080. Colors correspond to the high probability of species presence (orange and red) to the low probability (dark blue and blue).
FIGURE 8
FIGURE 8
The percentage of distribution range change in Agave aurea sensu Webb and Starr (2015) under future climate change in 2060–2080 and different climate scenarios.

References

    1. Alducin‐Martínez, C. , Mondragón, K. Y. R. , Jiménez‐Barrón, O. , Aguirre‐Planter, E. , Gasca‐Pineda, J. , Eguiarte, L. E. , & Medellín, R. A. (2022). Uses, knowledge and extinction risk faced by agave species in Mexico. Plants, 12(1), 124. 10.3390/plants12010124 - DOI - PMC - PubMed
    1. Alexander, D. H. , & Lange, K. (2011). Enhancements to the ADMIXTURE algorithm for individual ancestry estimation. BMC Bioinformatics, 12(1), 246. 10.1186/1471-2105-12-246 - DOI - PMC - PubMed
    1. Alexander, D. H. , Novembre, J. , & Lange, K. (2009). Fast model‐based estimation of ancestry in unrelated individuals. Genome Research, 19(9), 1655–1664. 10.1101/gr.094052.109 - DOI - PMC - PubMed
    1. Andrews, S. (2010). FastQC: A Quality Control Tool for High Throughput Sequence Data [Online]. http://www.bioinformatics.babraham.ac.uk/projects/fastqc/
    1. Andrews, K. R. , Good, J. M. , Miller, M. R. , Luikart, G. , & Hohenlohe, P. A. (2016). Harnessing the power of RADseq for ecological and evolutionary genomics. Nature Reviews. Genetics, 17(2), 81–92. 10.1038/nrg.2015.28 - DOI - PMC - PubMed

LinkOut - more resources