. 2024 Jun 19;27(7):110305.
doi: 10.1016/j.isci.2024.110305. eCollection 2024 Jul 19.

Limb connective tissue is organized in a continuum of promiscuous fibroblast identities during development

Affiliations

Limb connective tissue is organized in a continuum of promiscuous fibroblast identities during development

Estelle Hirsinger et al. iScience. .

Abstract

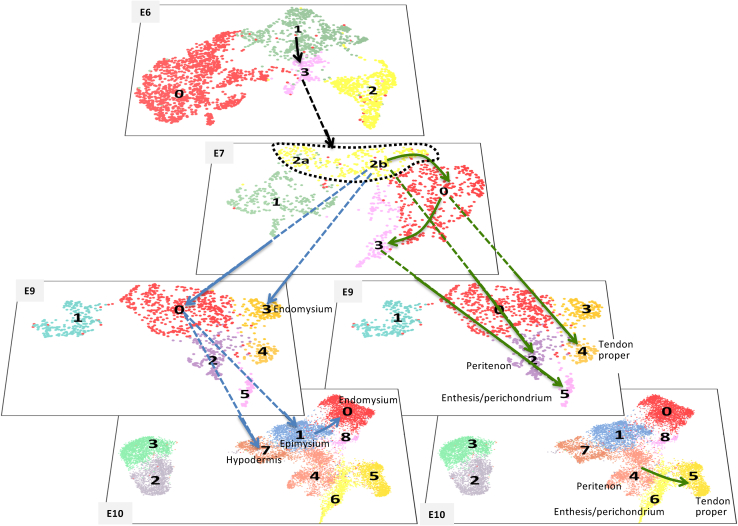
Connective tissue (CT), which includes tendon and muscle CT, plays critical roles in development, in particular as positional cue provider. Nonetheless, our understanding of fibroblast developmental programs is hampered because fibroblasts are highly heterogeneous and poorly characterized. Combining single-cell RNA-sequencing-based strategies including trajectory inference and in situ hybridization analyses, we address the diversity of fibroblasts and their developmental trajectories during chicken limb fetal development. We show that fibroblasts switch from a positional information to a lineage diversification program at the fetal period onset. Muscle CT and tendon are composed of several fibroblast populations that emerge asynchronously. Once the final muscle pattern is set, transcriptionally close populations are found in neighboring locations in limbs, prefiguring the adult fibroblast layers. We propose that the limb CT is organized in a continuum of promiscuous fibroblast identities, allowing for the robust and efficient connection of muscle to bone and skin.

Keywords: Biological sciences; Cell biology; Developmental biology; Molecular biology.


Conflict of interest statement

The authors declare no competing interests.

Figures

None
Graphical abstract
Figure 1
Figure 1
The dermis, tendon, and MCT branches emerge successively (A) UMAP plot of the integrated 5CT dataset (24,570 cells in total), showing the distribution of the CT datasets of origin. (B) Dendrogram of the STREAM-derived inferred trajectory for the 5CT dataset, showing the distribution of fibroblasts according to their CT datasets of origin. (C) Colorimetric in situ hybridization to adjacent and transverse limb sections of E10 chicken embryos with TWIST2, OSR1, and SCX probes (blue staining). (D) Dendrogram plotting gene expression levels for TWIST2, OSR1, and SCX on the inferred trajectory of the 5CT dataset. (E) Dendrogram as in (B) showing the association of color-coded DAVID categories with the origin (S0-S1), dermis (S1-S2), tendon (S3-S4), and MCT (S5-S7 and S5-S6) branches. The GO term-associated DAVID categories are: DNA binding/homeobox/transcription in pink; secreted/glycoproteins/extracellular matrix (ECM) in light green; collagens/extracellular matrix (ECM) organization in green; cell adhesion/focal adhesion in brown. For the S3-S4 (tendon) and S5-S6 (MCT) branches, the top 3 associated DAVID categories are ordered by decreasing enrichment scores with the highest score to the left. The other branches are associated with a single DAVID category. See also Figure S1.
Figure 2
Figure 2
CT fibroblasts switch from a positional information program to a lineage diversification program around E7 (A) Feature plots showing the distribution of cells positive for the positional markers LMX1B, MSX2, HOXA11, and HOXD11 in the E4 CT dataset. (B) Feature plots showing the distribution of cells positive for the lineage markers SCX and OSR1 in the E4 CT dataset. (C and D) Colorimetric in situ hybridization with SCX (C) or OSR1 (D) probes to longitudinal limb sections of E4 embryos. (E) Feature plots showing the distribution of MEIS2+ cells (proximal marker) and HOXA13+ cells (distal marker) in E4, E6, E7, E9, and E10 CT datasets. (F) Feature plots showing the distribution of SCX+ cells (green dots), OSR1+ cells (red dots), and SCX+/OSR1+ cells (yellow dots) in E4, E6, E7, E9, and E10 CT datasets. (G) Feature plots showing the distribution of TWIST2+ cells in E4, E6, E7, E9, and E10 CT datasets. Ellipses in (E–G) delineate UMAP regions with no positional information but emerging lineage information. (H–J) Colorimetric in situ hybridization with SCX (H and I) or OSR1 (J) probes (dark blue) to transverse limb sections of E6 chicken embryos. (H) Myosin immunodetection (green) and DAPI staining (light blue) were overlaid over SCX detection by in situ hybridization (dark blue). (I and J) Ventral muscle masses are delineated with white dashed lines. u, ulna, r radius.
Figure 3
Figure 3
Dermis, MCT, and tendon are composed of molecularly distinct populations at E10 (A) UMAP plot showing the distribution of the CT fibroblast clusters at E10. (B) Feature plots showing the distribution of TWIST2+, OSR1+, and SCX+ fibroblasts across CT clusters at E10. (C) Dendrogram of the 5CT inferred trajectory, highlighting the distribution of E10 clusters. Clusters from the other stages are grouped in light blue. (A) and (B) combined allow to position the dermis, MCT, and tendon types on (C). (D) Heatmap showing the relative expression of the top 10 markers across all cells for each of the nine CT clusters, ordered by CT types at E10. Upregulated genes in yellow, downregulated genes in purple. (E) Dotplot showing the average expression levels and the fraction of expressing cells for a selection of genes in each of the 9 CT clusters, ordered by CT types. See also Figure S2.
Figure 4
Figure 4
Dermal fibroblasts are divided in two molecularly distinct populations with no obvious spatial regionalization (A and B) TWIST2 expression on violin plot showing log-normalized expression levels across clusters (A) and in chicken limbs with in situ hybridization to transverse limb sections of E10 chicken embryos (B). (C) Cell numbers and associated percentage of dermal markers in clusters 2 and 3. (D and E) Feature plots showing the distribution of the module score for cluster 2 (D) and cluster 3 (E) in the E10 CT dataset. (F) Violin plots showing the log-normalized expression levels of HTRA1, BCL11B, and SST genes across clusters. (G–L) Colorimetric in situ hybridization to adjacent limb transverse sections of E10 chicken embryos with HTRA1 (G and J), BCL11B (H and K), and SST (I and L) probes (blue). (J–L) are high magnifications of dorso-posterior dermis regions from sections shown in (G–I). Limb sections are oriented dorsal to the top and posterior to the left. u, ulna; r, radius.
Figure 5
Figure 5
MCT clusters map to concentric fibroblast layers (A–D) Feature plots showing the distribution of the module score for cluster 7 (A), cluster 1 (B), cluster 0 (C), and cluster 8 (D) in the E10 CT dataset. (E–H) Colorimetric in situ hybridization to transverse limb sections at the level of the middle of the forearm of E10 chicken embryos with CHODL (E), ANXA2 (F), ALDH1A2 (G), and EPHA3 (H) probes (blue). (I–L) Fluorescent in situ hybridization to transverse limb sections hybridized with CHODL (I), ANXA2 (J), ALDH1A2 (K), and EPHA3 (L) probes (red) combined with myosin immunostaining (green) and DAPI staining (blue). Limb muscles shown in (I–L) are labeled with black asterisks in limb sections of (E–H), respectively. (I) Arrows point to CHODL gene expression in the hypodermis. (M) Double fluorescent in situ hybridization to transverse limb sections focused on the FCU muscle (ventro-posterior muscle) with CHODL (cluster 7, green) and ANXA2 (cluster 1, red) probes, combined with myosin immunolabeling (gray). The white arrow on high magnification points to the hypodermis (green CHODL labeling), while the arrowhead points to epimysium (red ANXA2 labeling). (N) Percentage of CHODL+, ANXA2+, and CHODL+/ANXA2+ fibroblasts among the CHODL-ANXA2 population. (O) Double fluorescent in situ hybridization to transverse limb sections focused to the FCU muscle with ANXA2 (cluster 1, green) and ALDH1A2 (cluster 0, red) probes, combined with myosin immunolabeling (gray). (P) Percentage of ANXA2+, ALDH1A2+, and ALDH1A2+/ANXA2+ fibroblasts among the ANXA2-ALDH1A2 population. Limb sections are oriented dorsal to the top and posterior to the left. t, tendon, u, ulna; r, radius. See also Figures S3–S6.
Figure 6
Figure 6
Fetal tendons are divided in three fibroblast populations: peritenon, enthesis/perichondrium, and tendon proper (A) Feature plot showing the distribution of the module score for clusters 4 in the E10 CT dataset. (B) Violin plot showing the log-normalized expression levels of ADGRG2 gene across clusters. (C,C′) Double in situ hybridization with ADGRG2 probe (red) and CHODL probe (to label tendons, in green) to transverse limb sections at distal level (C) and longitudinal limb sections (C′) of E10 chicken embryos, combined with myosin immunolabeling (gray) and DAPI staining (blue). (C,C′) Arrows point to ADGRG2 expression (red) surrounding tendons (green). (D and E) Double fluorescent in situ hybridization to adjacent transverse limb sections at E10 with ADGRG2 (red)/CHODL (green) (D) and ANXA2 (red)/CHODL (green) probes (E) combined with myosin immunolabeling (gray) and DAPI staining (blue). (F,F′) Double fluorescent in situ hybridization to adjacent transverse limb sections at E10 with ADGRG2 (red)/CHODL (green) (F) and ANXA2 (red)/CHODL (green) probes (F′) combined with myosin immunolabeling (gray) and DAPI staining (blue). (D-F′) White arrows point to ADGRG2 (D and F) and ANXA2 (E,F′) expression surrounding tendons and muscles. (G) Feature plot showing the distribution of the module score for cluster 6 in the E10 CT dataset. (H) Colorimetric in situ hybridization to transverse limb sections at E10 with MYLK probe (blue), focused on tendon attachment to cartilage element. (I and J) Fluorescent in situ hybridization to longitudinal tendon section with NET1 (a cluster 6 marker) probe (red) (I) and to transverse limb section with COL12A1 probe (red) (J) combined with myosin immunolabeling (green) and DAPI staining (blue). (I and J) Arrows point to tendon attachments to cartilage elements labeled with NET1 (I) and COL12A1 (J). (K) Feature plot showing the distribution of the module score for cluster 5 in the E10 CT dataset. (L and M) Double fluorescent in situ hybridization to transverse limb sections at E10 (L) and focused on FCU muscle (M) with SCX (red) and TNMD (green) probes, combined with myosin immunolabeling (gray). (N) Percentage of SCX+, TNMD+, and SCX+/TNMD+ fibroblasts among the SCX-TNMD population. (O and P) Fluorescent in situ hybridization with the NET1 probe (red) combined with myosin immunolabeling (green) to transverse limb sections (O) and to longitudinal muscle sections (P, DAPI staining in blue) of E10 chicken embryos. Arrows point to NET1 expression in tendons (O) and to tendon attachment close to muscle (P). (Q) Cell numbers and associated percentage of tendon markers in cluster 5. (R and S) Double fluorescent in situ hybridization to transverse limb sections at E10, focused on FCU muscle (R) and FCU tendon (S) with NET1 (green) and TNMD (red) probes, combined with myosin imunolabeling (gray). (T) Percentage of NET1+, TNMD+, and NET1+/TNMD+ fibroblasts among the NET1-TNMD population. See also Figure S7.
Figure 7
Figure 7
MCT and tendon fibroblast populations successively emerge from a common population at the onset of the fetal period Representation of the CT cluster lineage tree derived from the analysis of STREAM trajectories performed on the E6-E7, E7-E9, and E9-E10 combined CT datasets (see Figure S8). UMAP plots showing the distribution of CT clusters for the E6, E7, E9, and E10 CT datasets. This schematic only includes the MCT- and tendon-related lineage links. To illustrate that tendon and MCT lineages segregate from E7, the cluster lineage tree was separated in two branches and the E9 and E10 UMAP plots were duplicated. Black arrows refer to lineage links before MCT-tendon lineage segregation. Blue arrows refer to MCT-related lineage links. Green arrows refer to tendon-related lineage links. The cluster identity is indicated as early as it can be identified. See also Figures S8 and S9.
Figure 8
Figure 8
Spatial arrangement of fibroblast populations prefigures the mature fibroblast layers associated with adult skeletal muscle (A) UMAP plot showing the distribution of CT clusters at E10. Specific markers for which in situ hybridization was performed are assigned to clusters. (B) Schematic summarizing the location of fibroblast populations on limb transverse section at E10. The same color code was used for the in silico clusters and the fibroblast populations in limbs, except for cluster 8, color-coded as cluster 0, for the sake of clarity. Dermal fibroblast populations (clusters 2 and 3) were located at the limb periphery underneath the ectoderm. Underneath the dermis, the hypodermis (cluster 7) is the fibroblast layer that surrounds the whole musculoskeletal system. The fibroblast layers delineating tendon and muscles are the peritenon (Cluster 4) and epimysium (cluster 1) in continuity of each other. In addition to the peritenon fibroblasts, tendon fibroblasts were divided into two transcriptionally distinct clusters that correspond to enthesis /perichondrium (cluster 6) and tendon proper (cluster 5). The interstitial fibroblasts (clusters 0 and 8) in between muscle fibers (in white) prefigure the future endomysium.

References

    1. Helmbacher F., Stricker S. Tissue cross talks governing limb muscle development and regeneration. Semin. Cell Dev. Biol. 2020;104:14–30. doi: 10.1016/j.semcdb.2020.05.005. - DOI - PubMed
    1. Sefton E.M., Kardon G. Connecting muscle development, birth defects, and evolution: An essential role for muscle connective tissue. Curr. Top. Dev. Biol. 2019;132:137–176. doi: 10.1016/bs.ctdb.2018.12.004. - DOI - PMC - PubMed
    1. Nassari S., Duprez D., Fournier-Thibault C. Non-myogenic Contribution to Muscle Development and Homeostasis: The Role of Connective Tissues. Front. Cell Dev. Biol. 2017;5:22. doi: 10.3389/fcell.2017.00022. - DOI - PMC - PubMed
    1. Lynch M.D., Watt F.M. Fibroblast heterogeneity: implications for human disease. J. Clin. Invest. 2018;128:26–35. doi: 10.1172/JCI93555. - DOI - PMC - PubMed
    1. Purslow P.P. The Structure and Role of Intramuscular Connective Tissue in Muscle Function. Front. Physiol. 2020;11:495. doi: 10.3389/fphys.2020.00495. - DOI - PMC - PubMed