. 2024 Jul 24;11(7):240265.
doi: 10.1098/rsos.240265. eCollection 2024 Jul.

A discrete-to-continuum model for the human cornea with application to keratoconus

Affiliations

A discrete-to-continuum model for the human cornea with application to keratoconus

J Köry et al. R Soc Open Sci. .

Abstract

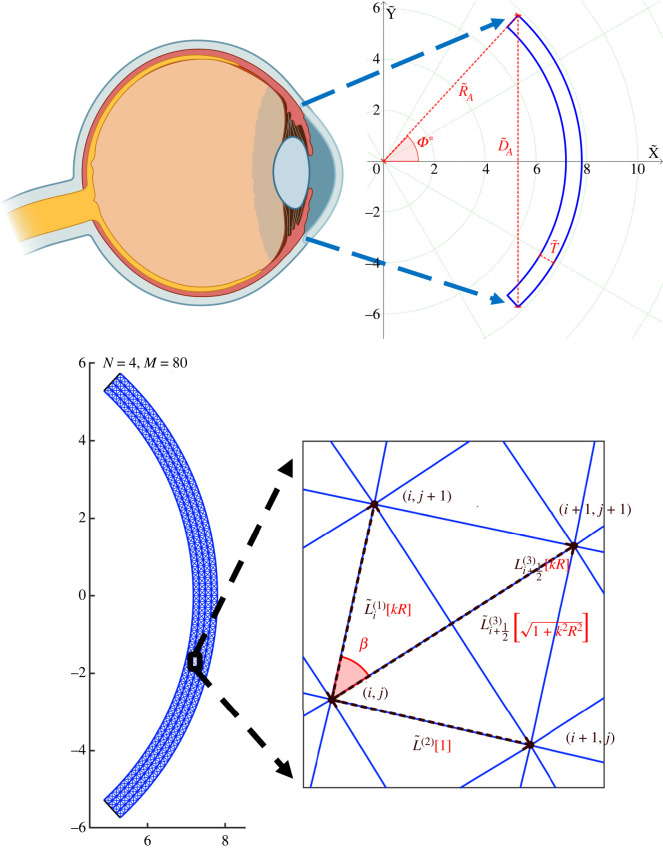
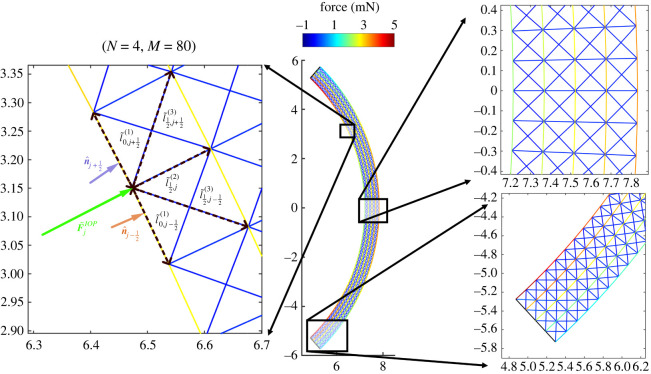
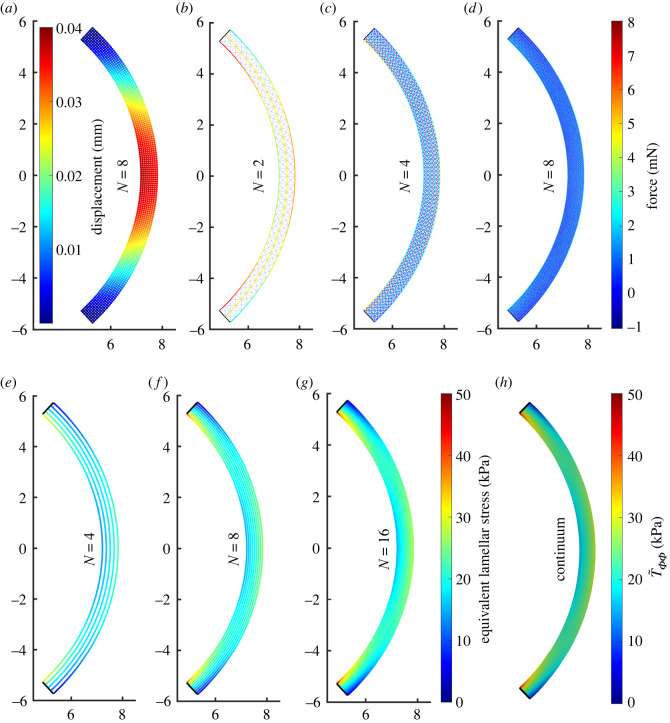
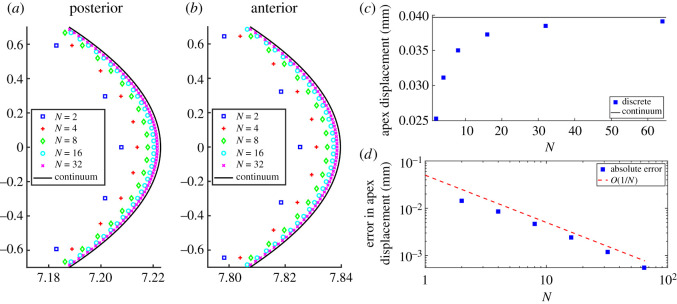
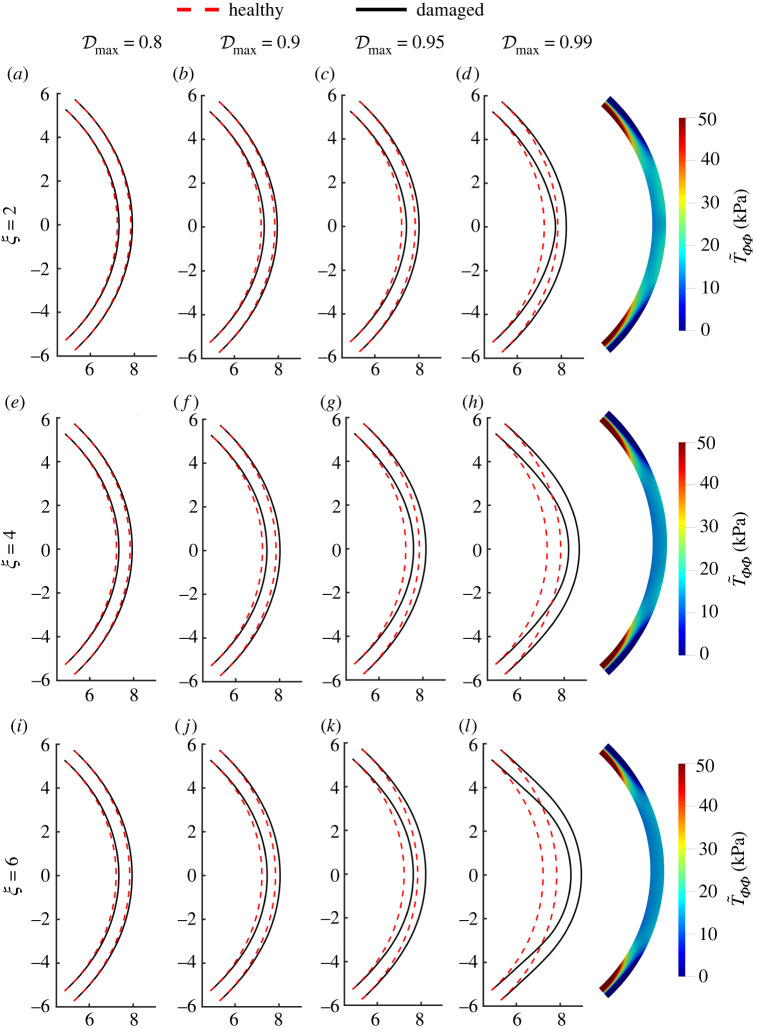
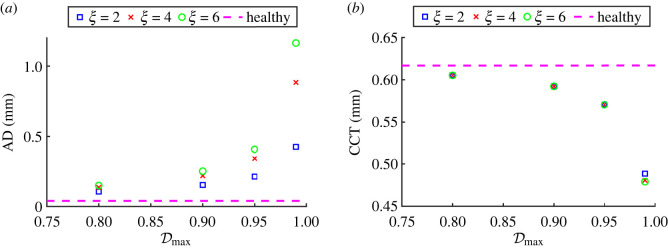
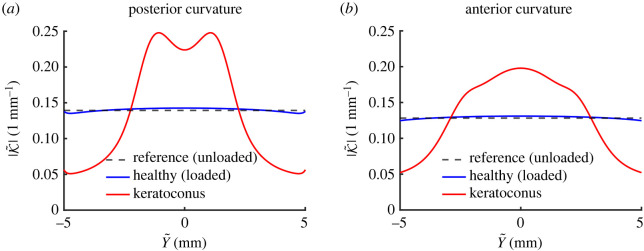
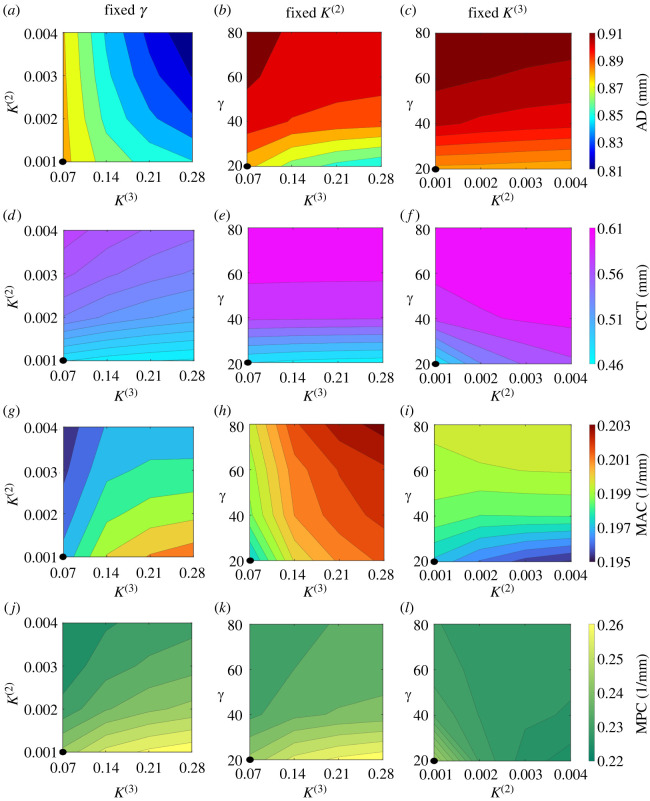
We introduce a discrete mathematical model for the mechanical behaviour of a planar slice of human corneal tissue, in equilibrium under the action of physiological intraocular pressure (IOP). The model considers a regular (two-dimensional) network of structural elements mimicking a discrete number of parallel collagen lamellae connected by proteoglycan-based chemical bonds (crosslinks). Since the thickness of each collagen lamella is small compared to the overall corneal thickness, we upscale the discrete force balance into a continuum system of partial differential equations and deduce the corresponding macroscopic stress tensor and strain energy function for the micro-structured corneal tissue. We demonstrate that, for physiological values of the IOP, the predictions of the discrete model converge to those of the continuum model. We use the continuum model to simulate the progression of the degenerative disease known as keratoconus, characterized by a localized bulging of the corneal shell. We assign a spatial distribution of damage (i.e. reduction of the stiffness) to the mechanical properties of the structural elements and predict the resulting macroscopic shape of the cornea, showing that a large reduction in the element stiffness results in substantial corneal thinning and a significant increase in the curvature of both the anterior and posterior surfaces.

Keywords: collagen lamellae; corneal mechanics; discrete-to-continuum asymptotics; keratoconus; multiscale modelling; proteoglycan matrix.


Conflict of interest statement

We declare we have no competing interests.

Figures

Figure 1.
Figure 1.
The unloaded geometry. Zoom onto the macroscale geometry of an idealized two-dimensional corneal slice (created with BioRender.com). The unloaded-configuration cornea is shown in blue, the key parameters are indicated in red and the green dotted lines (circles) depict the curves of constant Φ (R~). The unloaded configuration is then discretized (N = 4, M = 80, γ = 20). The panel on the bottom right presents a zoom onto the unit cell with the dimensional lengths of the elements (denoted with tilde) dependent on the radial position (index i). Terms in red represent corresponding quantities in the continuum limit (N → ∞) of the dimensionless model. Note that while the unit cell for a finite N and M forms an isosceles trapezoid, in the continuum limit this becomes a rectangle.
Figure 2.
Figure 2.
Healthy cornea loaded with IOP. The central panel shows the loaded configuration (p~=2 kPa) of the discrete model with N = 4 and M = 80. Note that the colour represents the axial force in the elements with positive (negative) values indicating tension (compression). Schematic in the left panel depicts how continuum IOP is transformed into discrete forces at posterior hinges. Panels on the right present zoomed-in steady-state force distributions through the corneal thickness at the apex (top) and the limbus (bottom).
Figure 3.
Figure 3.
For a healthy cornea under physiological IOP (2 kPa), node displacements are small (a) and the axial forces in individual elements decrease as N → ∞ (bd). The discrete axial forces in the lamellae can be divided by an appropriate cross-sectional area to get equivalent lamellar stresses. These stresses for large enough N (eg) agree well with the circumferential stress T~ΦΦ in the continuum limit (h), because the lamellar segments are the stiffest elements. Note that while T~ΦΦ in the continuum model exceeds the displayed range in small regions near domain corners, we for ease of comparison restrict the colourbar to the same range as for the discrete model.
Figure 4.
Figure 4.
Details of posterior (a) and anterior (b) surfaces near the apex for a healthy cornea inflated to 2 kPa IOP. Using M = 20N, the discrete profiles for N = 2 (blue squares), N = 4 (red pluses), N = 8 (green diamonds), N = 16 (cyan circles) and N = 32 (purple crosses) converge to the continuum predictions (solid black curves). Note that in order to make visible the otherwise small differences between the discrete and continuum solutions, we used different scales for X and Y axes (all indicated length units are still in mm). Panels on the right depict the predictions for apex displacement from discrete and continuum models. Panel (c) shows that the prediction of the discrete model for increasing N (blue squares) approaches that of continuum model (horizontal black line). Panel (d) documents that the absolute error, defined as the difference in apex displacement between the discrete and the continuum model, decreases to 0 as O(1/N).
Figure 5.
Figure 5.
Predicted diseased corneal shapes using the continuum model with the parabolic (ξ = 2 in (4.2)); (ad), quartic (ξ = 4; eh) and sextic (ξ = 6; il) damage profiles and varying value of central damage Dmax=0.8 (first column), 0.9 (second column), 0.95 (third column), 0.99 (fourth column). Panels on the right show the circumferential stress T~ΦΦ at Dmax=0.99 for the three considered values of ξ—this can be compared with the healthy profile in figure 3h.
Figure 6.
Figure 6.
Key experimental metrics, apex displacement (AD; a) and central corneal thickness (CCT; b), plotted for varying damage parameters, Dmax and ξ.
Figure 7.
Figure 7.
Comparison of reference, healthy and diseased (using Dmax=0.99 and ξ = 4 in (4.2)) curvatures. Panels (a,b) show curvatures of the posterior and anterior surface, respectively.
Figure 8.
Figure 8.
Comparison of key metrics of diseased corneas (using Dmax=0.99 and ξ = 4 in (4.2)) for varying γ, K(2) and K(3). In left, central and right panels, we fix at their baseline values γ, K(2) and K(3), respectively, and vary the remaining parameters. We plot the apex displacement (AD; ac), the central corneal thickness (CCT; df), the maximum anterior curvature (MAC; gi) and the maximum posterior curvature (MPC; jk). For comparison, we note that the reference (unloaded cornea) values are AD=0 mm, CCT=0.62 mm, MAC=1/R~A0.128mm1, MPC=1/R~P0.139mm1 and the values for healthy cornea loaded with physiological IOP are AD=0.04 mm, CCT=0.617 mm, MAC = 0.131 mm−1 and MPC = 0.143 mm−1. Black circles at bottom-left corners of the panels indicate the case where all parameters are fixed at their baseline values (γ = 20, K(2) = 0.001 and K(3) = 0.07).

References

    1. Meek KM, Boote C. 2004. The organization of collagen in the corneal stroma. Exp. Eye Res. 78, 503-512. (10.1016/j.exer.2003.07.003) - DOI - PubMed
    1. Meek KM. 2009. Corneal collagen—its role in maintaining corneal shape and transparency. Biophys. Rev. 1, 83-93. (10.1007/s12551-009-0011-x) - DOI - PMC - PubMed
    1. Elsheikh A, Wang D, Brown M, Rama P, Campanelli M, Pye D. 2007. Assessment of corneal biomechanical properties and their variation with age. Curr. Eye Res. 32, 11-19. (10.1080/02713680601077145) - DOI - PubMed
    1. Wang J, Liu X, Bao F, Lopes BT, Wang L, Eliasy A, Abass A, Elsheikh A. 2021. Review of ex-vivo characterisation of corneal biomechanics. Med. Nov. Technol. Dev. 11, 100074. (10.1016/j.medntd.2021.100074) - DOI
    1. Petsche SJ, Chernyak D, Martiz J, Levenston ME, Pinsky PM. 2012. Depth-dependent transverse shear properties of the human corneal stroma. Invest. Ophthalmol. Vis. Sci. 53, 873-880. (10.1167/iovs.11-8611) - DOI - PMC - PubMed

LinkOut - more resources