. 2024 Jul 10:15:1432045.
doi: 10.3389/fimmu.2024.1432045. eCollection 2024.

Differential response of IgM and IgG memory B cell populations to CD40L: insights of T cell - memory B cell interactions

Affiliations

Differential response of IgM and IgG memory B cell populations to CD40L: insights of T cell - memory B cell interactions

Hector Rincon-Arevalo et al. Front Immunol. .

Abstract

Memory B cells (mBCs) are characterized by their long-term stability, fast reactivation, and capability to rapidly differentiate into antibody-secreting cells (ASCs). However, the role of T cells in the differentiation of mBCs, in contrast to naive B cells, remains to be delineated. We study the role of T cells in mBC responses, using CD40L stimulation and autologous T-B co-cultures. Our results showed that increased CD40L levels led to a selective increased proliferation of IgM+ mBC, which did not class-switched, resulting in higher frequencies of IgM+ ASCs and a lower frequency of IgG+ ASCs. The IgG+/IgA+ mBCs were unaffected. We further compared the transcription of immune-related genes in IgM+ and IgG+ pre-plasmablasts cultured at high (500 ng/mL) and low (50 ng/mL) CD40L levels. In response to increased CD40L levels, both populations exhibited a core response to genes related to activation (TRAF1, AKT3, CD69, and CD80). However, they differed in genes related to cytokine/chemokine/homing interactions (CCL3/4/17, LTA, NKX2-3, BCL2 and IL21R) and cell-cell interactions (HLADR, CD40, and ICOSL), which were largely confined to IgG+ cells. Our findings revealed that in co-cultures with a high T-ratio, the response was similar to that found in cultures with high CD40L levels. These results suggest that IgG+ mBCs have a greater capacity for proliferation and T cell interaction, and weaker migration capabilities, leading to a preference for an IgG response over IgM in the short term. This adaptable response could fine-tune the memory repertoire with different functions of IgG versus IgM mBCs.

Keywords: CD40L; T:B co-stimulation; memory B cell; plasma cell; plasmablast.


Conflict of interest statement

The authors declare that the research was conducted in the absence of any commercial or financial relationships that could be construed as a potential conflict of interest.

Figures

Figure 1
Figure 1
Increasing levels of CD40L have divergent effects on the frequencies of IgG+ and IgM+ plasmablasts. (A) Representative scheme of different steps of culture of memory B cells (mBCs) to differentiate into pre-plasmablasts (prePBs) at day 4, plasmablasts (PBs) at day 7, and early plasma cells (early PCs) at day 10. (B) Representative pseudocolor plot of PBs populations based on IgG and IgA expression in cultures with low (50 ng/mL, left) or high (500 ng/mL, right) CD40L. (C) Frequency of Plasmablast with IgM+, IgG+, or IgA+ phenotype among different CD40L levels. (D, E) Frequency of (D) Plasmablast and (E) Plasmablast with IgM+, IgG+, or IgA+ phenotype in cultures with 50 and 500 ng/mL of CD40L. (F, G) Estimated number of (F) Plasmablast and (G) Plasmablast with IgM+, IgG+, or IgA+ phenotype in cultures with 50 and 500 ng/mL of CD40L. (H) Representative scheme of different steps of culture of sorted IgM+ naïve and IgM+ mBCs to differentiate into PBs at day 7. (I) Frequency of PBs in sorted population cultures on day 7. (J) Frequency of PBs with class-switch. (C) Non-parametric Kruskal–Wallis test with Dunn’s post-test. (D–G) Paired non-parametric Wilcoxon test. (I, J) Two-way ANOVA with Tukey’s post-hoc test. *p<0.05, **p<0.01, ***p<0.001, ****p<0.0001. ns, Not significant.
Figure 2
Figure 2
Increase of CD40L levels leads to increase frequency of proliferative IgM+ mBCs but not in IgA+/IgG+ memory B cells. (A) Representative scheme of culture of mBCs or naïve B cells with 50 and 500 ng/mL CD40L for 4 days. (B) Representative histogram of CFSE expression among IgM+, IgG+, and IgA+ cells from mBCs cultures on day 4. (B) Frequency of IgM+, IgG+, and IgA+ cells in mBCs cultures on day 4. (C) Frequency of divided cells among IgM+, IgG+, and IgA+ from mBCs from cultures on day 4. (D) Fold change of replication index among IgM+, IgG+, and IgA+ mBCs cells from cultures on day 4. Two-way ANOVA test with Tukey´s post-test. Data from six donors from two independent experiments. *p<0.05, **p<0.01, ***p<0.001.
Figure 3
Figure 3
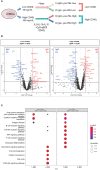
IgM+ and IgG+ mBCs showed differential response to equal CD40L levels. (A) Representative scheme of culture of memory B cells (mBCs) to carry immune targeted RNAseq analysis. After 4 days of co-culture with low or high CD40L levels, CD27+IgM+ and CD27+IgG+ pre-PBs were sorted. Comparison of IgM vs IgG pre-PBs in Low CD40L and High CD40L levels were analyzed. (B) Volcano plots showing differentially expressed genes (DEG) in Low CD40L (left) or High CD40L (right) conditions. Ref=IgM. (C) KEGG pathway enrichment of DEG from Down- and Up-regulated genes in Low CD40L and High CD40L comparisons. Lists of genes are presented in Supplementary Tables 1 and 2 .
Figure 4
Figure 4
IgM+ and IgG+ memory B cells share a common basic core response to high CD40L levels but differ in genes related to cytokines/chemokines, mainly in IgG+ mBCs. (A) Representative scheme of culture of memory B cells (mBCs) to carry immune targeted RNAseq analysis. After 4 days of co-culture with low or high CD40L levels, CD27+IgM+ and CD27+IgG+ pre-PBs were sorted. (B) Volcano plots showing differentially expressed genes (DEG) in IgM+ (left) or IgG+ (right) comparisons. Ref=Low CD40L. (C) Venn Diagram analysis of 37 differentially expressed genes (DEG) from IgM, and 210 DEG from IgG comparisons. The list of genes is presented in Supplementary Tables 3 and 4 . (D) Cnetplot of DEG, with genes and functional categories (KEGG enrichment) encoded as pies to distinguish different gene clusters. DEG comes from IgM (low vs high) and IgG (low vs high) comparisons. (E) Data for selected genes with interaction of factors (cell type and CD40L concentration). A list of the genes is presented in Supplementary Table 5 . (F) KEGG pathway enrichment analysis of DEG with interaction of factors. (G) Frequency of Traf1+ cells in IgM+, IgG+, and IgA+ cells from mBCs cultures with 50 and 500 ng/mL of CD40L. Two-way ANOVA with Tukey’s post-hoc test. *p<0.05, **p<0.01, ***p<0.001, ****p<0.0001. ns, Not significant.
Figure 5
Figure 5
Increasing the T-cell ratio results in divergent effects on the frequency of IgG+ and IgM+ pre-plasmablasts. (A) Representative scheme of co-culture of memory B cells (mBCs) or naïve B cells with T cells, at T:B ratios of 1:1, 1:5, and 1:20 (B cell numbers were always fixed). After four days of co-culture, the cells were analyzed by flow cytometry. (B) Representative pseudocolor plots of the different T:B cell ratios in co-cultures. (C) Frequency of IgM+, IgG+, and IgA+ cells at the end of mBCs (top) or naïve B cells (bottom) co-cultured with T cells at the indicated T:B ratios. (D) Frequency of Traf1+ cells in IgM+, IgG+, and IgA+ B cells from co-culture of T cells with mBCs (top) or naïve B cells (bottom). (E, F) Frequency of (E) divided cells and (F) fold change of replication index (right) among IgM+, IgG+, and IgA+ cells from mBCs co-cultures among indicated T:B ratios. Friedman test with Dunn’s post-test. *p<0.05, **p<0.01, ****p<0.0001.
Figure 6
Figure 6
Graphical summary of the results.

References

    1. Reusch L, Angeletti D. Memory B-cell diversity: From early generation to tissue residency and reactivation. Eur J Immunol. (2023) 53:e2250085. doi: 10.1002/eji.202250085 - DOI - PubMed
    1. Chappert P, Huetz F, Espinasse MA, Chatonnet F, Pannetier L, Da Silva L, et al. . Human anti-smallpox long-lived memory B cells are defined by dynamic interactions in the splenic niche and long-lasting germinal center imprinting. Immunity. (2022) 55:1872–90.e9. doi: 10.1016/j.immuni.2022.08.019 - DOI - PMC - PubMed
    1. Inoue T, Kurosaki T. Memory B cells. Nat Rev Immunol. (2024) 24:5–17. doi: 10.1038/s41577-023-00897-3 - DOI - PubMed
    1. Tan HX, Juno JA, Esterbauer R, Kelly HG, Wragg KM, Konstandopoulos P, et al. . Lung-resident memory B cells established after pulmonary influenza infection display distinct transcriptional and phenotypic profiles. Sci Immunol. (2022) 7:eabf5314. doi: 10.1126/sciimmunol.abf5314 - DOI - PubMed
    1. Suan D, Nguyen A, Moran I, Bourne K, Hermes JR, Arshi M, et al. . T follicular helper cells have distinct modes of migration and molecular signatures in naive and memory immune responses. Immunity. (2015) 42:704–18. doi: 10.1016/j.immuni.2015.03.002 - DOI - PubMed

LinkOut - more resources