

Highly Accurate and Precise Automated Cup-to-Disc Ratio Quantification for Glaucoma Screening
- PMID: 39051045
- PMCID: PMC11268341
- DOI: 10.1016/j.xops.2024.100540
Highly Accurate and Precise Automated Cup-to-Disc Ratio Quantification for Glaucoma Screening
Abstract
Objective: An enlarged cup-to-disc ratio (CDR) is a hallmark of glaucomatous optic neuropathy. Manual assessment of the CDR may be less accurate and more time-consuming than automated methods. Here, we sought to develop and validate a deep learning-based algorithm to automatically determine the CDR from fundus images.
Design: Algorithm development for estimating CDR using fundus data from a population-based observational study.
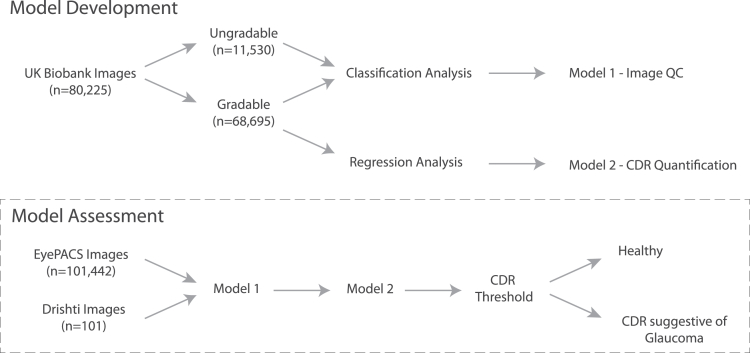
Participants: A total of 181 768 fundus images from the United Kingdom Biobank (UKBB), Drishti_GS, and EyePACS.
Methods: FastAI and PyTorch libraries were used to train a convolutional neural network-based model on fundus images from the UKBB. Models were constructed to determine image gradability (classification analysis) as well as to estimate CDR (regression analysis). The best-performing model was then validated for use in glaucoma screening using a multiethnic dataset from EyePACS and Drishti_GS.
Main outcome measures: The area under the receiver operating characteristic curve and coefficient of determination.
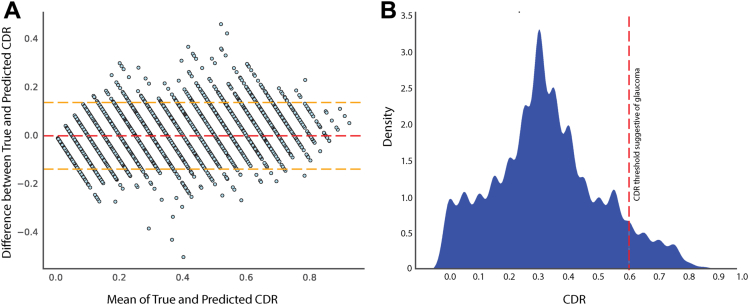
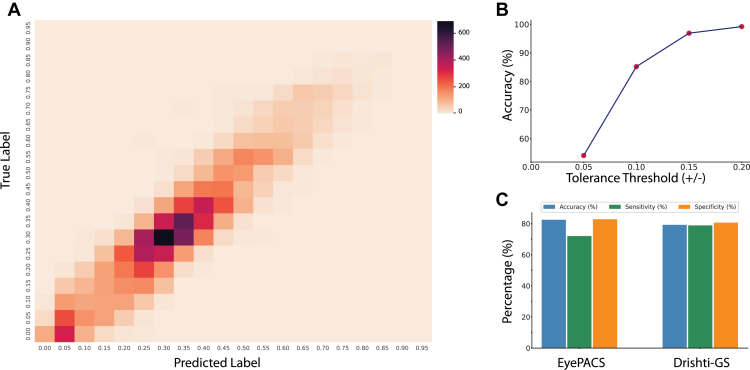
Results: Our gradability model vgg19_batch normalization (bn) achieved an accuracy of 97.13% on a validation set of 16 045 images, with 99.26% precision and area under the receiver operating characteristic curve of 96.56%. Using regression analysis, our best-performing model (trained on the vgg19_bn architecture) attained a coefficient of determination of 0.8514 (95% confidence interval [CI]: 0.8459-0.8568), while the mean squared error was 0.0050 (95% CI: 0.0048-0.0051) and mean absolute error was 0.0551 (95% CI: 0.0543-0.0559) on a validation set of 12 183 images for determining CDR. The regression point was converted into classification metrics using a tolerance of 0.2 for 20 classes; the classification metrics achieved an accuracy of 99.20%. The EyePACS dataset (98 172 healthy, 3270 glaucoma) was then used to externally validate the model for glaucoma classification, with an accuracy, sensitivity, and specificity of 82.49%, 72.02%, and 82.83%, respectively.
Conclusions: Our models were precise in determining image gradability and estimating CDR. Although our artificial intelligence-derived CDR estimates achieve high accuracy, the CDR threshold for glaucoma screening will vary depending on other clinical parameters.
Financial disclosures: Proprietary or commercial disclosure may be found in the Footnotes and Disclosures at the end of this article.
Keywords: Computer Vision; Deep Learning; Fundus Image; Glaucoma; UK Biobank.
© 2024 by the American Academy of Ophthalmology.
Figures
References
-
- Damms T., Dannheim F. Sensitivity and specificity of optic disc parameters in chronic glaucoma. Invest Ophthalmol Vis Sci. 1993;34:2246–2250. - PubMed
-
- Gordon M.O., Beiser J.A., Brandt J.D., et al. The ocular hypertension treatment study: baseline factors that predict the onset of primary open-angle glaucoma. Arch Ophthalmol. 2002;120:714–720. - PubMed
-
- Mwanza J.C., Tulenko S.E., Barton K., et al. Eight-Year incidence of open-angle glaucoma in the tema eye survey. Ophthalmology. 2019;126:372–380. - PubMed
-
- BMJ Publishing Group Ltd. BMA House. Square T. London & 9jr, W. European glaucoma society terminology and guidelines for glaucoma, 4th edition - Part 1supported by the EGS foundation. Br J Ophthalmol. 2017;101:1–72.
LinkOut - more resources
Full Text Sources
