Randomized Controlled Trial
. 2024 Aug;17(8):e011693.
doi: 10.1161/CIRCHEARTFAILURE.123.011693. Epub 2024 Jul 25.

Identifying the Mechanisms of a Peripherally Limited Exercise Phenotype in Patients With Heart Failure With Preserved Ejection Fraction

Affiliations
Randomized Controlled Trial

Identifying the Mechanisms of a Peripherally Limited Exercise Phenotype in Patients With Heart Failure With Preserved Ejection Fraction

Rachel J Skow et al. Circ Heart Fail. 2024 Aug.

Abstract

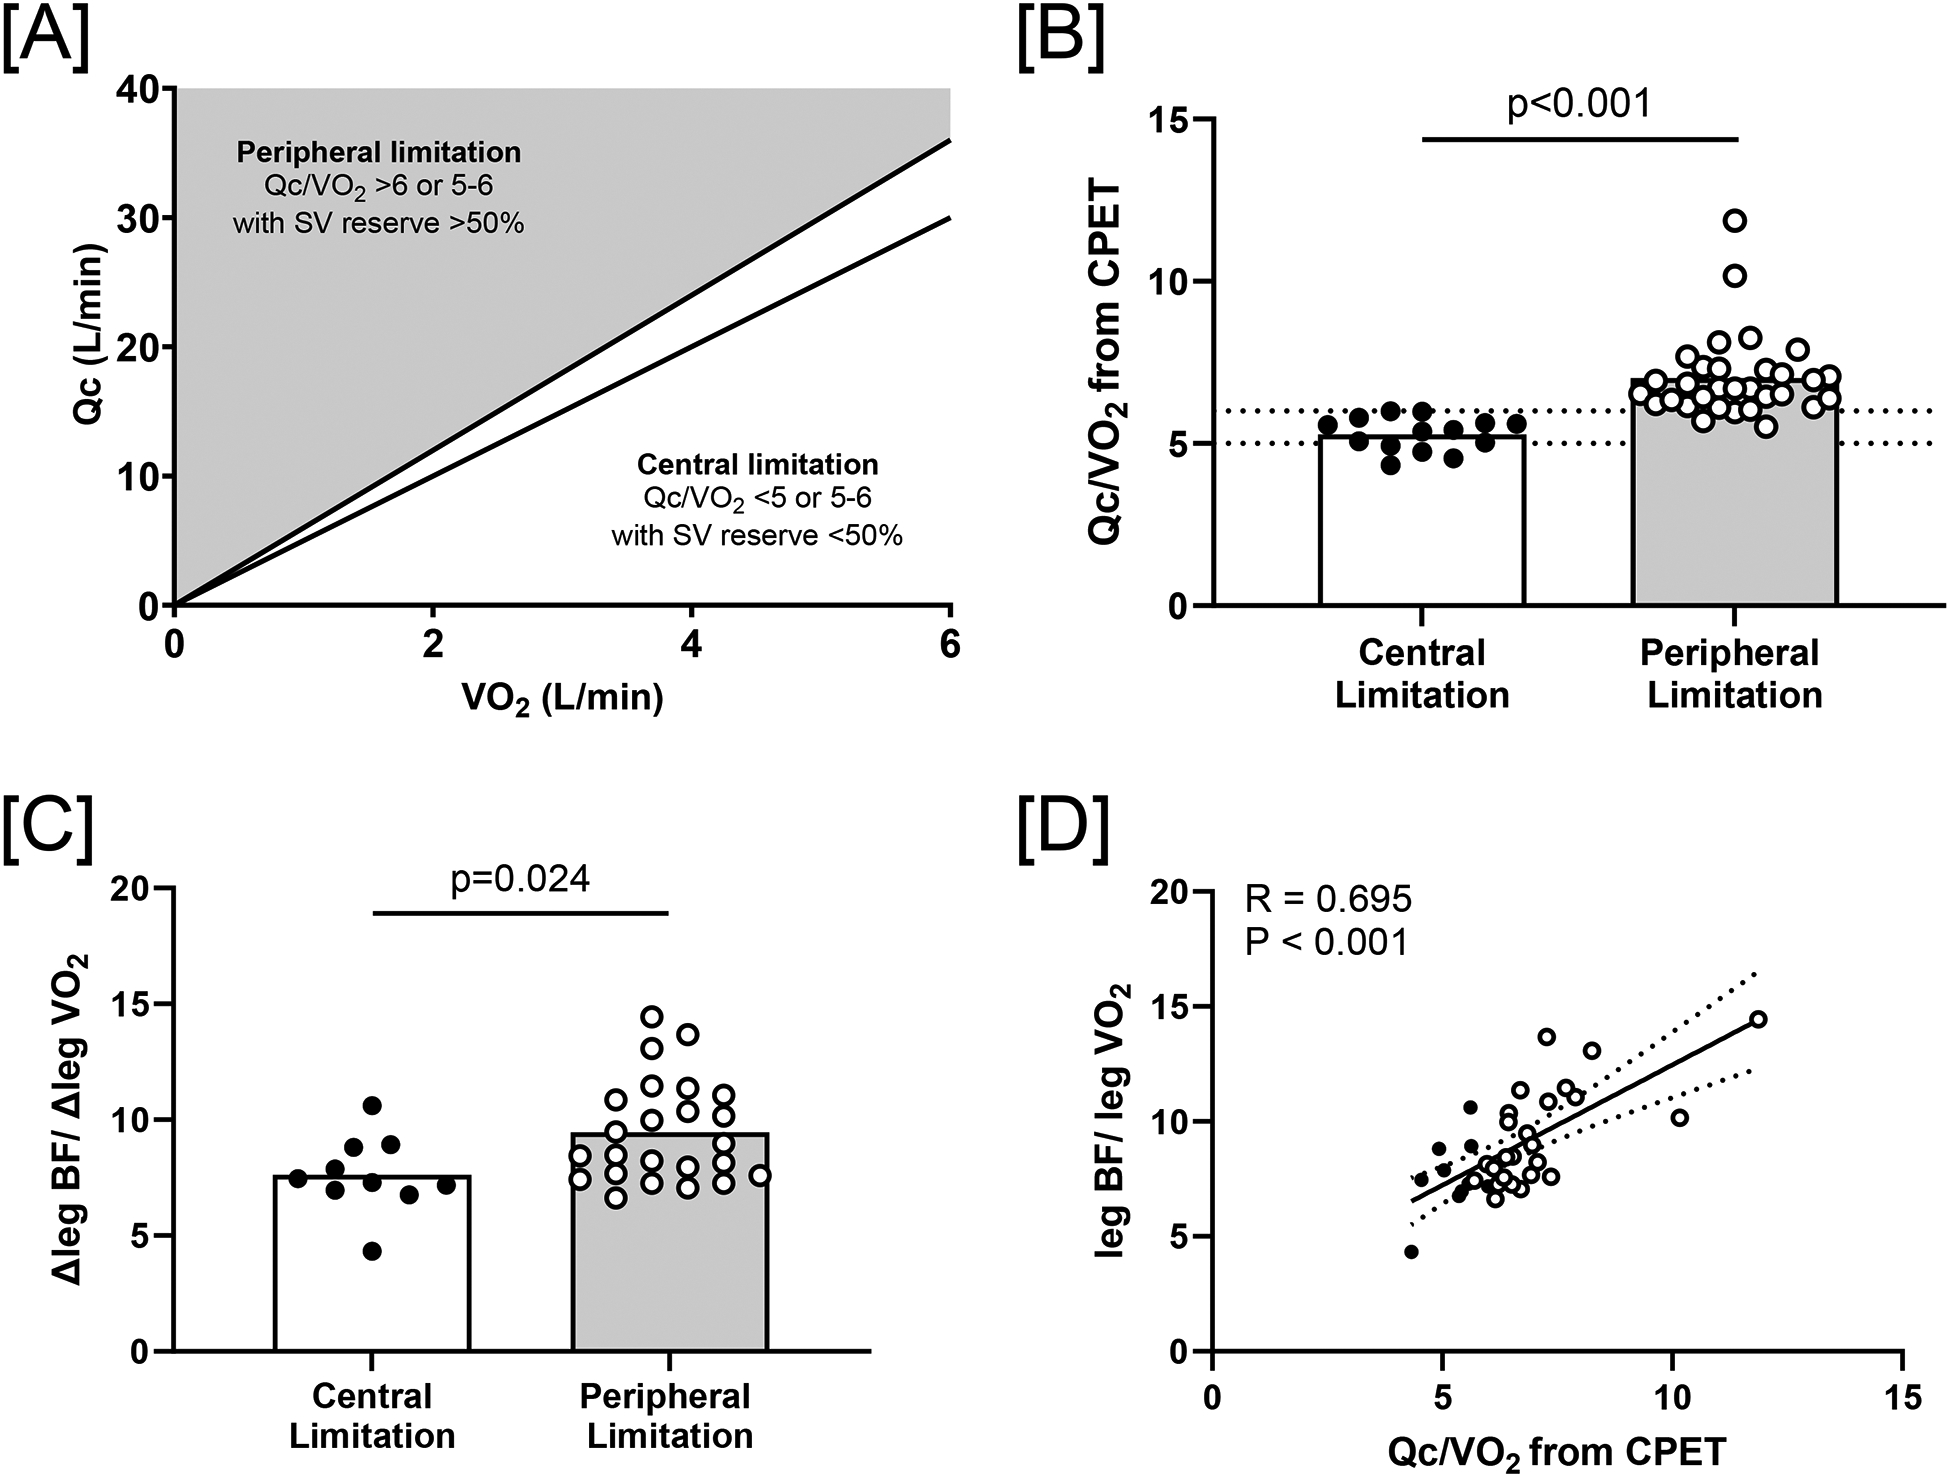
Background: We identified peripherally limited patients using cardiopulmonary exercise testing and measured skeletal muscle oxygen transport and utilization during invasive single leg exercise testing to identify the mechanisms of the peripheral limitation.

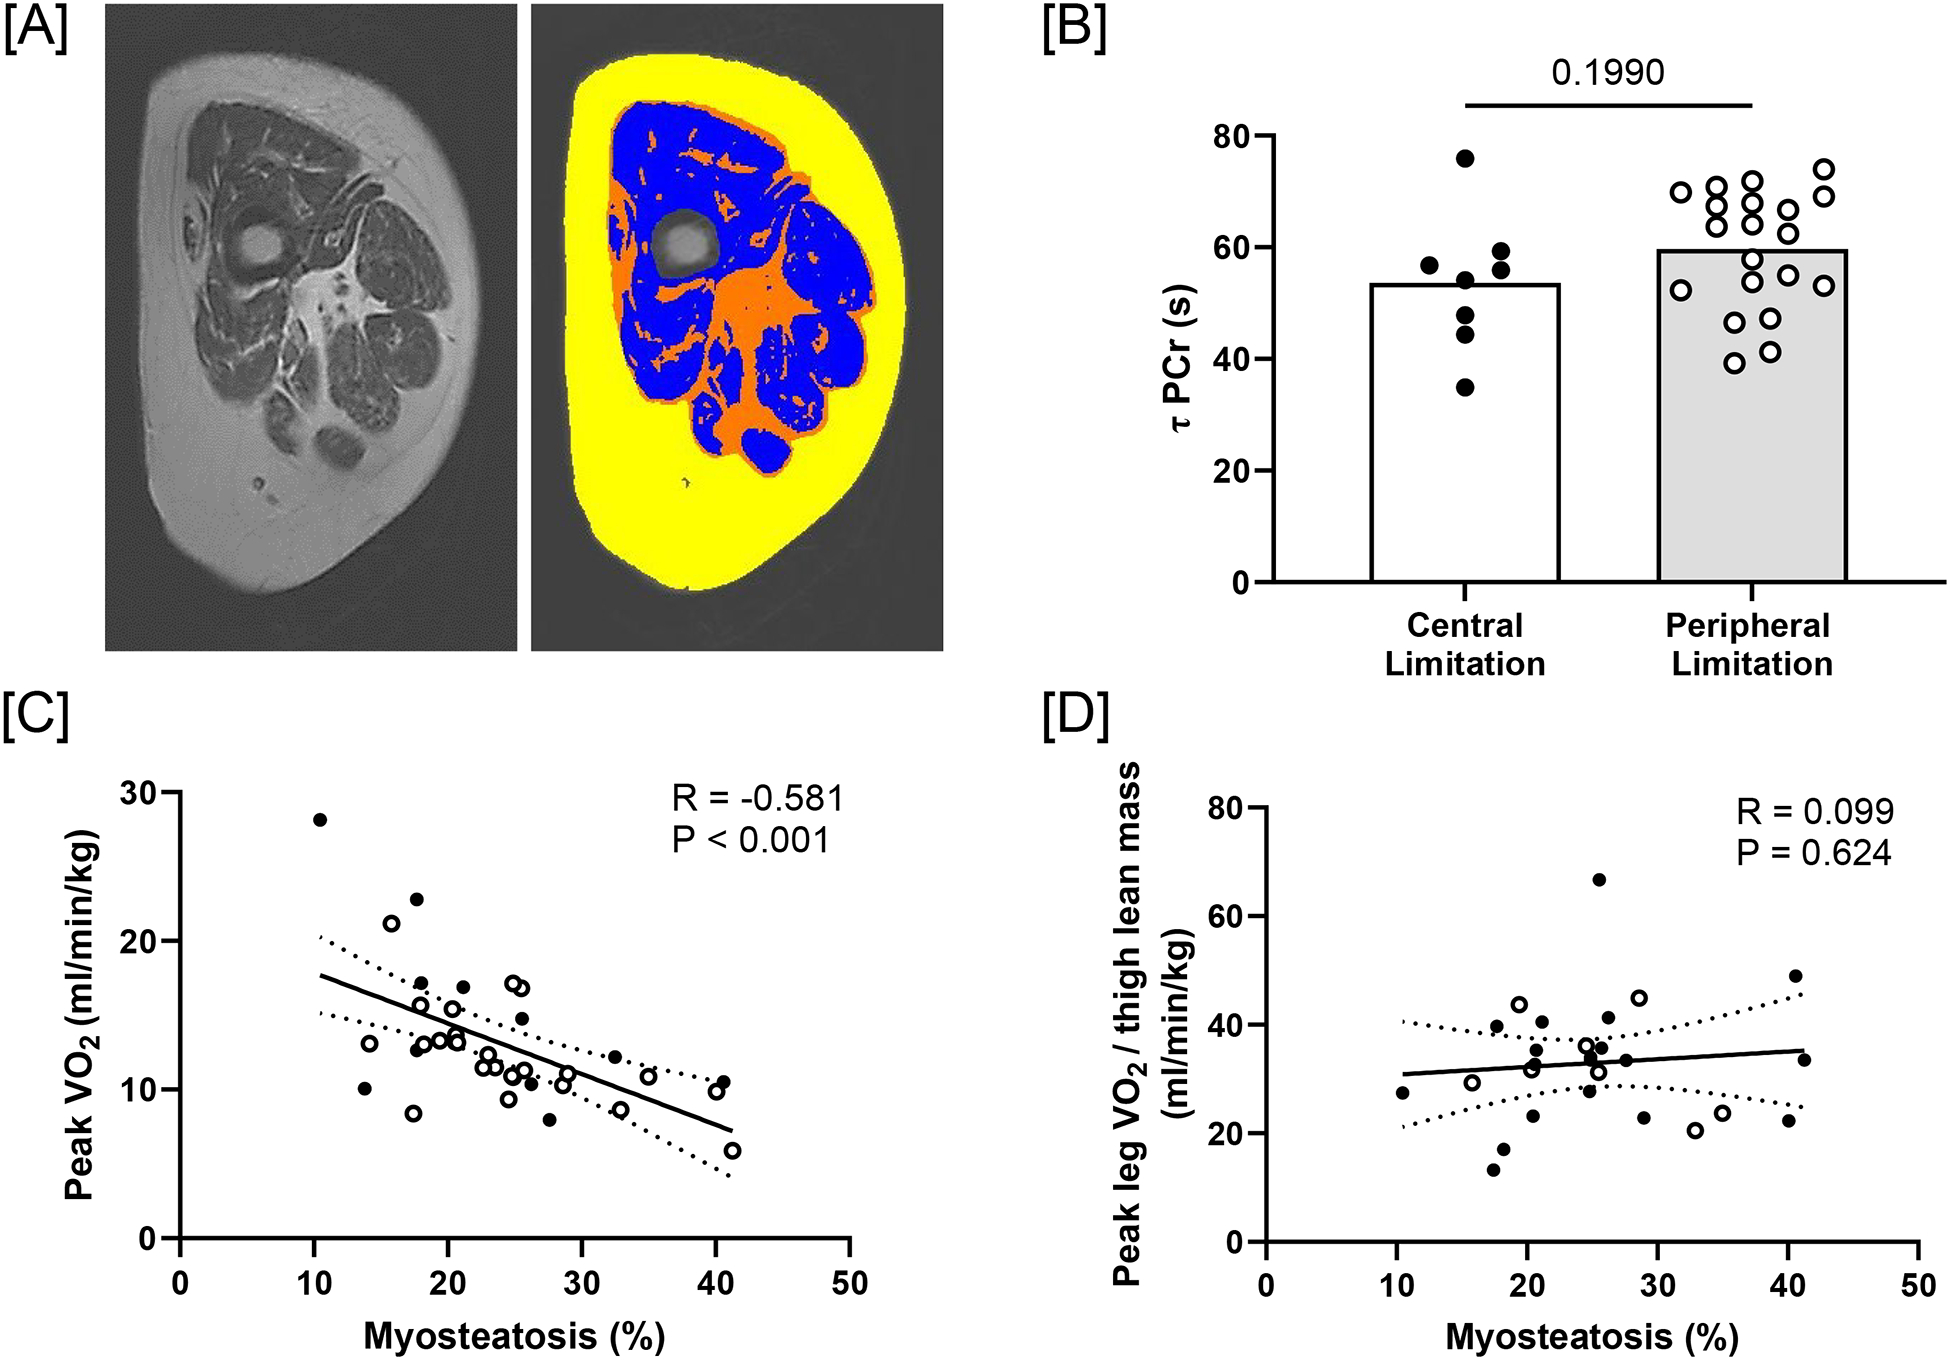
Methods: Forty-five patients with heart failure with preserved ejection fraction (70±7 years, 27 females) completed seated upright cardiopulmonary exercise testing and were defined as having a (1) peripheral limitation to exercise if cardiac output/oxygen consumption (VO2) was elevated (≥6) or 5 to 6 with a stroke volume reserve >50% (n=31) or (2) a central limitation to exercise if cardiac output/VO2 slope was ≤5 or 5 to 6 with stroke volume reserve <50% (n=14). Single leg knee extension exercise was used to quantify peak leg blood flow (Doppler ultrasound), arterial-to-venous oxygen content difference (femoral venous catheter), leg VO2, and muscle oxygen diffusive conductance. In a subset of participants (n=36), phosphocreatine recovery time was measured by magnetic resonance spectroscopy to determine skeletal muscle oxidative capacity.

Results: Peak VO2 during cardiopulmonary exercise testing was not different between groups (central: 13.9±5.7 versus peripheral: 12.0±3.1 mL/min per kg; P=0.135); however, the peripheral group had a lower peak arterial-to-venous oxygen content difference (central: 13.5±2.0 versus peripheral: 11.1±1.6 mLO2/dL blood; P<0.001). During single leg knee extension, there was no difference in peak leg VO2 (P=0.306), but the peripherally limited group had greater blood flow/VO2 ratio (P=0.024), lower arterial-to-venous oxygen content difference (central: 12.3±2.5 versus peripheral: 10.3±2.2 mLO2/dL blood; P=0.013), and lower muscle oxygen diffusive conductance (P=0.021). A difference in magnetic resonance spectroscopy-derived phosphocreatine recovery time was not detected (P=0.199).

Conclusions: Peripherally limited patients with heart failure with preserved ejection fraction identified by cardiopulmonary exercise testing have impairments in oxygen transport and utilization at the level of the skeletal muscle quantified by invasive knee extension exercise testing, which includes an increased blood flow/V̇O2 ratio and poor muscle diffusive capacity.

Registration: URL: https://www.clinicaltrials.gov; Unique identifier: NCT04068844.

Keywords: exercise test; heart failure; magnetic resonance imaging; muscle, skeletal; stroke volume.


Conflict of interest statement

None.

Figures

Figure 1.
Figure 1.
Graphical representation of the phenotyping strategy for patients with heart failure with preserved ejection fraction (A). Participants were phenotyped by their cardiac output (Qc) response to increases in metabolic demand (VO2) determined from whole-body cardiopulmonary exercise test (CPET). Individuals with an elevated Qc/VO2 (>6) were assigned to the peripheral limitation phenotype (grey bars, open symbols), and those with Qc/VO2 <5 were assigned central limitation (white bars, filled symbols). Where Qc/VO2 slope was between 5–6, stroke volume (SV) reserve at 20W (i.e., submaximal exercise) was used to define the phenotype where those with SV reserve < 50% were assigned to the central limitation phenotype and >50% to the peripheral limitation phenotype. B) Slope of the CPET Qc/VO2 for each group (central: n=14; peripheral: n=31). Dashed lines indicate Qc/VO2 slope values of 5 and 6. C) Slope of the leg blood flow (BF) versus leg VO2 obtained from the SLKE assessment (central: n=10; peripheral: n=25). D) Relationship between CPET Qc/VO2 and SLKE leg BF/leg VO2 slopes showing a strong positive correlation between the two measures (n=35). Groups were compared with an unpaired student t-test of normally distributed data (panel C), a Mann Whitney non-parametric U-test for non-normally distributed data (Panel B), and Pearson product moment correlation coefficient was calculated to determine a relationship between variables (Panel D) using GraphPad Prism (version 10.0.1).
Figure 2.
Figure 2.
Resting (open symbols) and peak single leg knee extension (SLKE) exercise data (filled symbols) in patients with heart failure with preserved ejection fraction who have central limitations to exercise (white bars) or peripheral limitations to exercise (grey bars). A) Leg blood flow (BF) at rest and peak SLKE exercise determined from doppler ultrasound. B) arterial-to-venous oxygen content difference (Δa-vO2) at rest and peak SLKE exercise. C) Leg oxygen uptake (VO2) at rest and peak exercise. D) Leg skeletal muscle diffusional conductance for oxygen (DMO2) at rest and peak SLKE exercise. Two-factor repeated measures analysis of variance was used to determine main effect of group, exercise, and interactions using GraphPad Prism (version 10.0.1). *p<0.05, difference between groups at peak exercise determined using Sidak multiple comparison test.
Figure 3.
Figure 3.
Magnetic resonance imaging (MRI) in patients with heart failure with preserved ejection fraction who have central (white bars, filled symbols) or peripheral limitations to exercise (grey bars, open symbols). A) A representative MR image from a patient with HFpEF from a mid-thigh T2-image pre-tagging (left; greyscale) and post-tagging (right; color) showing thigh muscle (blue), intermuscular fat (orange) and subcutaneous fat (yellow). B) Bar graph showing group mean and individual data for phosphocreatine (PCr) recovery time (τ). C) Negative relationship between index of myosteatosis derived from MRI and whole-body peak oxygen consumption (VO2) from cardiopulmonary exercise test. D) No relationship between index of myosteatosis derived from MRI and single leg knee extension peak leg VO2. Groups were compared with an unpaired student t-test (panel B) and Pearson product moment correlation coefficient was calculated to determine a relationship between variables (panel C & D) using GraphPad Prism (version 10.0.1).

References

    1. Wilson JR, et al. , Relationship between exertional symptoms and functional capacity in patients with heart failure. J Am Coll Cardiol, 1999. 33(7): p. 1943–7. - PubMed
    1. Haykowsky MJ, et al. , Determinants of exercise intolerance in elderly heart failure patients with preserved ejection fraction. J Am Coll Cardiol, 2011. 58(3): p. 265–74. - PMC - PubMed
    1. Borlaug BA, Mechanisms of exercise intolerance in heart failure with preserved ejection fraction. Circ J, 2014. 78(1): p. 20–32. - PubMed
    1. Dhakal BP, et al. , Mechanisms of exercise intolerance in heart failure with preserved ejection fraction: the role of abnormal peripheral oxygen extraction. Circ Heart Fail, 2015. 8(2): p. 286–94. - PMC - PubMed
    1. Nayor M, et al. , Impaired Exercise Tolerance in Heart Failure With Preserved Ejection Fraction: Quantification of Multiorgan System Reserve Capacity. JACC Heart Fail, 2020. 8(8): p. 605–617. - PMC - PubMed

Publication types

Substances

Associated data