. 2024 Jul 12;13(3):55.
doi: 10.3390/antib13030055.

NK Cytotoxicity Mediated by NK-92 Cell Lines Expressing Combinations of Two Allelic Variants for FCGR3

Affiliations

NK Cytotoxicity Mediated by NK-92 Cell Lines Expressing Combinations of Two Allelic Variants for FCGR3

Marta Freitas Monteiro et al. Antibodies (Basel). .

Abstract

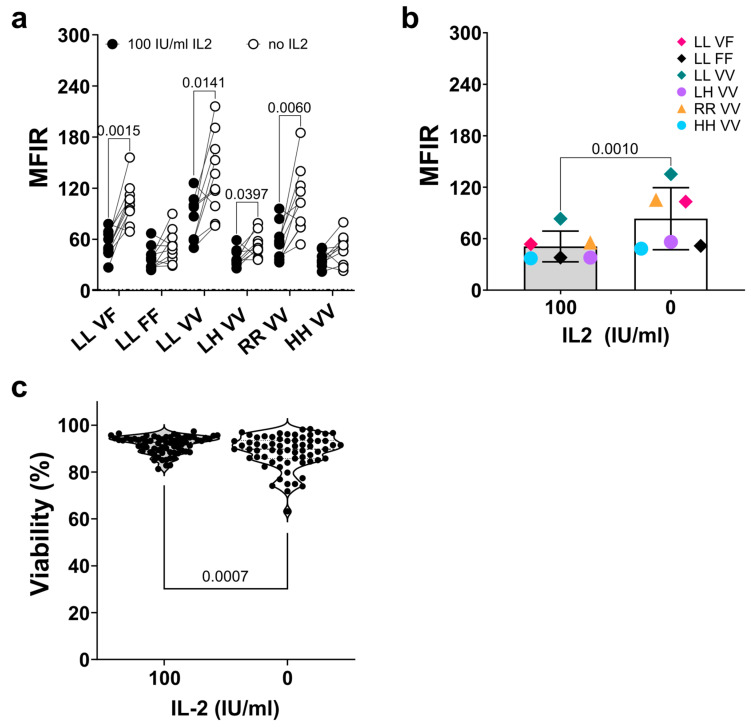
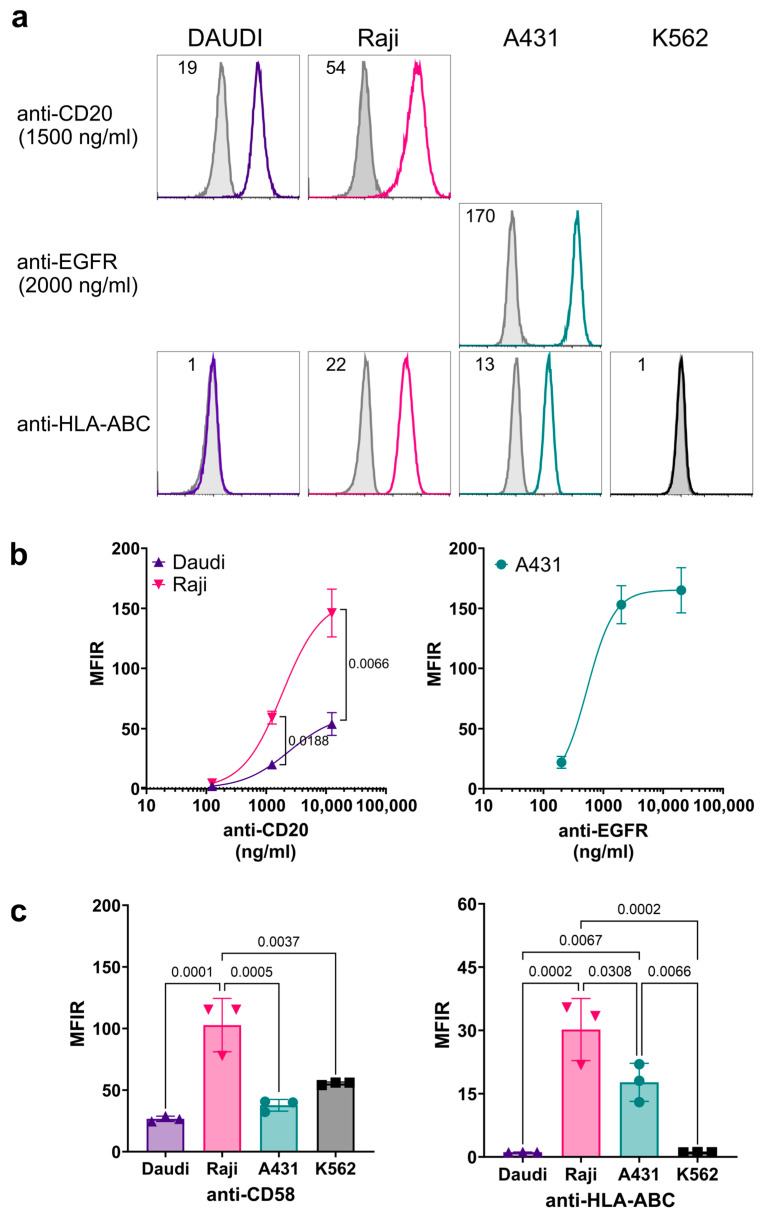
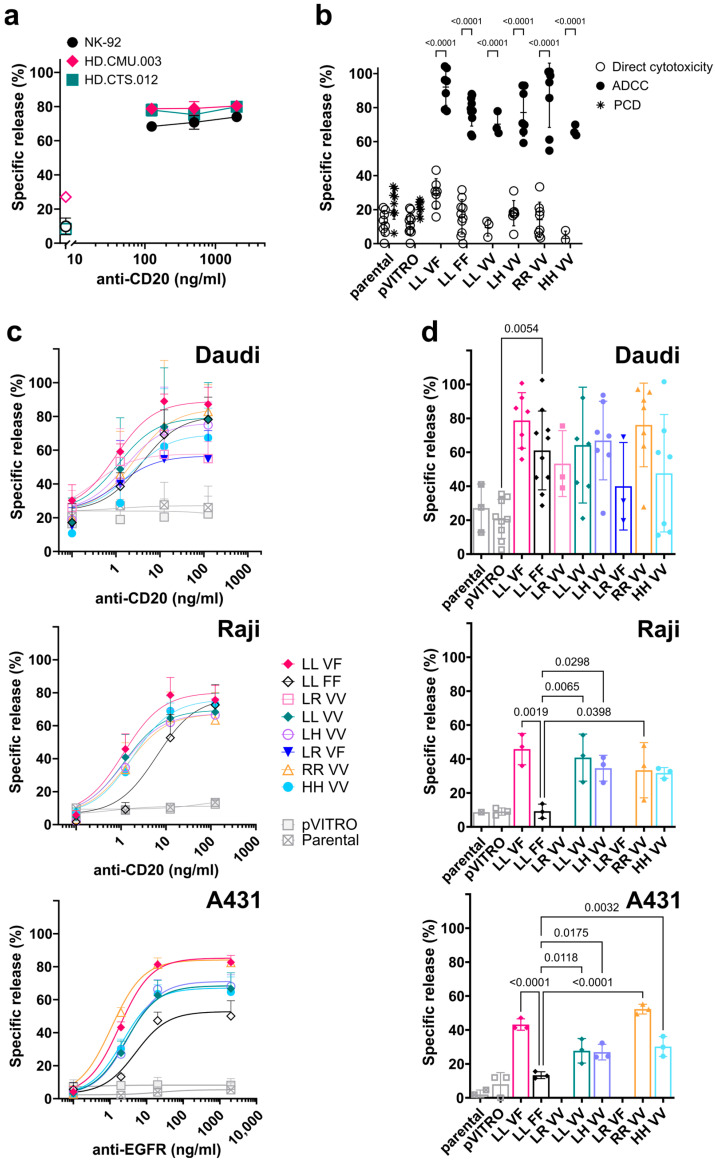
Natural killer (NK) cells play an important role in the surveillance of viral infections and cancer. NK cell antibody-dependent cellular cytotoxicity (ADCC) and direct cytotoxicity are mediated by the recognition of antibody-coated target cells through the Fc gamma receptor IIIA (FcγRIIIa/CD16) and by ligands of activating/inhibitory NK receptors, respectively. Allelic variants of the FCGR3A gene include the high-affinity single-nucleotide polymorphism (SNP) rs396991 (V176F), which is associated with the efficacy of monoclonal antibody (mAb) therapies, and the SNP rs10127939 (L66H/R). The contribution of FCGR3A SNPs to NK cell effector functions remains controversial; therefore, we generated a panel of eight NK-92 cell lines expressing specific combinations of these SNPs and tested their cytotoxicities. NK-92 cells were stably transfected with plasmids containing different combinations of FCGR3A SNPs. Messenger RNA and FcγRIIIa/CD16 cell surface expressions were detected using new generation sequencing (NGS) and flow cytometry, respectively. All FcγRIIIa/CD16-transfected NK-92 cell lines exhibited robust ADCC against three different target cell lines with minor differences. In addition, enhanced direct NK cytotoxicity against K562 target cells was observed, suggesting a mechanistic role of FcγRIIIa/CD16 in direct NK cytotoxicity. In conclusion, we generated eight FcγRIIIa/CD16-transfected NK-92 cell lines carrying different combinations of two of the most studied FCGR3A SNPs, representing the major genotypes described in the European population. The functional characterization of these cell lines revealed differences in ADCC and direct NK cytotoxicity that may have implications for the design of adoptive cancer immunotherapies using NK cells and tumor antigen-directed mAbs.

Keywords: ADCC; CD16; FCGR3A; L48H/R; L66H/R; NK-92; V158F; V176F.


Conflict of interest statement

The authors declare no conflicts of interest except for M.P. and G.L.P.Y., whose salaries were partially financed by CSL Behring. The funder had no role in the design of the study; in the collection, analyses, or interpretation of data; in the writing of the manuscript; or in the decision to publish the results.

Figures

Figure 1
Figure 1
Messenger expression and NGS of NK-92 transfectants for the rs10127939 and rs396991 SNPs. (a) Total RNA was extracted from NK-92 transfectants and converted into cDNA. The cDNA was then amplified for a 484 bp region covering both SNPs, rs10127939 and rs396991. The resulting amplicons were run in a 1.2% agarose gel and stained with RedGel. These 484 bp fragments were used for the NGS analysis. The gel includes controls for cDNA synthesis and PCR, specifically the “No amplification controls” (NAC) for NAC RT-PCR and NAC PCR, as well as a control without reverse transcriptase (no-RT PCR). (b) The pie charts show the NGS reads corresponding to rs10127939 (L66H/R) and rs396991 (V176F) for each of the NK-92 transfectants. The total number of reads is shown below each pie chart, with bases represented by color codes. For each SNP, a specific base read corresponds to amino acids: leucine (L), arginine (R), histidine (H), phenylalanine (P), and valine (V).
Figure 2
Figure 2
Surface expression of FcγRIIIa/CD16 on NK-92 transfectants using different anti-CD16 monoclonal antibody clones. Transfected NK-92 cell lines were tested for the surface expression of FcγRIIIa/CD16 using the mAb clones B73.1, 3G8, and MEM154 and matching isotype controls (grey), followed by flow cytometry analysis. (a) Schematic overview of the epitopes recognized by the anti-CD16 monoclonal antibody clones. These cover the different L66H/R and V176F variants of the FcγRIIIa/CD16 receptor located in domain 1 (D1) and domain 2 (D2), respectively. MEM154 only recognizes valine (V) at position 176 but not phenylalanine (F), whereas the clone B73.1 recognizes leucine (L) at position 66, binds poorly to arginine (R), but does not recognize histidine (H). In the case of clone 3G8, it recognizes a different epitope of D1, independent of the polymorphisms studied. (be) Representative histograms showing the recognition of FcγRIIIa/CD16 by the three clones. The L66H/R and V176F polymorphisms present in each cell line/donor are indicated next to the histograms, and the mean intensity ratio (MFIR) for each histogram is described in the upper-left corner. (b) The eight transfected cell lines (n = 10, except for NK-92 LL_VF, NK-92 LR_VV, and NK-92 LR_VF, where n = 13, 2, and 5). (c) Single determination for the level of expression of FcγRIIIa/CD16 for two of the most common variants in fresh PBMCs gated on CD3CD56+ NK cells are shown for donors HD.CMU.003 and HD.CMU.005. (d) Evaluation of FcγRIIIa/CD16 in the transduced cell line noGFP-CD16 176F NK-92.05 used as reference [49] (n = 3). (e) Transfection controls, including parental NK-92 and NK-92 pVITRO (n = 12 and 15, respectively). (f) Summary plots of FcγRIIIa/CD16 expression shown as MFIRs for the staining with anti-CD16 clones B731, 3G8, and MEM154 for all NK-92 cell lines (transfectants and transduced), including expression on fresh NK cells. One-way ANOVA (Brown–Forsythe and Welch) analysis for all cell lines except for human NK cells. (g) Time course of FcγRIIIa/CD16 expression as measured using 3G8 mAb FACS staining in six NK-92 transfectants over six months (80 passages), including a freeze/thaw cycle and cell sorting of the transfectants in January 2022 (arrow).
Figure 2
Figure 2
Surface expression of FcγRIIIa/CD16 on NK-92 transfectants using different anti-CD16 monoclonal antibody clones. Transfected NK-92 cell lines were tested for the surface expression of FcγRIIIa/CD16 using the mAb clones B73.1, 3G8, and MEM154 and matching isotype controls (grey), followed by flow cytometry analysis. (a) Schematic overview of the epitopes recognized by the anti-CD16 monoclonal antibody clones. These cover the different L66H/R and V176F variants of the FcγRIIIa/CD16 receptor located in domain 1 (D1) and domain 2 (D2), respectively. MEM154 only recognizes valine (V) at position 176 but not phenylalanine (F), whereas the clone B73.1 recognizes leucine (L) at position 66, binds poorly to arginine (R), but does not recognize histidine (H). In the case of clone 3G8, it recognizes a different epitope of D1, independent of the polymorphisms studied. (be) Representative histograms showing the recognition of FcγRIIIa/CD16 by the three clones. The L66H/R and V176F polymorphisms present in each cell line/donor are indicated next to the histograms, and the mean intensity ratio (MFIR) for each histogram is described in the upper-left corner. (b) The eight transfected cell lines (n = 10, except for NK-92 LL_VF, NK-92 LR_VV, and NK-92 LR_VF, where n = 13, 2, and 5). (c) Single determination for the level of expression of FcγRIIIa/CD16 for two of the most common variants in fresh PBMCs gated on CD3CD56+ NK cells are shown for donors HD.CMU.003 and HD.CMU.005. (d) Evaluation of FcγRIIIa/CD16 in the transduced cell line noGFP-CD16 176F NK-92.05 used as reference [49] (n = 3). (e) Transfection controls, including parental NK-92 and NK-92 pVITRO (n = 12 and 15, respectively). (f) Summary plots of FcγRIIIa/CD16 expression shown as MFIRs for the staining with anti-CD16 clones B731, 3G8, and MEM154 for all NK-92 cell lines (transfectants and transduced), including expression on fresh NK cells. One-way ANOVA (Brown–Forsythe and Welch) analysis for all cell lines except for human NK cells. (g) Time course of FcγRIIIa/CD16 expression as measured using 3G8 mAb FACS staining in six NK-92 transfectants over six months (80 passages), including a freeze/thaw cycle and cell sorting of the transfectants in January 2022 (arrow).
Figure 3
Figure 3
Interleukin-2 deprivation increased FcγRIIIa/CD16 expression on NK-92 transfectants. (a) Analysis of FcγRIIIa/CD16 expression using flow cytometry of the NK-92 cell lines stained with clone 3G8 after three days in culture with 100 IU/mL of IL2 (black circles) or IL2-deprived overnight (open circles) for six NK-92 transfectants. (b) Summary plot of the average of the mean fluorescence intensity ratio (MFIR) for each cell line analyzed under the two conditions previously described. In all cases, comparisons were made using a ratio-paired t-test, with n = 10. No values are shown if p ≥ 0.05. (c) Cell viability of NK-92 cell lines after short-term IL-2 deprivation. Different NK-92 cell lines, including both transfected and non-transfected cells, were cultured in the presence of IL-2 (100 IU/mL) or in the absence of IL-2 (0) for 16 h. Cell viability was analyzed using flow cytometry using the dead cell exclusion dye 7-AAD, and comparisons were made using a paired t-test, with n = 67.
Figure 4
Figure 4
Expression of surface antigen on target cells. (a) Representative histogram overlays for the expressions of CD20, EGFR, and MHC-I (HLA-ABC), conducted by indirect and direct antibody staining using the humanized anti-CD20 and -EGFR at 1.25 and 2 µg/mL, respectively, and the mouse anti-HLA-ABC at a saturation condition. The antigen expression in each cell line is indicated next to the histogram, and the mean intensity ratio (MFIR) for each histogram is described in the upper-left corner. Gray histograms correspond to isotype controls. (b) Pooled data (n = 3) of MFIRs with respect to target cell lines at three different primary antibody concentrations for anti-CD20 and -EGFR. (c) Pooled data (n = 3) for HLA-ABC and CD58 expressions in target cells used in the study. Each symbol represents an independent experiment.
Figure 5
Figure 5
All NK-92 transfectants expressing FcγRIIIa/CD16 variants perform ADCC against antibody-coated cells. ADCC assays were performed using either Daudi or Raji cells as targets opsonized with the anti-CD20 antibody at an effector-to-target ratio (E:T) of 5:1 or A431 cells with anti-EGFR antibody at an E:T ratio of 10:1. The non-radioactive cytotoxic assays lasted for one and two hours for anti-CD20 and anti-EGFR, respectively. The graphs show the percentage of specific release (%) mean ± SD versus anti-CD20 or anti-EGFR. (a) Comparison of ADCC between the NK-92 LL_VF transfectant cells (black circle), NK cells from healthy donors isolated from blood (HD.CMU.003, magenta diamond), and a buffy coat (HD.CTS.012, green square) used as effectors, and Daudi cells as targets opsonized with different concentrations of anti-CD20 antibody (125, 500, and 2000 ng/mL) at an E:T of 5:1 (one experiment per donor). Direct cytotoxicity controls (i.e., no antibody, open symbols) are included. (b) This panel compares the six NK-92 cell lines and NK-92 controls co-cultured with Daudi cells alone (direct cytotoxicity, white circle), together with 500 ng/mL of anti-CD20 (ADCC, black circles), or NK-92 controls (parental and pVITRO) with targets and anti-CD20 (programmed cell death, PCD, stars). (c) The summary plots display the mean ± SD of the specific release (%) for ADCC by different transfected NK-92 cell lines, shown for Daudi (top, n = 5), Raji (middle, n = 3), and A431 (bottom, n = 3). The ADCC dose-response curves were fitted using the dose-response curves for the agonist model, where the agonist was the mAb, anti-CD20 or -EGFR, and the EC50 was estimated accordingly. (d) ADCC was measured at non-saturating concentrations of anti-CD20 and -EGFR mAbs, corresponding to 1.25 ng/mL and 2 ng/mL, respectively. The targets used were Daudi (n = 3 to 10, upper), Raji (n = 3, middle), and A431 (n = 3, bottom). Data were analyzed using one-way ANOVA, and multiple comparisons were made against NK-92 LL_FF.
Figure 6
Figure 6
Direct cytotoxicity against K562 target cells by NK-92 transfectants expressing FcγRIIIa/CD16 variants. The direct cytotoxicity assay used K562 cells as the target. The cytotoxicity assay quantified the release of a non-radioactive compound resulting from the lysis/destruction of target cells over a two-hour period. NK-92 transfectants were cultured with 200 IU/mL of IL2 for two days and challenged with K562 at different effector-to-target (E:T) ratios. (a) Summary plots of specific release (%) are shown as the specific release mean ± SD of four independent experiments for each target cell line. Lytic units at 30% specific lysis (LU30) for 107 effector cells were obtained by fitting the plot of pooled data using an asymptote-modified exponential growth model. (b) This is a summary plot that compares the mean ± SD of the area under the curve (AUC) calculated from individual cytotoxicity assays for the eight transfectants, including the parental and NK-92 pVITRO control cell lines. A comparison was made between the mean of NK-92 parental and the remaining NK-92 transfectants using Dunnett’s T3 multiple comparisons test. Values are not shown if p ≥ 0.05.

Similar articles

Cited by

References

    1. Del Zotto G., Marcenaro E., Vacca P., Sivori S., Pende D., Della Chiesa M., Moretta F., Ingegnere T., Mingari M.C., Moretta A., et al. Markers and Function of Human Nk cells in Normal and Pathological Conditions. Cytom. Part B Clin. Cytom. 2017;92:100–114. doi: 10.1002/cyto.b.21508. - DOI - PubMed
    1. Krabbendam L., Bernink J.H., Spits H. Innate Lymphoid Cells: From Helper to Killer. Curr. Opin. Immunol. 2020;68:28–33. doi: 10.1016/j.coi.2020.08.007. - DOI - PubMed
    1. Seillet C., Brossay L., Vivier E. Natural Killers or Ilc1s? That is the Question. Curr. Opin. Immunol. 2020;68:48–53. doi: 10.1016/j.coi.2020.08.009. - DOI - PMC - PubMed
    1. Vivier E., Raulet D.H., Moretta A., Caligiuri M.A., Zitvogel L., Lanier L.L., Yokoyama W.M., Ugolini S. Innate or Adaptive Immunity? The Example of Natural Killer Cells. Science. 2011;331:44–49. doi: 10.1126/science.1198687. - DOI - PMC - PubMed
    1. Del Zotto G., Antonini F., Pesce S., Moretta F., Moretta L., Marcenaro E. Comprehensive Phenotyping of Human Pb Nk Cells by Flow Cytometry. Cytom. A. 2020;97:891–899. doi: 10.1002/cyto.a.24001. - DOI - PubMed

LinkOut - more resources