. 2024 Jul 1;13(3):22.
doi: 10.3390/biotech13030022.

A Machine Learning-Based Web Tool for the Severity Prediction of COVID-19

Affiliations

A Machine Learning-Based Web Tool for the Severity Prediction of COVID-19

Avgi Christodoulou et al. BioTech (Basel). .

Abstract

Predictive tools provide a unique opportunity to explain the observed differences in outcome between patients of the COVID-19 pandemic. The aim of this study was to associate individual demographic and clinical characteristics with disease severity in COVID-19 patients and to highlight the importance of machine learning (ML) in disease prognosis. The study enrolled 344 unvaccinated patients with confirmed SARS-CoV-2 infection. Data collected by integrating questionnaires and medical records were imported into various classification machine learning algorithms, and the algorithm and the hyperparameters with the greatest predictive ability were selected for use in a disease outcome prediction web tool. Of 111 independent features, age, sex, hypertension, obesity, and cancer comorbidity were found to be associated with severe COVID-19. Our prognostic tool can contribute to a successful therapeutic approach via personalized treatment. Although at the present time vaccination is not considered mandatory, this algorithm could encourage vulnerable groups to be vaccinated.

Keywords: SARS-CoV-2; age; cancer; hypertension; machine learning; obesity; severe COVID-19; sex.


Conflict of interest statement

The authors declare no conflicts of interest.

Figures

Figure 1
Figure 1
A general representation of the implemented pipeline. Nine different model families were evaluated using nested CV. Through the evaluation, the optimum model family is selected and the model is trained on the whole dataset to acquire the final model.
Figure 2
Figure 2
Nested CV pipeline. The nested CV is comprised of an outer-stratified 5-fold CV (test set and outer-train set splits) and an inner-stratified 3-fold CV (validation set and inner-train set splits). The dataset first is split into a test and an outer-train set. The train set is preprocessed and then used for MRMR feature selection. The parameters and the selected features are used to transform the test set. The outer-train set is then passed on to the inner CV where it is split into validation and inner-train sets. The inner CV is used for hyperparameter tuning and 100 trials/CVs are performed. We select the trial with the best validation score to use its selected hyperparameters. The model is then tuned with the selected hyperparameters and trained on the outer-train set. Finally, we evaluate the trained model using the test set and store the performance metrics. The procedure is performed for every fold of the outer CV and therefore we acquire 5 different metric values per nested CV round. The nested CV procedure is repeated 10 times to obtain 50 performance metric instances. The median and mean values of the metrics are calculated for the specific experiment.
Figure 3
Figure 3
Distribution of ages among the “Moderate” and “ICU” subgroups. A normal distribution curve (in blue) was calculated to fit each histogram.
Figure 4
Figure 4
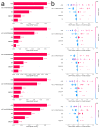
(a) Bar plots corresponding to each outer CV loop depicting the impact of the most influential features, in descending order, using absolute SHAP values. (b) Bee swarm plots corresponding to each outer CV loop depicting the impact of the most influential features, in descending order, using non-absolute SHAP values. Each point on the plot corresponds to one observation. The color scale represents the value of each variable for each observation. Negative values on the horizontal axis indicate a positive association of the feature with moderate COVID-19 prediction, while positive values indicate a positive association of the feature with severe COVID-19 prediction. For comorbidities, blue dots correspond to absence of the disease (0), whereas red dots correspond to the occurrence of disease (1). For sex, blue dots correspond to female (0) and red dots to male (1). Finally, age is depicted with a blue–red gradient (18–100 years old).
Figure 5
Figure 5
User interface of the COVID-19 severity prediction webtool.

References

    1. World Health Organization COVID-19 Deaths | WHO COVID-19 Dashboard. [(accessed on 27 January 2024)]. Available online: https://data.who.int/dashboards/covid19/deaths.
    1. Booth A.L., Abels E., McCaffrey P. Development of a prognostic model for mortality in COVID-19 infection using machine learning. Mod. Pathol. 2021;34:522–531. doi: 10.1038/s41379-020-00700-x. - DOI - PMC - PubMed
    1. Douville N.J., Douville C.B., Mentz G., Mathis M.R., Pancaro C., Tremper K.K., Engoren M. Clinically applicable approach for predicting mechanical ventilation in patients with COVID-19. Br. J. Anaesth. 2021;126:578–589. doi: 10.1016/j.bja.2020.11.034. - DOI - PMC - PubMed
    1. Schellekens P. Mapping Our Unvaccinated World. [(accessed on 28 January 2024)]. Available online: https://pandem-ic.com/mapping-our-unvaccinated-world/
    1. Cafiero C., Rosapepe F., Palmirotta R., Re A., Ottaiano M.P., Benincasa G., Perone R., Varriale E., D’Amato G., Cacciamani A., et al. Angiotensin System Polymorphisms’ in SARS-CoV-2 Positive Patients: Assessment Between Symptomatic and Asymptomatic Patients: A Pilot Study. Pharmgenomics Pers. Med. 2021;14:621–629. doi: 10.2147/PGPM.S303666. - DOI - PMC - PubMed

LinkOut - more resources