. 2024 Oct 1;12(10):1340-1360.
doi: 10.1158/2326-6066.CIR-23-0721.

Machine Learning-Directed Conversion of Glioblastoma Cells to Dendritic Cell-Like Antigen-Presenting Cells as Cancer Immunotherapy

Affiliations

Machine Learning-Directed Conversion of Glioblastoma Cells to Dendritic Cell-Like Antigen-Presenting Cells as Cancer Immunotherapy

Tianyi Liu et al. Cancer Immunol Res. .

Abstract

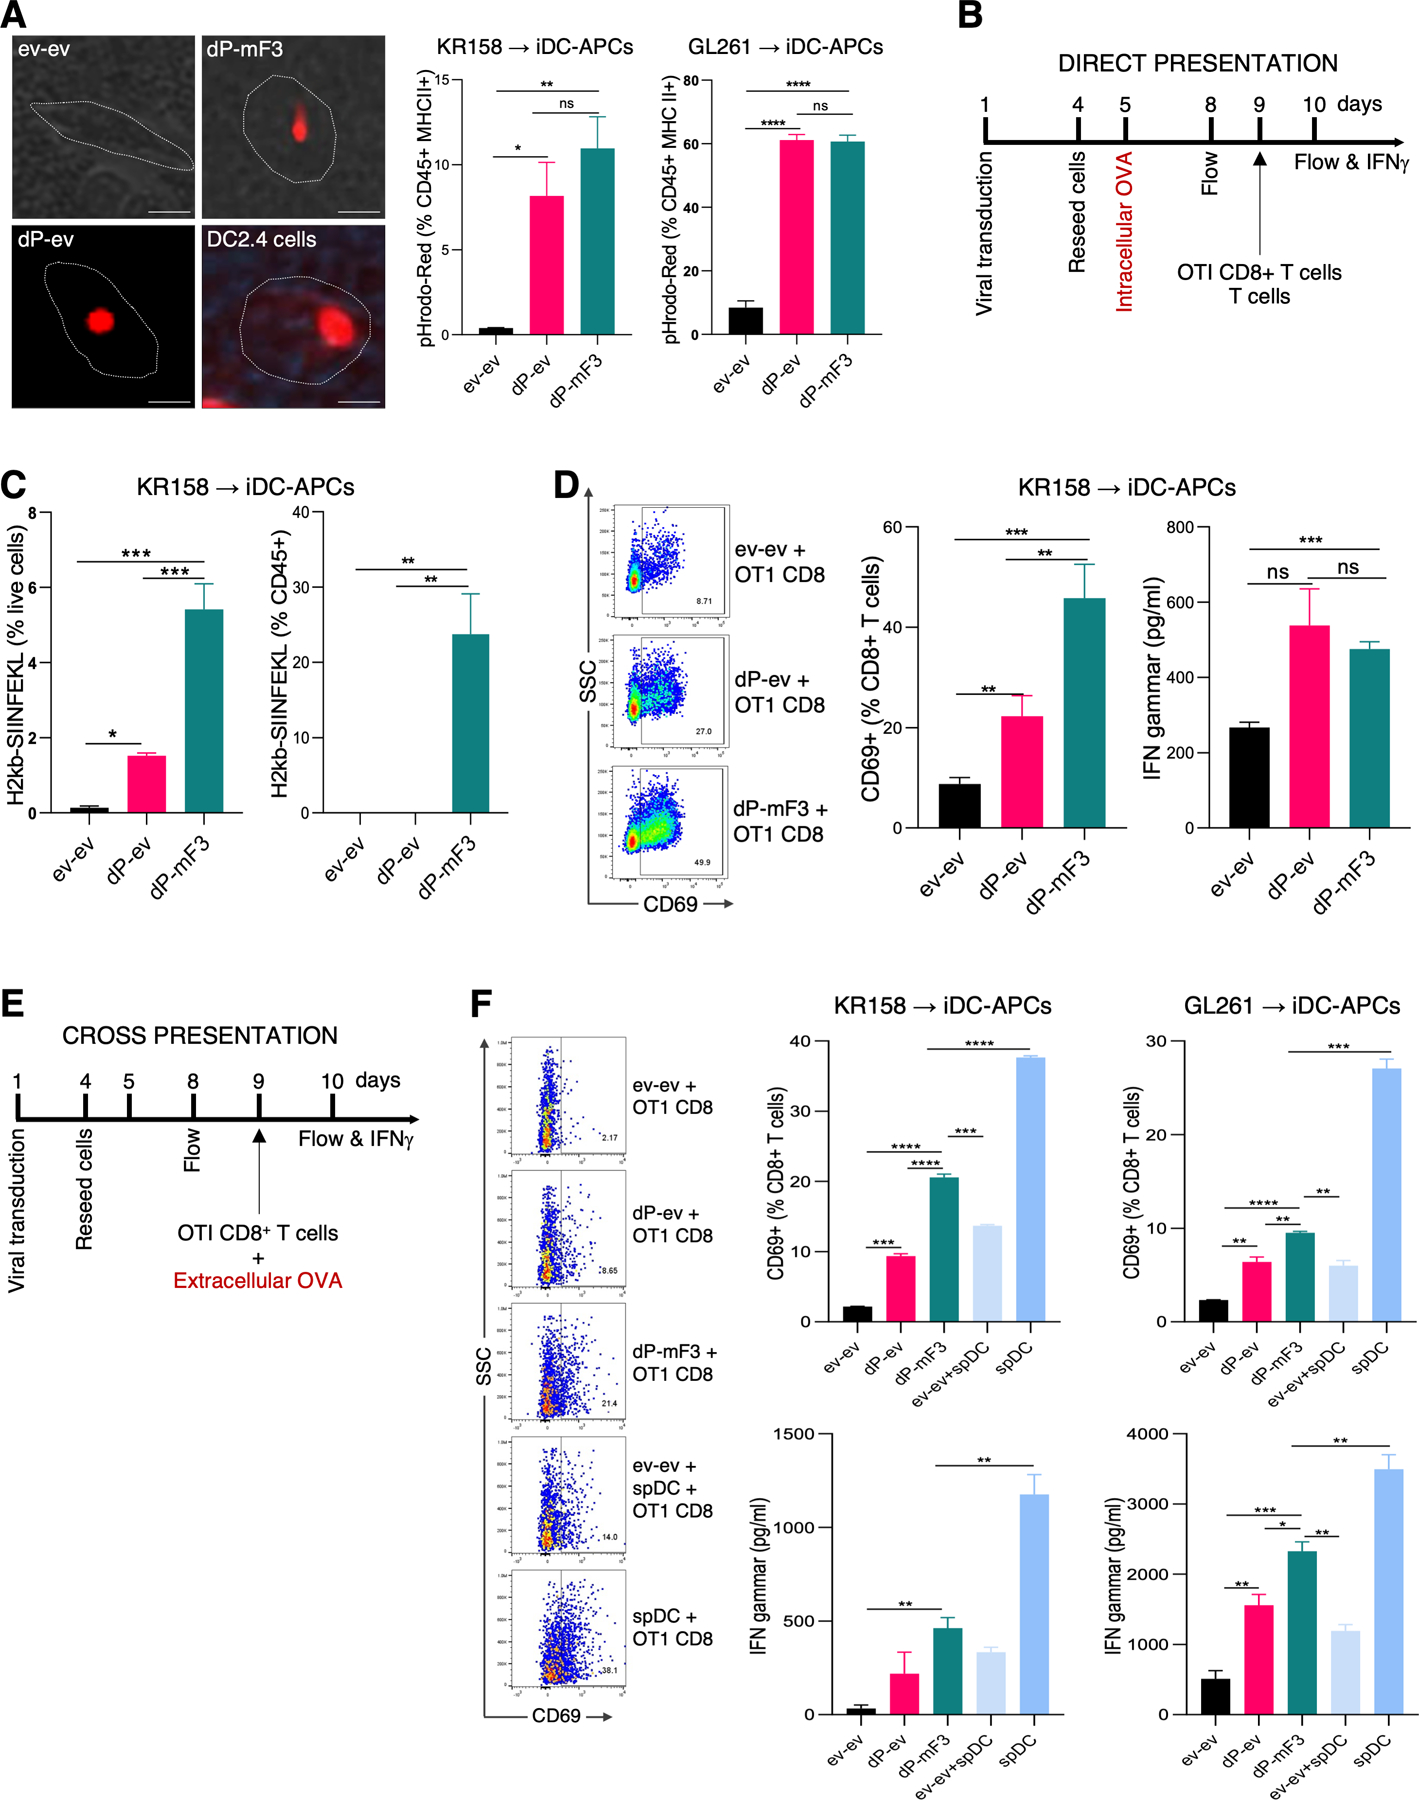
Immunotherapy has limited efficacy in glioblastoma (GBM) due to the blood-brain barrier and the immunosuppressed or "cold" tumor microenvironment (TME) of GBM, which is dominated by immune-inhibitory cells and depleted of CTL and dendritic cells (DC). Here, we report the development and application of a machine learning precision method to identify cell fate determinants (CFD) that specifically reprogram GBM cells into induced antigen-presenting cells with DC-like functions (iDC-APC). In murine GBM models, iDC-APCs acquired DC-like morphology, regulatory gene expression profile, and functions comparable to natural DCs. Among these acquired functions were phagocytosis, direct presentation of endogenous antigens, and cross-presentation of exogenous antigens. The latter endowed the iDC-APCs with the ability to prime naïve CD8+ CTLs, a hallmark DC function critical for antitumor immunity. Intratumor iDC-APCs reduced tumor growth and improved survival only in immunocompetent animals, which coincided with extensive infiltration of CD4+ T cells and activated CD8+ CTLs in the TME. The reactivated TME synergized with an intratumor soluble PD1 decoy immunotherapy and a DC-based GBM vaccine, resulting in robust killing of highly resistant GBM cells by tumor-specific CD8+ CTLs and significantly extended survival. Lastly, we defined a unique CFD combination specifically for the human GBM to iDC-APC conversion of both glioma stem-like cells and non-stem-like cell GBM cells, confirming the clinical utility of a computationally directed, tumor-specific conversion immunotherapy for GBM and potentially other solid tumors.


Conflict of interest statement

Conflicts of interest: D.D.T. and S.B.L. are inventors of 2 patent applications (62/952,725 and 62/586,655) based on the data in this manuscript. D.D.T. has received research grants and personal honoraria in support of unrelated research from Novocure, and research grants in support of unrelated research from Monteris, Sarepta, Merck, Lacerta, Novartis, Stemline, Northwest Biotech, and Tocagen. Other co-authors have declared no conflict of interest.

Figures

Figure 1:
Figure 1:. Conversion of murine GBM cells to iDC-APCs
A) tSNE 2D expression map of 3 murine GBM cell lines KR158, GL261 and CT2A, murine DCs, and other immune and non-immune cells, showing a direct vs indirect–via iPSCs and HSC–conversion of GBM to DCs. B) 2D image of a Gene-Rep-nSCORE-generated 1000-gene regulatory network for the conversion from murine GBM cells to iDC-APCs showing the top 10 ranked CFDs and the 4 large pathways regulating various aspects of the myeloid and APC states. C) Diagrams of the dP-ev and dP-mF3 lentiviral constructs (right) and radiographs of immunoblotting for expression of indicated CFD combinations in total lysates of KR158 cells. D) Surface expression of CD45, MHCII, CD80 and CD86 in KR158 and GL261 cells at days 7 and 9, respectively, after being transduced with indicated CFD combinations. Gate shown for CD45+MHCII+ is as a percentage of single, live cells. E) Phase contrast photographs of KR158 cells expressing the indicated CFD expression and the positive control mouse DC2.4 cells. Blue arrows denote dendrite-like membrane protrusions. Scale bar: 10μm. F) Representative histograms of MHCI expression (top) and bar graphs (bottom) of mean fluorescence intensity (MFI) of MHCI in KR158 and GL261 cells expressing the indicated CFD combinations. G) Bar graphs showing expression of the indicated key components of the antigen processing and presenting machinery and DC-associated cytokines in KR158 (top) and GL261 (bottom) cells expressing the indicated CFD combinations. H) Representative histograms (left) of the cytosolic CFSE dye intensity over 5 days and bar graphs (right) of the percentage of low proliferative cells (maximal CSFE intensity) in subpopulations of dP-mF3-expressing KR158 and GL261 cells. All experiments in triplicate were repeated at least 3 times. Data are represented as mean ± SEM. Analyses were performed using 2-way ANOVA. *, P <0.05; **, P <0.01; ***, P <0.001; ****, P <00001.
Figure 2:
Figure 2:. iDC-APCs share expression profile overlaps with murine cDCs.
A) scRNA-seq UMAP cluster maps at resolution 1 of sorted CD45+MHCII+ cells from KR158 GBM cells expressing dP-mF3 or dP-ev as compared to unsorted single cell ev-ev KR158 cells and enriched splenic cDCs in 2 clusters with overlapping markers for DCs and macrophages. 4T1 cells were used for batch effect normalization. Expression of indicated mRNAs of DC- and macrophage-specific genes is shown in both composite and split views of individual clusters. B) An expression heatmap of a 200 gene cluster in CD45+MHCII+ cells from dP-mF3 and dP-ev as compared to ev-ev controls and enriched cDCs. C) Expression heatmaps of 3 functional pathways in the DC state in CD45+MHCII+ cells from dP-mF3 and dP-ev as compared to ev-ev controls and enriched DCs.
Figure 3:
Figure 3:. Validation of DC-like properties of murine iDC-APCs
A) Representative fluorescence images and bar graphs of pHrodo-red particle phagocytosis in CD45+MHCII+ KR158 and GL261 cells expressing the indicated CFD combinations. DC2.4 cells serve as positive controls. Scale bar: 10μm. B) An assay diagram of direct presentation of OVA to OT1 CD8+ CTLs. C) Bar graphs of H2-Kb-SIINFEKL expression in KR158 cells expressing the indicated CFD combinations as a percentage of live (left) or CD45+ cells (right). D) Representative dot plots (left) and bar graphs of OT1 CD8+ T cell activation (right) as measured by CD69 and IFNγ expression through direct presentation of endogenous OVA by KR158 cells expressing the indicated CFD combinations. E) An assay diagram of cross presentation of exogenous OVA to OT1 CD8+ CTLs. F) Representative dot plots (left) and bar graphs of OT1 CD8+ T cell activation (right) as measured by CD69 and IFNγ expression through cross presentation of exogenous OVA by KR158 and GL261 cells expressing the indicated CFD combinations and by splenic DCs (spDCs) with or without pre-mixing with ev-ev controls at the same ratio of CD45+MHCII+ as in dP-mF3. All experiments in triplicate were repeated at least 3 times. Data are represented as mean ± SEM. Analyses were performed using 2-way ANOVA. *, P <0.05; **, P <0.01; ***, P <0.001; ****, P <00001.
Figure 4:
Figure 4:. Intra-tumor iDC-APCs reactivate the cold TME of murine GBM tumors.
A) A schema detailing the intra-tumor iDC-APC reprograming in immunosuppressed NSG and immunocompetent C57BL/6J hosts. (B-E) Anti-tumor effects of intra-tumor iDC-APCs in KR158-luc cells is dependent on adaptive immunity: Representative photographs and dot plots showing orthotopic growth by BLI of GBM expressing the indicated CFD combinations in NSG (B) and C57BL/6J (C) hosts; n=10 per group; Kaplan-Meier estimates showing survival rates after implantation in NSG (D) and C57BL/6J (E) hosts. Two-way ANOVA was used to compare tumor size differences and a log-rank test to compare survival rates. *, P <0.05; **, P <0.01; ***, P <0.001; ns: not significant. F-L) iDC-APCs reheat the cold TME of GBM: The immune TME of the indicated reprogrammed tumors are summarized in an expression heatmap of a 24-immune gene profile by qRT-PCR (n=5 per cohort) (F) and representative images of immunofluorescence and bar graphs of the mean numbers (yellow arrows) per 20x field of CD11c+CLEC9A+ cDC1 (G), F4/80+ macrophages (H), CD3+CD4+ T cells (I), CD3+CD8+ CTLs (J), GZMB+CD8+ CTLs (K), and CD25+CD8+ CTLs (L) with DAPI counterstain. 3–5 independent slides were used for enumeration. Scale bar: 50μm. Data are represented as mean ± SEM. Two-way ANOVA was used to compare immune TME profile and IF image difference. ****, P <00001.
Figure 5:
Figure 5:. GBM reprograming synergizes with an intra-tumor soluble PD-1 decoy (sPD-1).
A) A schematic of the sPD-1 and the negative control (NC) constructs. The NC construct lacks the PD-L1 binding motif in the IgV sequence. B) Representative immunoblots of his-tagged sPD-1 and NC proteins in supernatants of KR158 GBM cells co-transfected with dP-mF3 and sPD-1 or NC. Only sPD-1 is detectable by the anti-PD-1 mAb RMPI-14 specific for the PD-L1 binding motif absent in NC. C-F) A schema detailing the combination of dP-mF3-reprogrammed KR158 GBM and intra-tumor sPD-1 (C), specifically creating a therapeutic synergy that delayed tumor growth as measured by BLI (D) and quantified in a line graph (E), and significantly extended survival as measured by Kaplan-Meier estimates (F). N=10 per group. Log-rank test was used to compare survival rates. *, P <0.05; **, P <0.01; ****, P <0.0001; ns: not significant.
Figure 6:
Figure 6:. GBM reprograming synergizes with a DC-based tumor vaccine (DC Vax).
A-C) A schema details the ex vivo production of purified KR158-specific CTLs following a KR158 RNA-pulsed DC vaccine to assess cytotoxic synergy with reprogrammed KR158 target cells (A); Bar graphs showing CD69 and IFNγ expression of KR158-specific CD8+ and CD4+ T cells and KR158-specific cytotoxicity measured by apoptotic (surface Annexin V binding) and residual live tumor cells as percentages of live CD45 cells in co-cultures of increasing ratios (E:T) of CTL effectors (E) to targets (T) expressing the indicated CFD combinations at 1:10 (B) and 1:1 (C). All experiments in triplicate were repeated at least 3 times. Data are represented as mean ± SEM. Analyses were performed using 2-way ANOVA. *, P <0.05; **, P <0.01; ***, P <0.001; ****, P <00001. ns: not significant. (D-F) A schema details the combination of reprogrammed KR158 GBM and a KR158 RNA-based DC vaccine (D), demonstrating a specific synergy between the DC Vax and dP-mF3-reprogrammed TME in delaying tumor growth as measured by BLI (E) and extending survival as measured by Kaplan-Meier estimates (F). 25% of the maximal dP-mF3-reprogrammed TME condition was sufficient to create a synergy with the DC Vax in delaying tumor growth (G) and extending survival (H). N=10 per group. Log-rank test was used to compare survival rates. *, P <0.05; **, P <0.01; ****, P <0.0001; ns: not significant.
Figure 7:
Figure 7:. Conversion of human GBM cells to iDC-APCs by PU.1 plus IKZF1 (PI)
A) A 2D image of a 300 gene regulatory network for the conversion from human GBM cells to iDC-APCs showing the top 10 ranked CFDs and the 3 large pathways regulating various aspects of the myeloid and DC states. B-H) Surface expression of CD45, MHCII, CD80 and CD86 (B) and bar graphs showing frequency of CD45+ (C), CD45+MHCII+ (D), CD11c+ (E), CD86+ (F), CD80+ (G), and MHCI+ (H) cells in the 4 indicated human GBM cell lines at days 7–9 after being transduced with the indicated CFD combinations. PI= PU.1/IKZF1; PIIr= PU.1/IKZF1/IRF4; PIC= PU.1/IKZF1/CEBPD; hF6= PU.1/IKZF1/IRF4/CEBPD/CTSZ/MITF. I) Bar graphs showing frequency of CD45+, CD45+MHCII+, CD80+, CD86+, and MHCI+ cells in the 3 independent human GSC lines at days 7 after being transduced with the indicated CFD combinations.

References

    1. Robert C A decade of immune-checkpoint inhibitors in cancer therapy. Nature Communications. 2020;11(1):3801. - PMC - PubMed
    1. Korman AJ, Garrett-Thomson SC, Lonberg N. The foundations of immune checkpoint blockade and the ipilimumab approval decennial. Nature Reviews Drug Discovery. 2022;21(7):509–28. - PubMed
    1. Medikonda R, Dunn G, Rahman M, Fecci P, Lim M. A review of glioblastoma immunotherapy. J Neurooncol 2021;151(1):41–53. - PubMed
    1. Quail DF, Joyce JA. The Microenvironmental Landscape of Brain Tumors. Cancer Cell. 2017;31(3):326–41. - PMC - PubMed
    1. Hegde S, Krisnawan VE, Herzog BH, Zuo C, Breden MA, Knolhoff BL, et al. Dendritic Cell Paucity Leads to Dysfunctional Immune Surveillance in Pancreatic Cancer. Cancer Cell. 2020;37(3):289–307.e9. - PMC - PubMed