. 2024 Sep 3;79(9):2317-2326.
doi: 10.1093/jac/dkae230.

Bayesian estimation of the prevalence of antimicrobial resistance: a mathematical modelling study

Affiliations

Bayesian estimation of the prevalence of antimicrobial resistance: a mathematical modelling study

Alex Howard et al. J Antimicrob Chemother. .

Abstract

Background: Estimates of the prevalence of antimicrobial resistance (AMR) underpin effective antimicrobial stewardship, infection prevention and control, and optimal deployment of antimicrobial agents. Typically, the prevalence of AMR is determined from real-world antimicrobial susceptibility data that are time delimited, sparse, and often biased, potentially resulting in harmful and wasteful decision-making. Frequentist methods are resource intensive because they rely on large datasets.

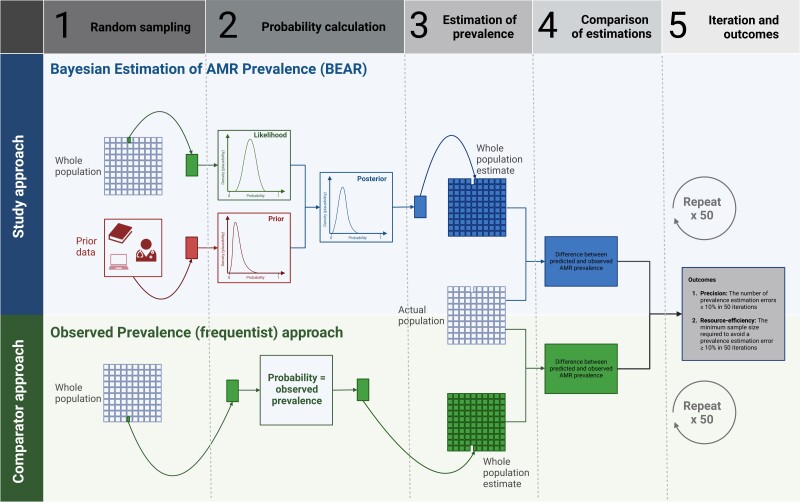
Objectives: To determine whether a Bayesian approach could present a more reliable and more resource-efficient way to estimate population prevalence of AMR than traditional frequentist methods.

Methods: Retrospectively collected, open-source, real-world pseudonymized healthcare data were used to develop a Bayesian approach for estimating the prevalence of AMR by combination with prior AMR information from a contextualized review of literature. Iterative random sampling and cross-validation were used to assess the predictive accuracy and potential resource efficiency of the Bayesian approach compared with a standard frequentist approach.

Results: Bayesian estimation of AMR prevalence made fewer extreme estimation errors than a frequentist estimation approach [n = 74 (6.4%) versus n = 136 (11.8%)] and required fewer observed antimicrobial susceptibility results per pathogen on average [mean = 28.8 (SD = 22.1) versus mean = 34.4 (SD = 30.1)] to avoid any extreme estimation errors in 50 iterations of the cross-validation. The Bayesian approach was maximally effective and efficient for drug-pathogen combinations where the actual prevalence of resistance was not close to 0% or 100%.

Conclusions: Bayesian estimation of the prevalence of AMR could provide a simple, resource-efficient approach to better inform population infection management where uncertainty about AMR prevalence is high.


Figures

Figure 1.
Figure 1.
The problem with established practice in making population infection management decisions based on observed prevalence alone in biased subsets of data. The Bayesian solution is to incorporate prior data with targeted testing to improve predictions, while the frequentist solution necessitates expending additional resource to test a wider targeted population. This figure appears in colour in the online version of JAC and in black and white in the print version of JAC.
Figure 2.
Figure 2.
Parallel algorithm workflows for Bayesian and observed prevalence AMR estimation/validation. For each approach, 20 antimicrobial susceptibility results were sampled at random, then AMR prevalence was estimated in the remaining results. The differences between predicted and actual observed AMR prevalence were calculated for each approach, then the precision and resource efficiency of each approach were compared with descriptive statistics. This figure appears in colour in the online version of JAC and in black and white in the print version of JAC.
Figure 3.
Figure 3.
An example output of the BEAR approach for ampicillin/sulbactam resistance in E. coli, from two random samples of 20 specimens in the study dataset. The prior (red curve, left-hand graphs) reflects our belief that we think the prevalence of resistance is likely to be less than 50%, but not very rare, based on the prevalence of ampicillin/sulbactam resistance in inpatient and outpatient epidemiological studies in the USA—the mode of the prior is therefore around 0.25. The likelihood (green curve, left-hand graphs) reflects the prevalence of resistance that has been observed in the 20 sampled results—making an estimate based on the data alone would result in almost a 30% swing in the estimate depending on whether the top sample (observed prevalence ∼10%) or the bottom sample (observed prevalence ∼40%) had been used to make the estimate. Combining the prior and the likelihood results in the posterior (blue curve, left-hand graphs), which reflects our Bayesian estimate of AMR prevalence in the dataset—the anchoring effect of the prior prevents the posterior (the blue curve in the left-hand plots) from overfitting to each sample, significantly reducing the amount of swing in estimate between samples. The right-hand graphs show differences in the resulting predictions in the population context—the Bayesian approach limits the swing of estimates between samples to around 7000 for a population of 34 617, anchoring the estimate closer to the actual whole population prevalence of 8141. Using the observed data alone would have resulted in a swing of around 10 000, and a less accurate estimate in both cases.
Figure 4.
Figure 4.
Box plot displaying distribution of AMR estimation errors incurred during cross-validation using BEAR and the frequentist observed prevalence approach. BEAR resulted in fewer errors ≥10% and fewer errors ≥20% than the observed prevalence approach. This figure appears in colour in the online version of JAC and in black and white in the print version of JAC.
Figure 5.
Figure 5.
The minimum number of antimicrobial susceptibility results per drug–pathogen combination that were needed to avoid any extreme (≥10%) AMR prevalence estimation errors in 50 cross-validation iterations of BEAR and the estimation using observed prevalence (EOP) approach. This figure appears in colour in the online version of JAC and in black and white in the print version of JAC.

References

    1. Naylor NR, Atun R, Zhu Net al. . Estimating the burden of antimicrobial resistance: a systematic literature review. Antimicrob Resist Infect Control 2018; 7: 58. 10.1186/s13756-018-0336-y - DOI - PMC - PubMed
    1. Tacconelli E. Linking infection control to clinical management of infections to overcome antimicrobial resistance. J Hosp Infect 2021; 114: 1–9. 10.1016/j.jhin.2021.04.030 - DOI - PubMed
    1. Rempel O, Pitout JD, Laupland KB. Antimicrobial resistance surveillance systems: are potential biases taken into account? Can J Infect Dis Med Microbiol 2011; 22: e24–8. 10.1155/2011/276017 - DOI - PMC - PubMed
    1. van Leth F, Schultsz C. Unbiased antimicrobial resistance prevalence estimates through population-based surveillance. Clin Microbiol Infect 2023; 29: 429–33. 10.1016/j.cmi.2022.05.006 - DOI - PubMed
    1. Tipping ME. Bayesian Inference: an introduction to principles and practice in machine learning. In: Bousquet O, von Luxburg U, Rätsch G, eds. Advanced Lectures on Machine Learning: ML 2003. Lecture Notes in Computer Science (vol 3176). Springer, 2004; 41–62.

Publication types

Substances