. 2024 Sep 13;30(18):4179-4189.
doi: 10.1158/1078-0432.CCR-24-1097.

CDK9 Inhibition by Dinaciclib Is a Therapeutic Vulnerability in Epithelioid Hemangioendothelioma

Affiliations

CDK9 Inhibition by Dinaciclib Is a Therapeutic Vulnerability in Epithelioid Hemangioendothelioma

Ajaybabu V Pobbati et al. Clin Cancer Res. .

Abstract

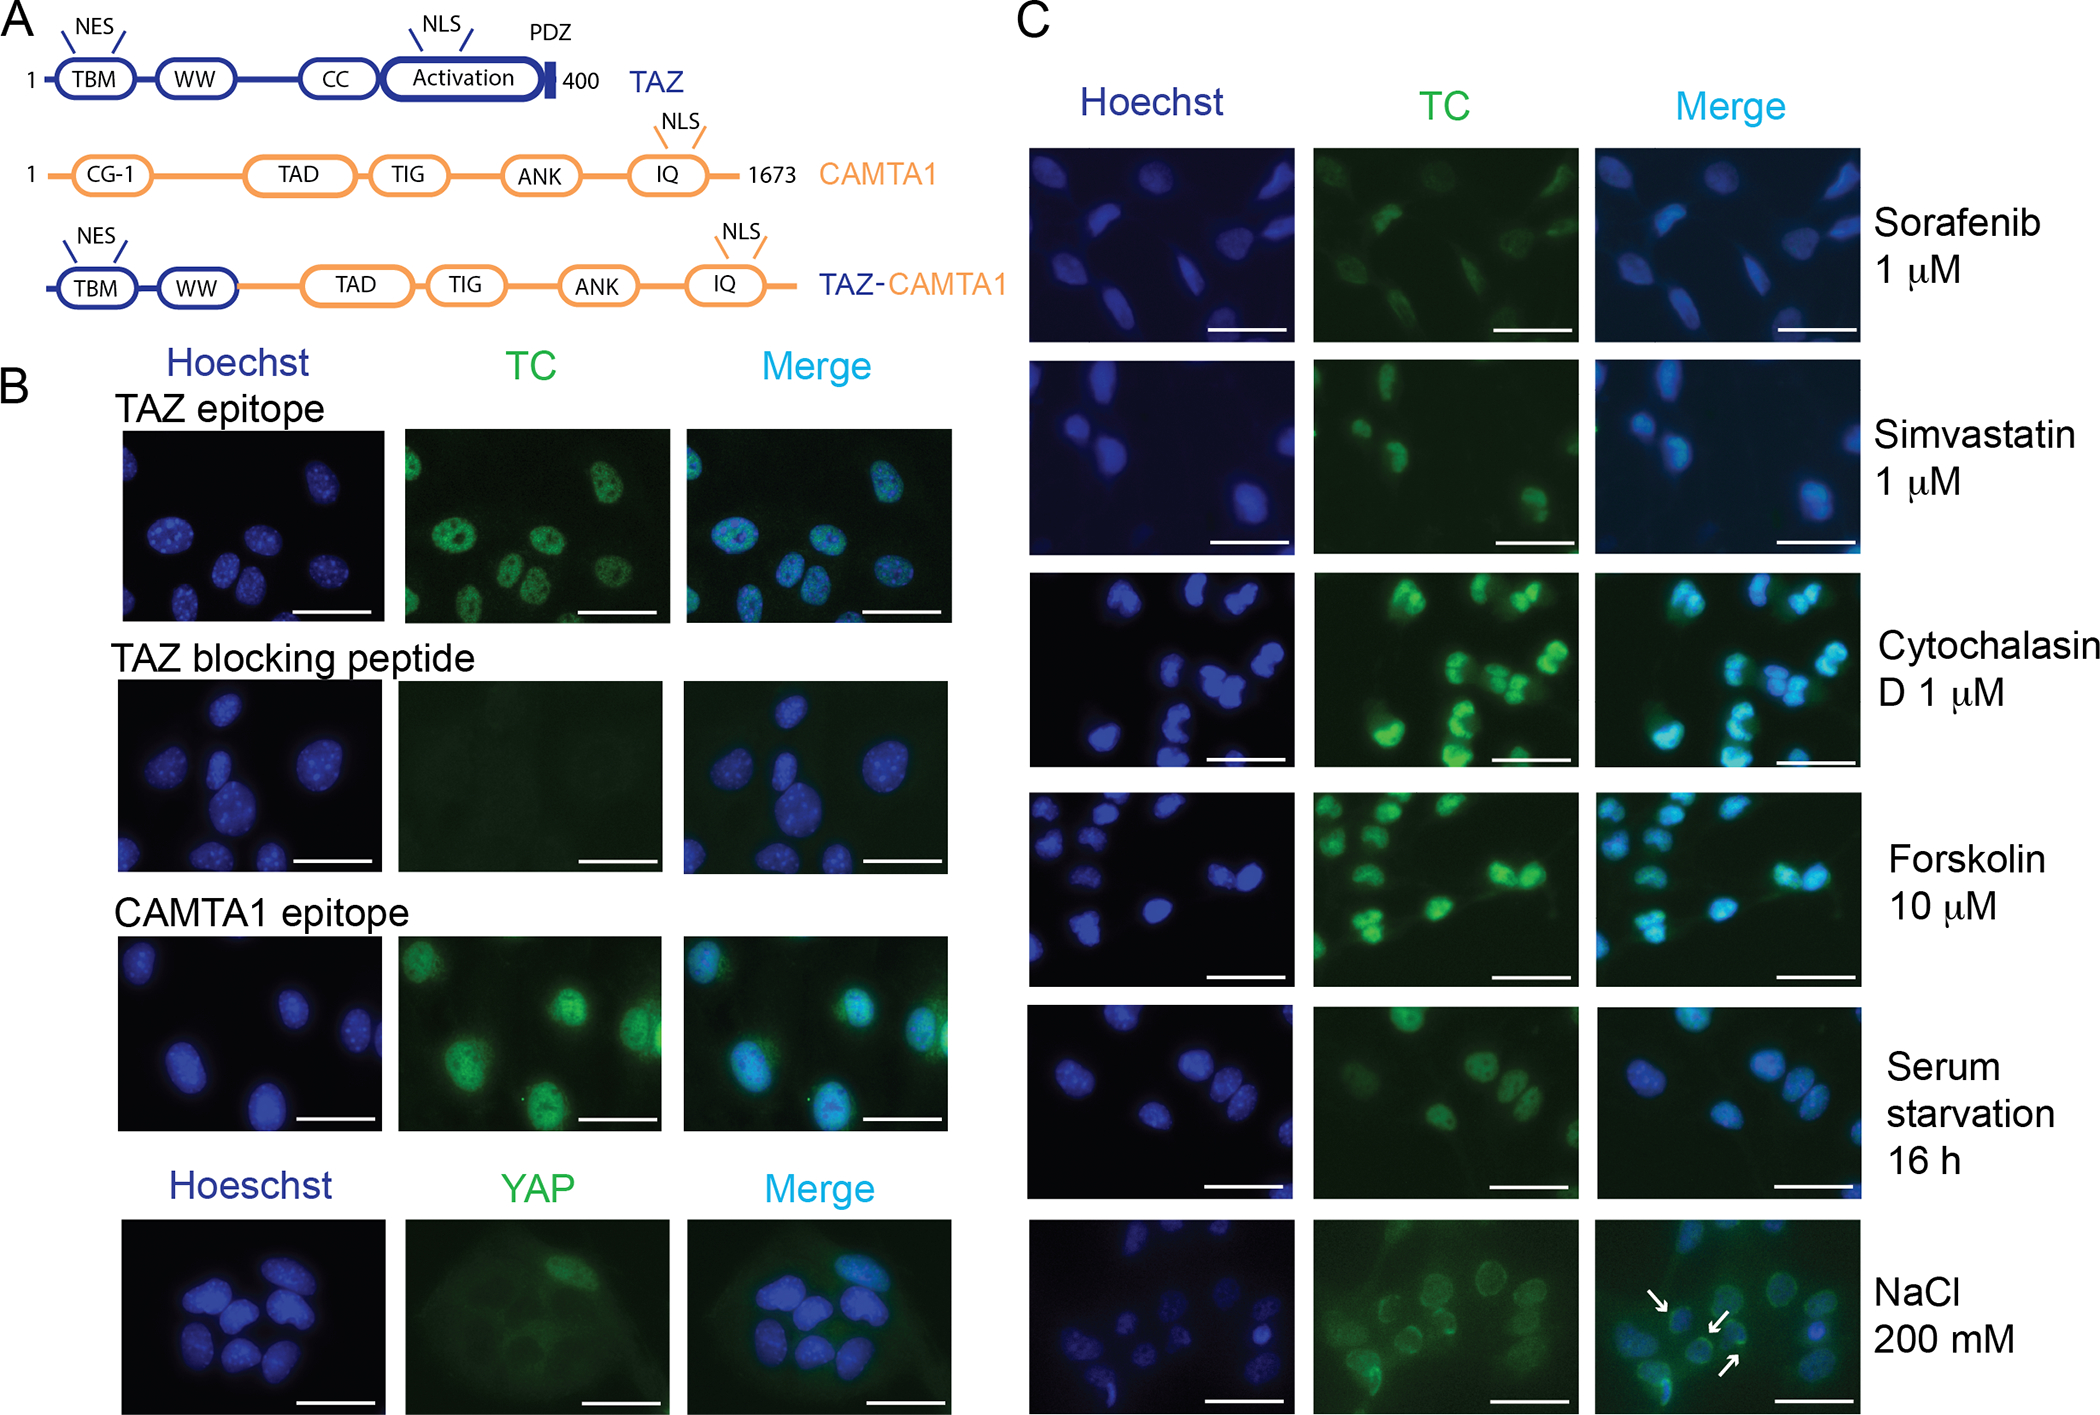
Purpose: There are no effective treatment options for patients with aggressive epithelioid hemangioendothelioma (EHE) driven by the TAZ-CAMTA1 (TC) fusion gene. Here, we aimed to understand the regulation of TC using pharmacologic tools and identify vulnerabilities that can potentially be exploited for the treatment of EHE.

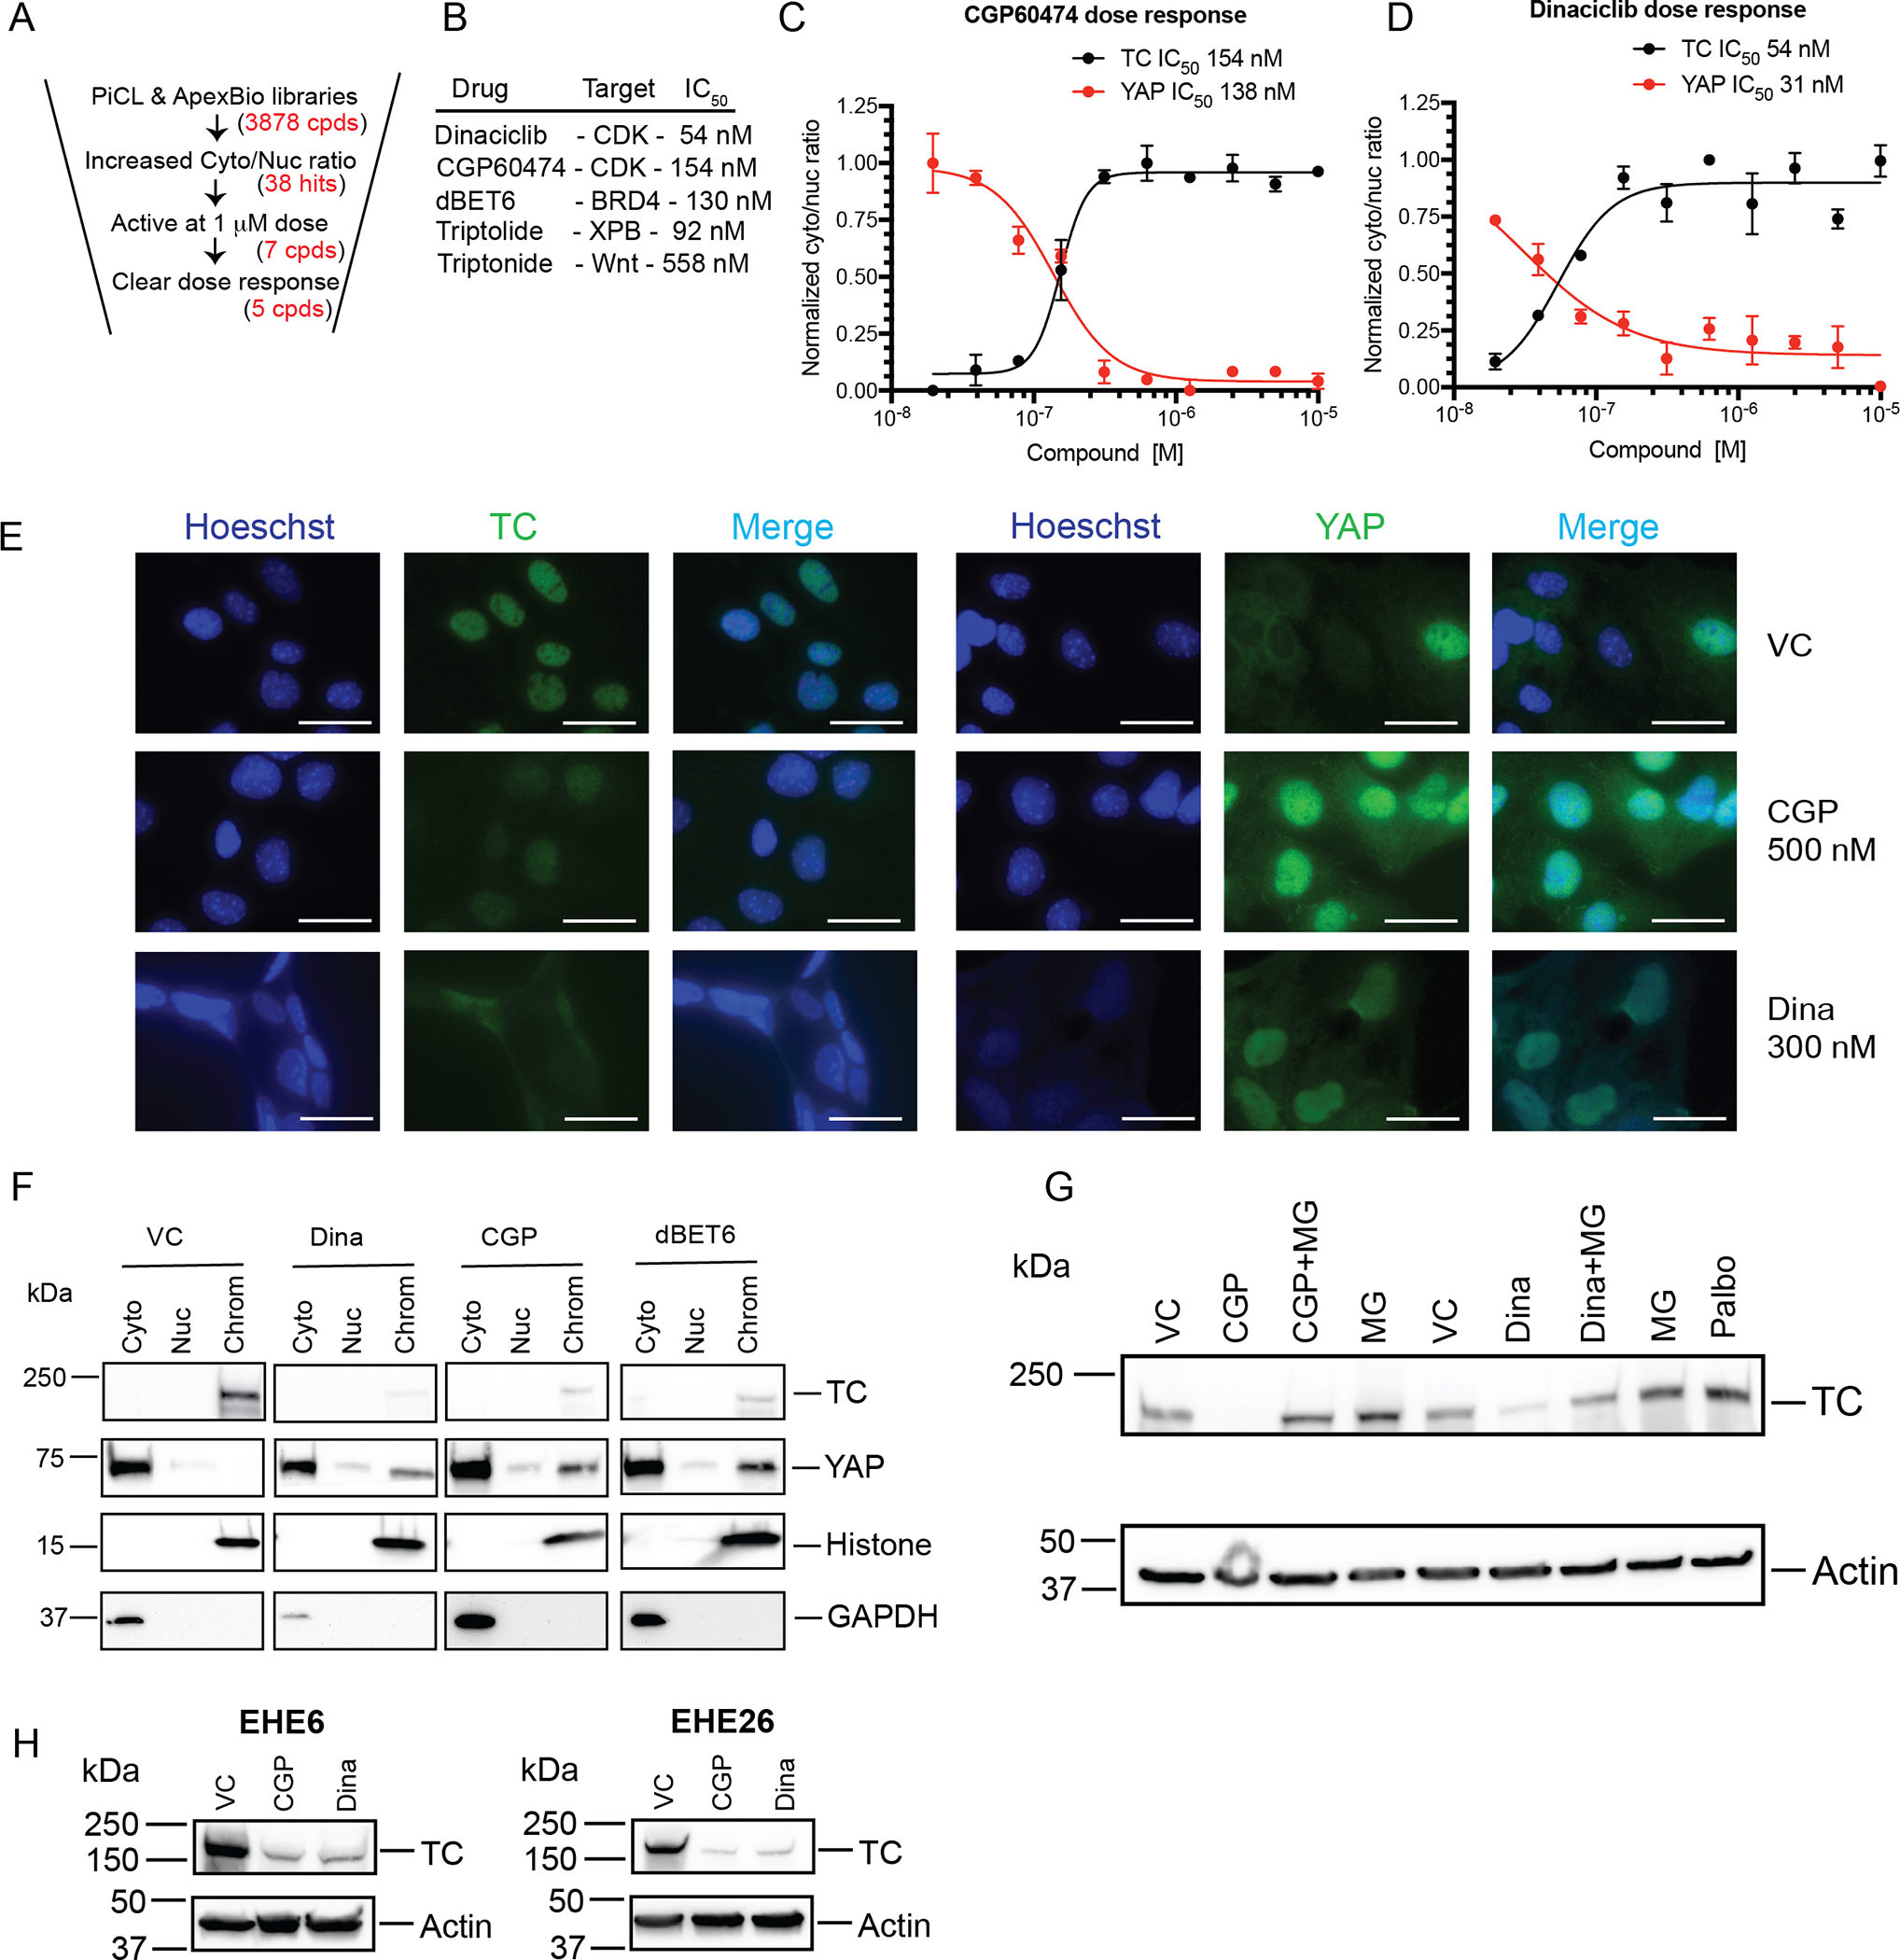
Experimental design: TC is a transcriptional coregulator; we hypothesized that compounds that reduce TC nuclear levels, either through translocation of TC to the cytoplasm, or through degradation, would render TC less oncogenic. TC localization was monitored using immunofluorescence in an EHE tumor cell line. Two target-selective libraries were used to identify small molecules that reduce TC localization in the nucleus. The ability of the shortlisted hits to affect cell viability, apoptosis, and tumorigenesis was also evaluated.

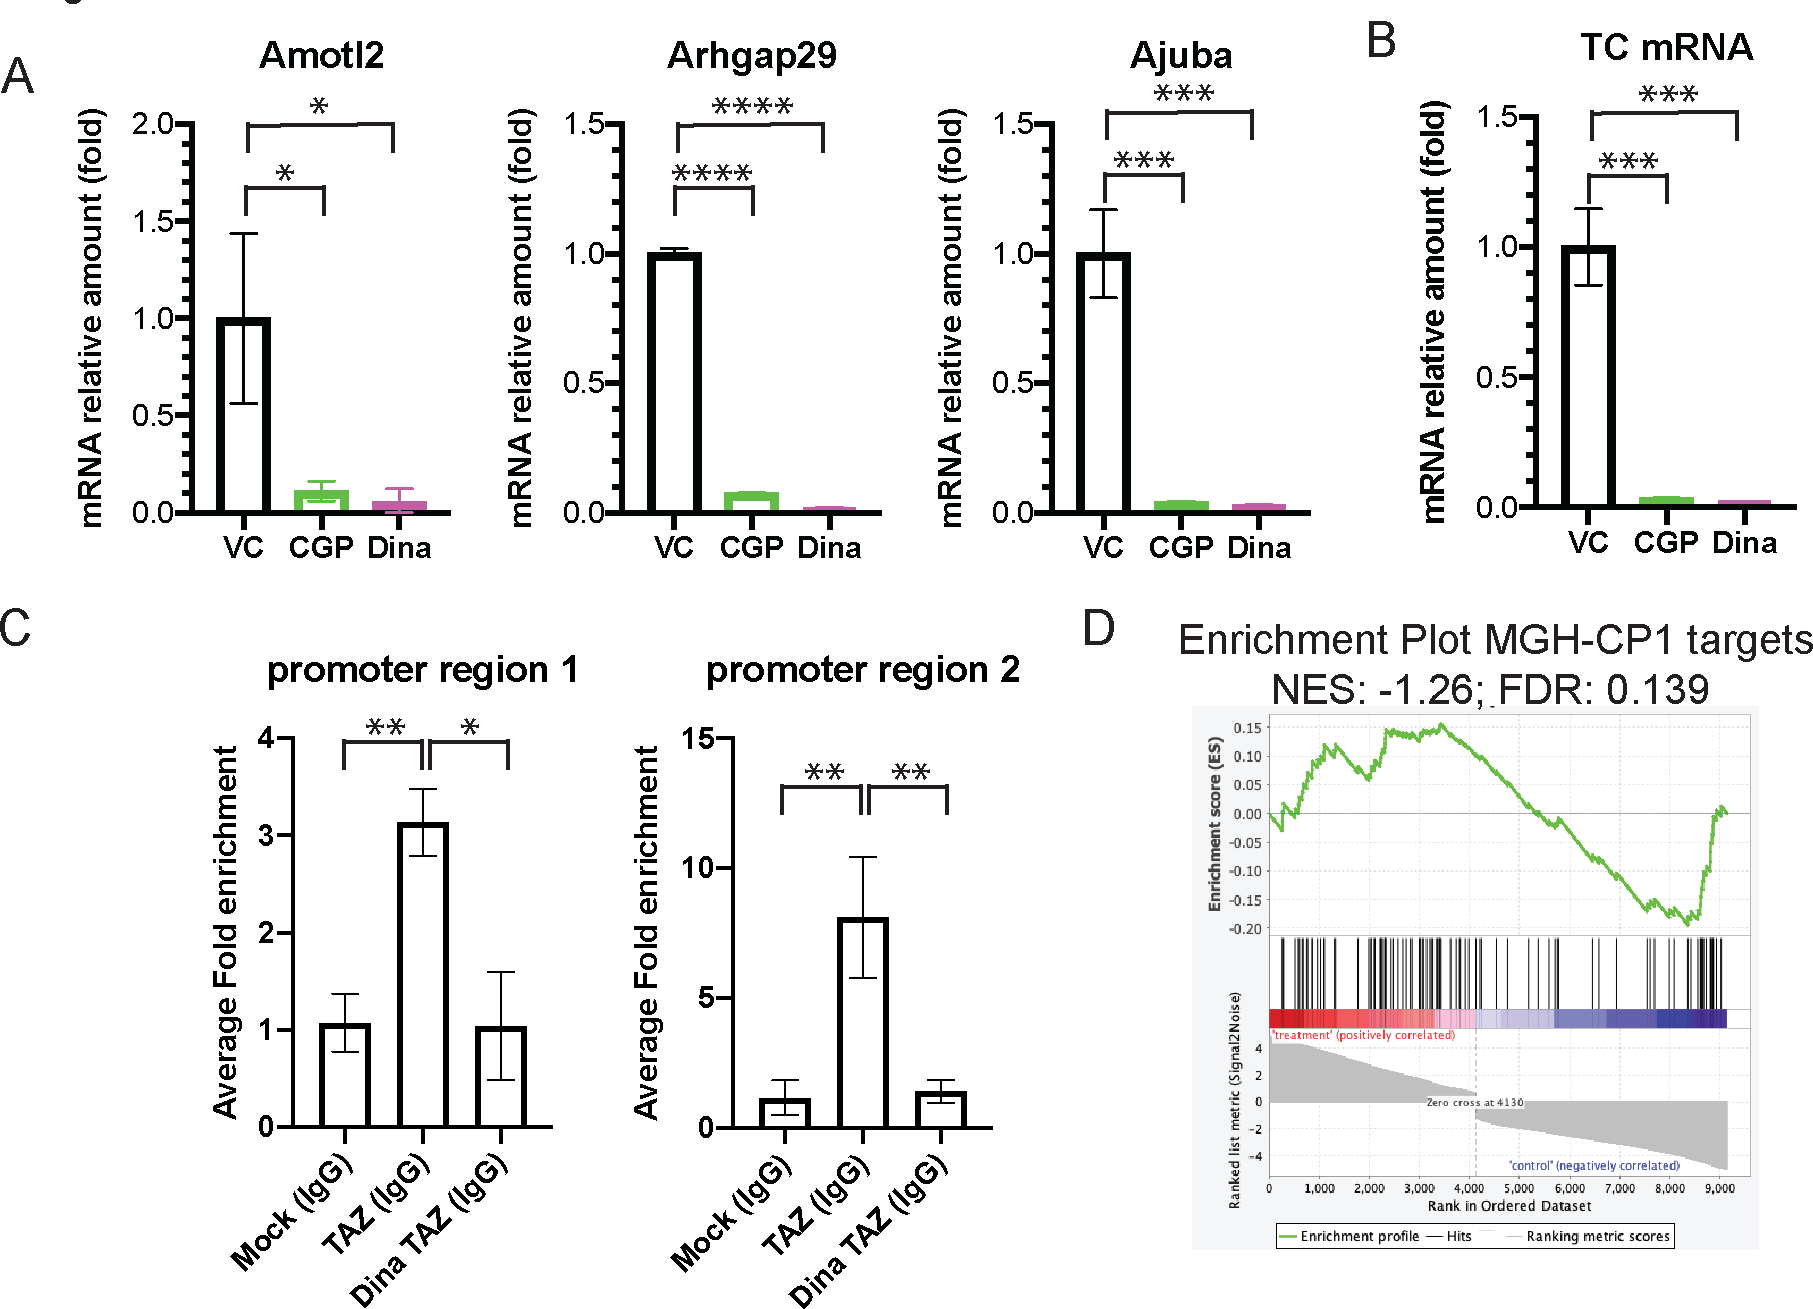
Results: Basal TC remained "immobile" in the nucleus; administration of cyclin-dependent kinase (CDK) inhibitors such as CGP60474 and dinaciclib (Dina) mobilized TC. "Mobile" TC shuttled between the nucleus and cytoplasm; however, it was eventually degraded through proteasomes. This dramatically suppressed the levels of TC-regulated transcripts and cell viability, promoted apoptosis, and reduced the area of metastatic lesions in the allograft model of EHE. We specifically identified that the inhibition of CDK9, a transcriptional CDK, destabilizes TC.

Conclusions: The CDK inhibitor Dina exhibited antitumorigenic properties both in vitro and in vivo in EHE models. Dina has been rigorously tested in clinical trials and displayed an acceptable toxicity profile. Therefore, there is a potential therapeutic window for repurposing Dina for the treatment of EHE.


Conflict of interest statement

Conflict of Interest: The authors declare no potential conflicts of interest.

Figures

Figure 1.
Figure 1.. Known YAP/TAZ inhibitors do not alter TC localization
A. Domain architecture of TAZ, CAMTA1, and the TAZ-CAMTA1 (TC) fusion protein. Domain names are listed, other abbreviations include TBM – TEAD binding motif, NES – nuclear export signal, CC – coiled-coil, NLS – nuclear localization signal, TAD – transactivation domain, and ANK – ankyrin repeats. B. Immunofluorescence (IF) staining to detect the localization of TC or YAP in EHE17 cells. Hoechst dye was used to stain nuclei. Scale Bars – 25 μm. C. TC localization was monitored using IF after treating EHE17 cells with the indicated compounds. Arrows in NaCl treatment show perinuclear staining of TC. Scale Bars – 25 μm. Representative results are shown and the experiments were repeated 3 – 5 times yielding similar results.
Figure 2.
Figure 2.. Identification of small molecules that reduce TC nuclear levels
A. Screening funnel displaying the rationale used to shortlist the small molecules that alter the cytoplasm/nucleus ratio of TC. B. The five compounds that caused a dose-dependent increase in the cytoplasm/nucleus ratio, their targets, and their IC50 values in the phenotypic screen are listed. The endogenous amounts of YAP and TC localized in the cytoplasm and nucleus were determined via IF using specific monoclonal antibodies and their cytoplasm/nucleus intensity ratios were plotted at various drug doses C. CGP60474 and D. Dinaciclib. Error bars represent SEM, n = 2 biological duplicates. E. Representative IF images showing the localization of TC and YAP after treatment of EHE17 cells with vehicle control (VC) or CDK inhibitors CGP60474 (CGP) and dinaciclib (Dina), N = 3 independent experiments. Scale Bar – 25 μm. F. Immunoblots to determine the protein levels of TC and YAP after subcellular fractionation following VC, Dina, CGP, or dBET6 treatment. Antibodies against histone and GAPDH were used to evaluate the purity of the chromatin and cytoplasmic fractions, respectively. G. Immunoblots were used to evaluate whether TC protein levels can be stabilized by inhibiting proteasomal degradation via MG-132 (MG) treatment. H. Immunoblots to detect TC protein levels after treatment with CGP and Dina in EHE6 and EHE26 cells. All immunoblot experiments were repeated 2 – 3 times and representative blots are shown.
Figure 3.
Figure 3.. CDKi inhibit TC-dependent transcription
A. Estimating the mRNA levels of TAZ target genes, Amotl2, Arhgap29, and Ajuba by quantitative PCR (qPCR) after treating EHE17 cells with CDKi CGP and Dina. Statistical significance was evaluated using an unpaired t test. * P < 0.025, *** P < 0.0006, **** P < 0.0001. Error bars: standard deviation, N = 3 independent experiments, and representative qPCR profiles are shown. B. TC expression levels were determined by qPCR after CGP or Dina treatment. *** P<0.0003. Error bars: standard deviation, N = 4 independent experiments. C. ChIP qPCR was used to evaluate the binding of TC to TEAD DNA elements in the Taz promoter region. Samples used for immunoprecipitation include mock IgG, anti-TAZ IgG, and anti-TAZ IgG after Dina treatment. Statistical significance was evaluated using an unpaired t-test. Error bars represent SEM, and * P < 0.02, ** P < 0.01, n = 3. D. Gene set enrichment analysis showing that TEAD-dependent genes identified through MGH-CP1 (TEADi) treatment were negatively correlated with the control in the Dina treatment versus vehicle control expression dataset. EHE17 cells were used in this experiment and they were treated with Dina, MGH-CP1, or vehicle control.
Figure 4.
Figure 4.. CDKi abrogate EHE cell proliferation in vitro and metastases in vivo
A. Viability curves after treating EHE17 cells with CDKi, CGP, Dina, or TEADi MGH-CP1. B. Induction of apoptosis was measured using Caspase-Glo assay after CGP, Dina, or MGH-CP1 treatments. Cell viability of EHE6 (C) and EHE26 (D) cell lines was determined using the CCK-8 assay after treatment with the indicated inhibitors. A - D Error bars represent SEM, n = 3, IC50 values were calculated using a nonlinear four-parameter curve fit. E. Histological photomicrograph of the primary allograft tumor showing epithelioid cells set in a myxohyaline stroma. The arrow shows the metastatic EHE in the vascular space. Scale Bar: 50 μm. F. Representative photomicrographs of lung metastatic lesions after H&E staining. Dina-treated mice displayed significantly lower lung metastatic surface area (black circle). Scale Bar: 500 μm. G. Metastatic lesions were quantified by determining the ratio of metastatic lesion area to total lung area. Statistical significance was evaluated using an unpaired t-test (n = 6 control mice and n = 7 treated mice. H. Percentage change in body weight in the control and treated mice.
Figure 5.
Figure 5.. CDK9 inhibition mobilizes TC
All experiments were performed in EHE17 cells. A. Evaluating the mobility of TC by IF using nuclear export (leptomycin B) and nuclear import blockers (INI-43). Scale Bar – 25 μm B. Quantification of the TC cytoplasm/nucleus ratio in cells from the imaging experiment presented in (A); each cyan dot corresponds to the cytoplasm/nucleus ratio of a single cell and the red bar represents the median. The data were analyzed using one-way ANOVA, and statistical significance was evaluated using Dunnett’s multiple comparisons test (P**** < 0.0001). C. Selective CDKi were used to narrow down the CDK that enhances the mobility of TC. The mobility of TC was evaluated by determining the cytoplasm/nucleus ratio. D. The protein levels of TC were determined by IF after treating EHE17 cells with the indicated selective CDKi. Scale Bar – 25 μm E. Immunoblotting to determine TC levels after selective CDKi treatment. Actin was used as a loading control. F. qPCR data showing the expression levels of TC target genes after AZD4573 (300 nM) treatment. Error bars represent SEM, and * P < 0.02, ** P < 0.001, **** P < 0.0001.

References

    1. Tanas MR, Sboner A, Oliveira AM, Erickson-Johnson MR, Hespelt J, Hanwright PJ, et al. Identification of a disease-defining gene fusion in epithelioid hemangioendothelioma. Sci Transl Med. 2011;3(98):98ra82. - PubMed
    1. Errani C, Zhang L, Sung YS, Hajdu M, Singer S, Maki RG, et al. A novel WWTR1-CAMTA1 gene fusion is a consistent abnormality in epithelioid hemangioendothelioma of different anatomic sites. Genes Chromosomes Cancer. 2011;50(8):644–53. - PMC - PubMed
    1. Antonescu CR, Le Loarer F, Mosquera JM, Sboner A, Zhang L, Chen CL, et al. Novel YAP1-TFE3 fusion defines a distinct subset of epithelioid hemangioendothelioma. Genes Chromosomes Cancer. 2013;52(8):775–84. - PMC - PubMed
    1. Seavey CN, Pobbati AV, Rubin BP. Unraveling the Biology of Epithelioid Hemangioendothelioma, a TAZ-CAMTA1 Fusion Driven Sarcoma. Cancers (Basel). 2022;14(12). - PMC - PubMed
    1. Dermawan JK, Azzato EM, Billings SD, Fritchie KJ, Aubert S, Bahrami A, et al. YAP1-TFE3-fused hemangioendothelioma: a multi-institutional clinicopathologic study of 24 genetically-confirmed cases. Mod Pathol. 2021;34(12):2211–21. - PubMed

MeSH terms

LinkOut - more resources