. 2024 Jan 8;18(1):wrae138.
doi: 10.1093/ismejo/wrae138.

Four years of climate warming reduced dark carbon fixation in coastal wetlands

Affiliations

Four years of climate warming reduced dark carbon fixation in coastal wetlands

Bolin Liu et al. ISME J. .

Abstract

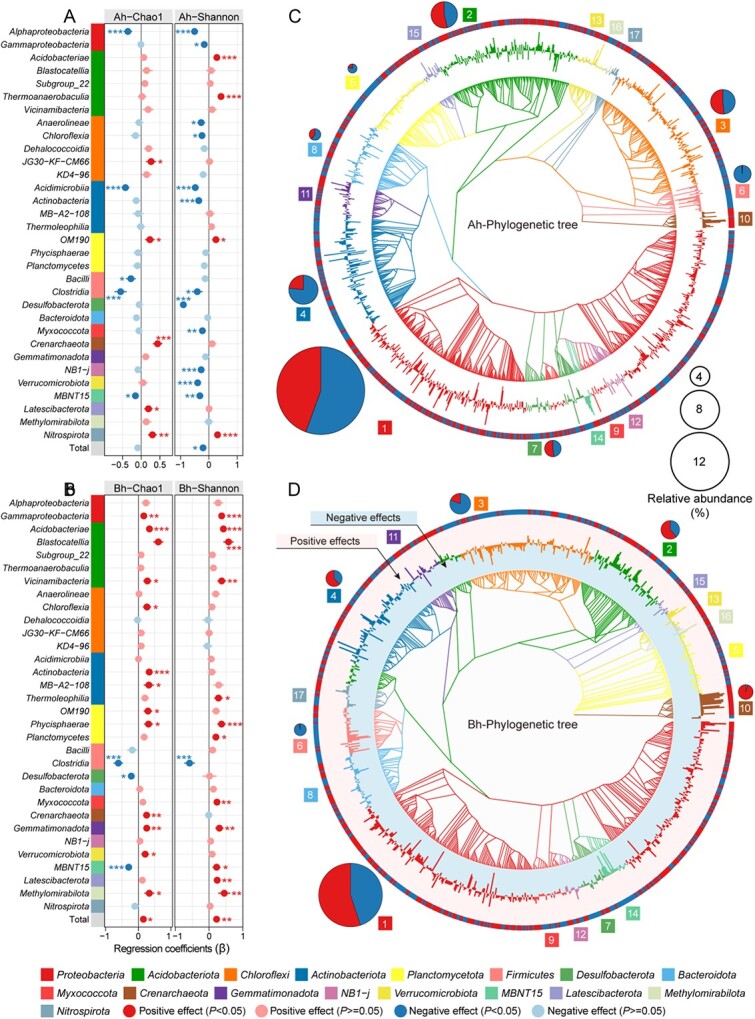
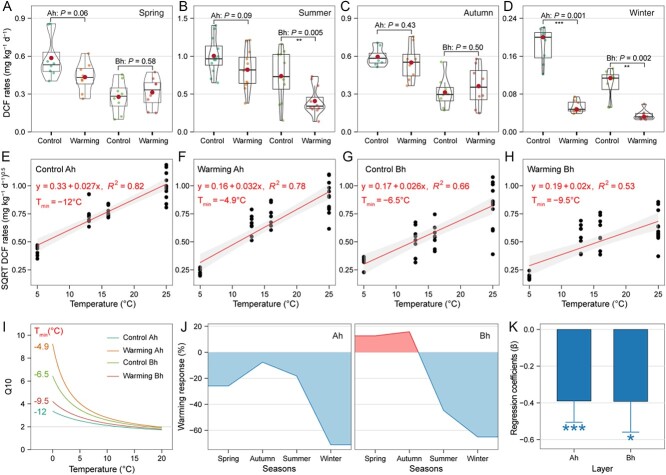
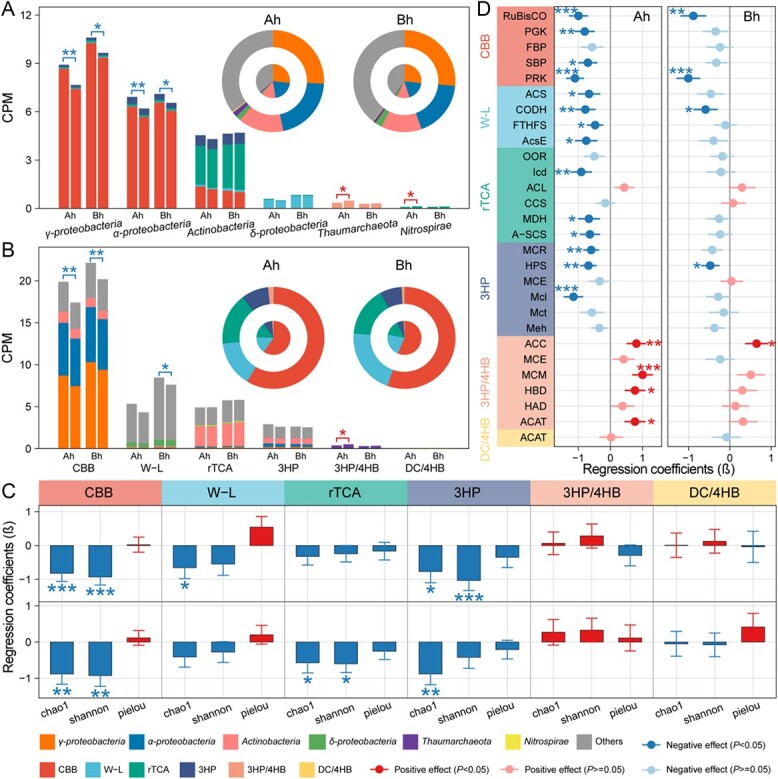
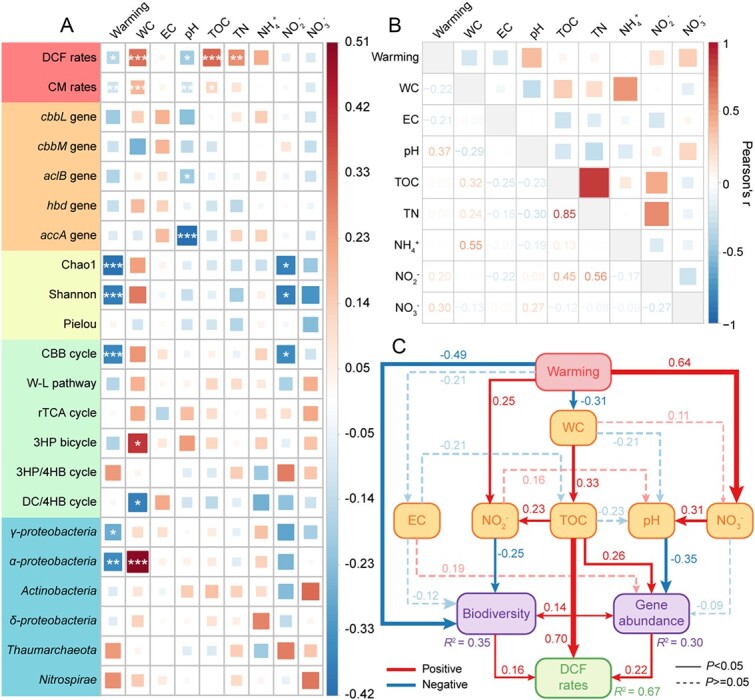
Dark carbon fixation (DCF), conducted mainly by chemoautotrophs, contributes greatly to primary production and the global carbon budget. Understanding the response of DCF process to climate warming in coastal wetlands is of great significance for model optimization and climate change prediction. Here, based on a 4-yr field warming experiment (average annual temperature increase of 1.5°C), DCF rates were observed to be significantly inhibited by warming in coastal wetlands (average annual DCF decline of 21.6%, and estimated annual loss of 0.08-1.5 Tg C yr-1 in global coastal marshes), thus causing a positive climate feedback. Under climate warming, chemoautotrophic microbial abundance and biodiversity, which were jointly affected by environmental changes such as soil organic carbon and water content, were recognized as significant drivers directly affecting DCF rates. Metagenomic analysis further revealed that climate warming may alter the pattern of DCF carbon sequestration pathways in coastal wetlands, increasing the relative importance of the 3-hydroxypropionate/4-hydroxybutyrate cycle, whereas the relative importance of the dominant chemoautotrophic carbon fixation pathways (Calvin-Benson-Bassham cycle and W-L pathway) may decrease due to warming stress. Collectively, our work uncovers the feedback mechanism of microbially mediated DCF to climate warming in coastal wetlands, and emphasizes a decrease in carbon sequestration through DCF activities in this globally important ecosystem under a warming climate.

Keywords: carbon fixation pathway; chemoautotrophy; coastal wetlands; dark carbon fixation; metagenomics; warming.


Conflict of interest statement

The authors declare no competing interests.

Figures

Graphical Abstract
Graphical Abstract
Figure 1
Figure 1
Effects of warming on various microbial lineages in coastal wetland soils. (a–b) The regression coefficients (β) of warming on the richness and diversity of major microbial lineages, determined through LMMs based on 16S rRNA gene sequences. Statistical significance was determined using Wald type II χ2 tests (n = 96). The results are presented as the mean ± standard deviation (SD) of the coefficients. Significance levels are indicated by asterisks (*P < 0.05, **P < 0.01, and ***P < 0.001). Nonsignificant changes are denoted by light-colored dots. Ah and Bh represent surface (0–5 cm) and subsurface (5–10 cm) layers of the soil, respectively. (c–d) Maximum-likelihood tree of individual microbial 16S rRNA gene ASVs (the innermost ring), where only ASVs with a significant (P < 0.05) response to warming and an average reads number > 2 among samples are included. The outside and inside bars of the second ring represent the positive and negative effect sizes of warming on rescaled taxon relative abundances, respectively. The colors of the branches in the first ring and the bars in the second ring correspond to individual phyla. Additionally, colors in the third ring represent ASVs with significant increase or decrease under warming. The size of the pies reflects the overall relative abundance (>2%) of microbial phyla across all samples, with different colored sections representing the proportions of the total abundance of ASVs that increased or decreased under warming, respectively.
Figure 2
Figure 2
DCF rates of coastal wetland soils in response to climate warming. (a–d) Effects of climate warming on DCF rates. Boxes represent the interquartile range (IQR) between the first and third quartiles (25th and 75th percentiles, respectively), and the horizontal line inside the box defines the median. Whiskers represent the lowest and highest values within 1.5 times the IQR from the first and third quartiles, respectively. Ah and Bh represent surface (0–5 cm) and subsurface (5–10 cm) layers of the soil, respectively. (e–h) Square root (SQRT) relationship between temperature and DCF rates in both Ah and Bh layers of warming and control plots. (i) Variation in Q10 with temperature calculated for different Tmin from fitted curves of plots e-h. (j) Responses of DCF rates to climate warming. (k) The regression coefficients (β) of warming on the DCF rates in Ah and Bh layers, determined through LMMs. Significance levels are denoted by asterisks (*P < 0.05, **P < 0.01, and ***P < 0.001).
Figure 3
Figure 3
Abundances of cbbL (a), cbbM (b), aclB (c), hbd (d), and accA (e) genes in coastal wetland soils. The abundances were normalized based on soil weight. Ah and Bh represent surface (0–5 cm) and subsurface (5–10 cm) layers of the soil, respectively. Boxes represent the IQR between the first and third quartiles (25th and 75th percentiles, respectively), and the horizontal line inside the box defines the median. Whiskers represent the lowest and highest values within 1.5 times the IQR from the first and third quartiles, respectively. The asterisk above the column denotes significant differences between control and warming treatments (*P < 0.05, **P < 0.01, and ***P < 0.001).
Figure 4
Figure 4
Effects of warming on chemoautotrophic community and their carbon fixation pathways in coastal wetland soils. (a–b) The normalized abundances (CPM) of various chemoautotrophic microbial lineages and carbon fixation pathways based on the metagenome analysis. Functional genes were annotated by comparing against the KEGG database. Ah and Bh represent surface (0–5 cm) and subsurface (5–10 cm) layers of the soil, respectively. The left and right bars represent the control and warming groups, respectively. The asterisks above the bar denote significant effect of warming on the normalized abundance of chemoautotrophs based on LMMs. The inside and outside rings in the panel represent the proportions of the abundance for various chemoautotrophic microbial lineages or carbon fixation pathways in the control and warming groups, respectively. (c) The regression coefficients (β) of climate warming on the richness (Chao1), diversity (Shannon), and evenness (Pielou) of chemoautotrophic communities using different carbon fixation pathways. (d) Effects of warming on the normalized abundance of enzymes associated with different carbon fixation pathways were determined using LMMs. Significance levels are denoted by asterisks (*P < 0.05, **P < 0.01, and ***P < 0.001).
Figure 5
Figure 5
Environmental factors influencing variations in the DCF rates process and associated chemoautotrophs under climate warming. (a) Correlations between environmental parameters and DCF rates, CM rates, abundances and diversity of chemoautotrophic microbial communities, carbon fixation pathways, and majority lineages of chemoautotrophs, determined using LMMs. The color denotes the correlation coefficient statistical significance was assessed using Wald type II χ2 tests with n = 64 independent soil samples. Significance levels are denoted by asterisks (*P < 0.05, **P < 0.01, and ***P < 0.001). (b) Pairwise correlations between environmental parameters in coastal wetland soils. The numbers in the lower triangle represent the Pearson’s correlation coefficient. The shade of color and the size of square represent strength of the correlation. (c) SEMs assessing the relationship between environmental variables, abundance and diversity of chemoautotrophic microbial communities, and DCF rates in coastal wetland soils. Model parameters: df = 22, χ2 = 20.3 P = 0.57, gfi = 0.95, cfi = 1, rmsea = 0, srmr = 0.05. Solid lines represent significant relationships, and dashed lines represent nonsignificant relationships. Numbers near the arrow indicate the standardized effect coefficients. R2 represents the proportion of variance explained for dependent variable.

References

    1. Duarte CM, Middelburg JJ, Caraco N. Major role of marine vegetation on the oceanic carbon cycle. Biogeosciences 2005;2:1–8. 10.5194/bg-2-1-2005 - DOI
    1. Wang F, Liu J, Qin Get al. Coastal blue carbon in China as a nature-based solution toward carbon neutrality. Innovation 2023;4:100481. 10.1016/j.xinn.2023.100481 - DOI - PMC - PubMed
    1. Baltar F, Herndl GJ. Ideas and perspectives: is dark carbon fixation relevant for oceanic primary production estimates? Biogeosciences 2019;16:3793–9. 10.5194/bg-16-3793-2019 - DOI
    1. Vasquez-Cardenas D, Meysman FJR, Boschker HTS. A cross-system comparison of dark carbon fixation in coastal sediments. Global Biogeochem Cycles 2020;34:e2019GB006298. 10.1029/2019GB006298 - DOI - PMC - PubMed
    1. Liu B, Hou L, Zheng Yet al. Dark carbon fixation in intertidal sediments: controlling factors and driving microorganisms. Water Res 2022;216:118381. 10.1016/j.watres.2022.118381 - DOI - PubMed

LinkOut - more resources