. 2024 Jul 25;9(17):e174643.
doi: 10.1172/jci.insight.174643.

The genomic landscape of lung cancer in never-smokers from the Women's Health Initiative

Affiliations

The genomic landscape of lung cancer in never-smokers from the Women's Health Initiative

Sitapriya Moorthi et al. JCI Insight. .

Abstract

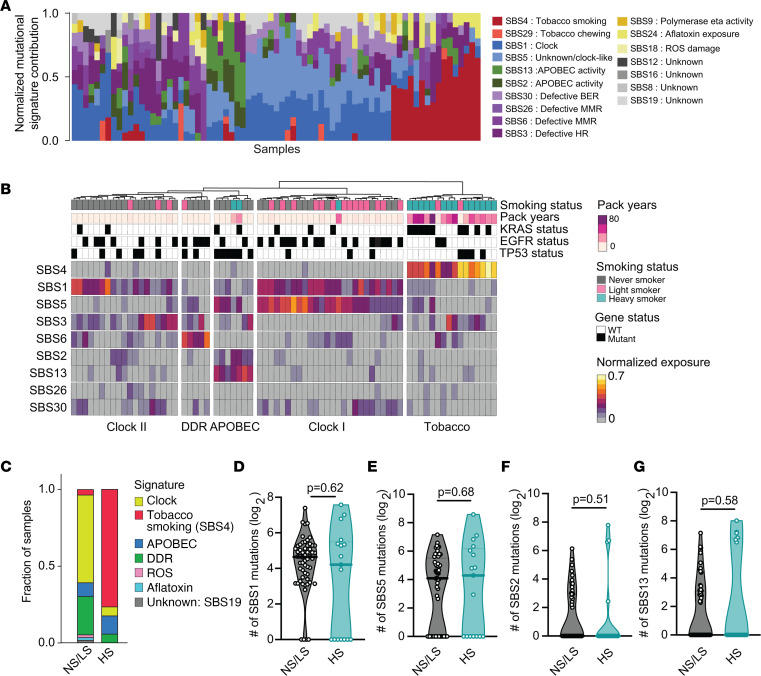
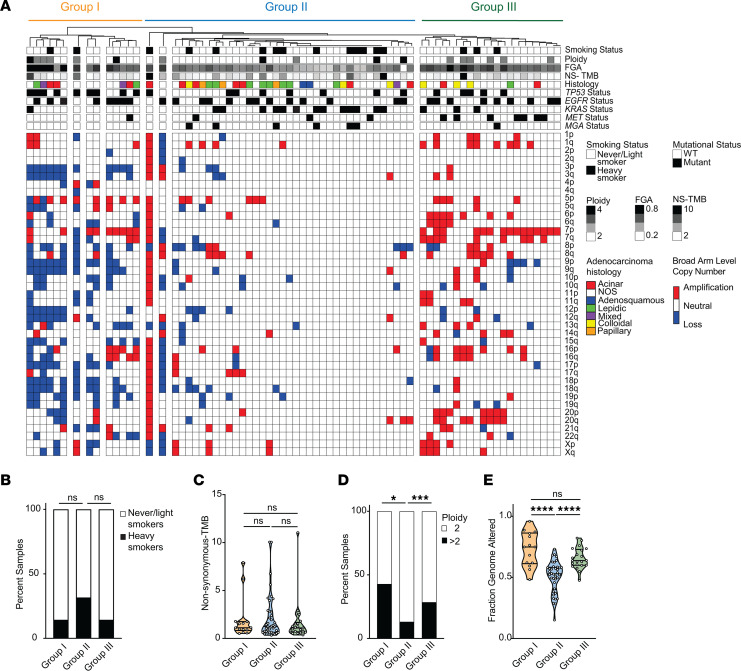
Over 200,000 individuals are diagnosed with lung cancer in the United States every year, with a growing proportion of cases, especially lung adenocarcinoma, occurring in individuals who have never smoked. Women over the age of 50 comprise the largest affected demographic. To understand the genomic drivers of lung adenocarcinoma and therapeutic response in this population, we performed whole genome and/or whole exome sequencing on 73 matched lung tumor/normal pairs from postmenopausal women who participated in the Women's Health Initiative. Somatic copy number alterations showed little variation by smoking status, suggesting that aneuploidy may be a general characteristic of lung cancer regardless of smoke exposure. Similarly, clock-like and APOBEC mutation signatures were prevalent but did not differ in tumors from smokers and never-smokers. However, mutations in both EGFR and KRAS showed unique allelic differences determined by smoking status that are known to alter tumor response to targeted therapy. Mutations in the MYC-network member MGA were more prevalent in tumors from smokers. Fusion events in ALK, RET, and ROS1 were absent, likely due to age-related differences in fusion prevalence. Our work underscores the profound effect of smoking status, age, and sex on the tumor mutational landscape and identifies areas of unmet medical need.

Keywords: Genetic variation; Genetics; Lung cancer; Molecular diagnosis; Therapeutics.


Conflict of interest statement

Conflict of interest: The authors have declared that no conflict of interest exists.

Figures

Figure 1
Figure 1. Unique prevalence of somatically mutated genes in tumors from smokers and never-smokers.
(A) Nonsilent tumor mutational burden (TMB) rate (mutations/Mbp) in never-smokers (NS; < 100-lifetime cigarettes), light smokers (LS; < 5 pack years), and heavy smokers (HS; > 20 pack years). (B) Percent of C to A transversions. (C) Association between nonsilent TMB and pack-years smoked. (D) Association between percent C to A transversions and pack years smoked. (E) Prevalence of canonical Ras/RTK pathway driver mutations in never-/light smokers (NS/LS) and heavy smokers (HS). (F) Oncoplot of highlighted mutated genes. Each column is an individual tumor. The top bar plot shows the nonsilent TMB rate (mutations/Mbp) for each tumor. (GJ) The total number of samples with EGFR (G), KRAS (H), MGA (I), and MET (J) mutations in NS/LS versus HS. (K) Schematic representation of the MET locus between exon 13 and exon 15 and identified alterations likely to promote exon 14 skipping. Blue nucleotides represent branchpoint site, and red nucleotides represent the polypyrimidine tract. ****P < 0.0001; ***P < 0.001; **P < 0.01; Kruskal-Wallis/Dunn’s test (A and B), simple linear regression (C and D), or 2-tailed Fisher’s exact test (GJ).
Figure 2
Figure 2. Somatic mutational signatures distinguish tumors from never-/light and heavy smokers.
(A) Contribution of each SBS mutational signature to the total repertoire of mutations in each tumor. The fractional contribution is calculated by normalizing each signature exposure to the total signature exposure in each tumor. Each stacked bar represents 1 tumor. (B) Heatmap of unsupervised clustering of 9 normalized mutational signatures using Ward’s minimum variance method for both samples and signatures. The clustering is based on the normalized signature exposures. (C) Stacked bar graph indicating the mutational signature contributing to the maximal mutational burden for each sample. (DG) Comparison of the estimated absolute number of mutations attributable to clock signatures (SBS1 and SBS5) and APOBEC signatures (SBS2 and SBS13) in never-/light smokers and heavy smokers. Exact P values are shown for testing by Mann-Whitney U test (2-tailed).
Figure 3
Figure 3. Enrichment of EGFR indel and specific KRAS variants in never-/light smokers.
(AE) Percent of EGFR driver mutations consisting of either indel or missense variants in WHI (A), TCGA (B), MSK (C), and GENIE (D) cohorts, or all external cohorts combined (E). (F) SBS4/Tobacco smoke signature contribution to the total mutational signature spectrum of samples with KRAS mutations. The contribution of SBS4 (gray bars) is the normalized contribution relative to the contribution of all other signatures (white bars). (G) Scatter plot of nonsilent tumor mutational burden (TMB) and percent C to A transversions in KRAS-mutant samples. (HL) Percent KRAS G12 mutant samples with either G12C (dark blue), G12D (light blue), or other G12 drivers (white) in WHI (H), TCGA (I), MSK (J), or GENIE (K) cohorts or external cohorts combined (L). Statistical analysis was done using 2-tailed Fisher’s test. NS, never-smoker; LS, light smoker; MS, moderate smoker; HS, heavy smoker; ES, ever-smoker. ****P < 0.0001; ***P < 0.001; **P < 0.01; *P < 0.05 by 2-tailed Fisher’s exact test.
Figure 4
Figure 4. Somatic copy number changes do not differentiate tumors from never-/light smokers and heavy smokers.
(A and B) Ploidy of tumors from the WHI cohort or TCGA cohort. (C and D) Fraction genome altered (FGA) of from the WHI cohort or MSK cohort. (E) Genome-wide frequency of amplifications and deletions in never-/light smokers (gray/top panels) and heavy smokers (blue/bottom panels) across all 23 chromosomes. Mann-Whitney U test was used to evaluate significant difference in ploidy and FGA between groups. Cosine similarity was calculated between both smoking groups for amplifications (top) and deletions (bottom).
Figure 5
Figure 5. Arm-level copy number alterations identify tumor subtypes unrelated to smoke exposure.
(A) Heatmap of unsupervised clustering of arm-level copy number alterations in the WHI cohort using Ward’s minimum variance method for both samples and signatures. The clustering is based on binarized arm-level calls from GISTIC 2.0. Samples were grouped into 3 groups based on broad clusters and copy number patterns. (B) Stacked bar graph showing the percent of never-/smokers and heavy smokers in each copy number group. Fisher’s exact test was used to compare the number of NS/LS in each copy number group compared with the other. (C) Nonsilent TMB in samples split by arm-level copy number group. Mann-Whitney U test. Group I, orange; Group II, blue; and Group III, green. (D) Stacked bar graph showing percent samples in each group with ploidy 2 or ploidy greater than 2. Black bars indicate a ploidy estimate greater than 2, and white bars indicate a ploidy estimate of 2. Fisher’s exact test was used to compare enrichment of ploidy > 2 in each copy number group. ***P < 0.001, *P < 0.05. (E) Fraction genome altered in samples split by arm-level copy number group. One-way ANOVA/Tukey was used to compare significance between the different groups. **** P < 0.0001.

References

    1. Sung H, et al. Global cancer statistics 2020: GLOBOCAN estimates of incidence and mortality worldwide for 36 cancers in 185 countries. CA Cancer J Clin. 2021;71(3):209–249. doi: 10.3322/caac.21660. - DOI - PubMed
    1. Melosky B, et al. The rapidly evolving landscape of novel targeted therapies in advanced non-small cell lung cancer. Lung Cancer. 2021;160:136–151. doi: 10.1016/j.lungcan.2021.06.002. - DOI - PubMed
    1. Kratzer TB, et al. Lung cancer statistics, 2023. Cancer. 2024;130(8):1330–1348. doi: 10.1002/cncr.35128. - DOI - PubMed
    1. Imielinski M, et al. Mapping the hallmarks of lung adenocarcinoma with massively parallel sequencing. Cell. 2012;150(6):1107–1120. doi: 10.1016/j.cell.2012.08.029. - DOI - PMC - PubMed
    1. Cancer Genome Atlas Research Network. Comprehensive molecular profiling of lung adenocarcinoma. Nature. 2014;511(7511):543–550. doi: 10.1038/nature13385. - DOI - PMC - PubMed

MeSH terms