. 2024 Sep:75:103276.
doi: 10.1016/j.redox.2024.103276. Epub 2024 Jul 20.

Metastatic breast cancer cells are metabolically reprogrammed to maintain redox homeostasis during metastasis

Affiliations

Metastatic breast cancer cells are metabolically reprogrammed to maintain redox homeostasis during metastasis

Marco Biondini et al. Redox Biol. 2024 Sep.

Abstract

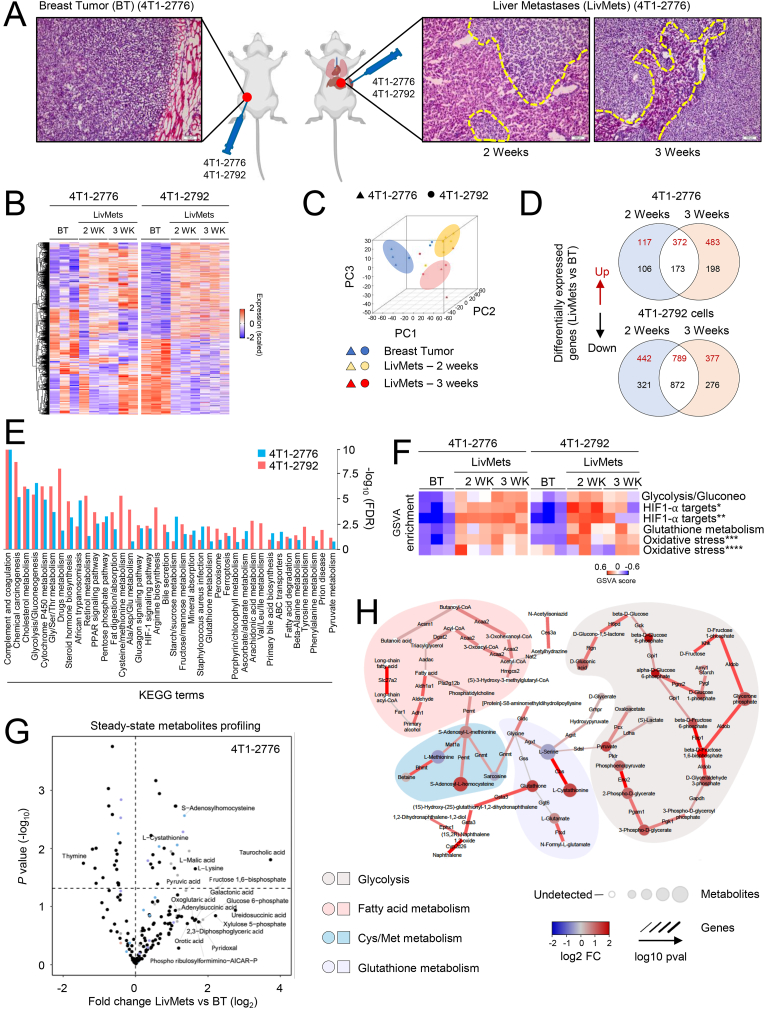
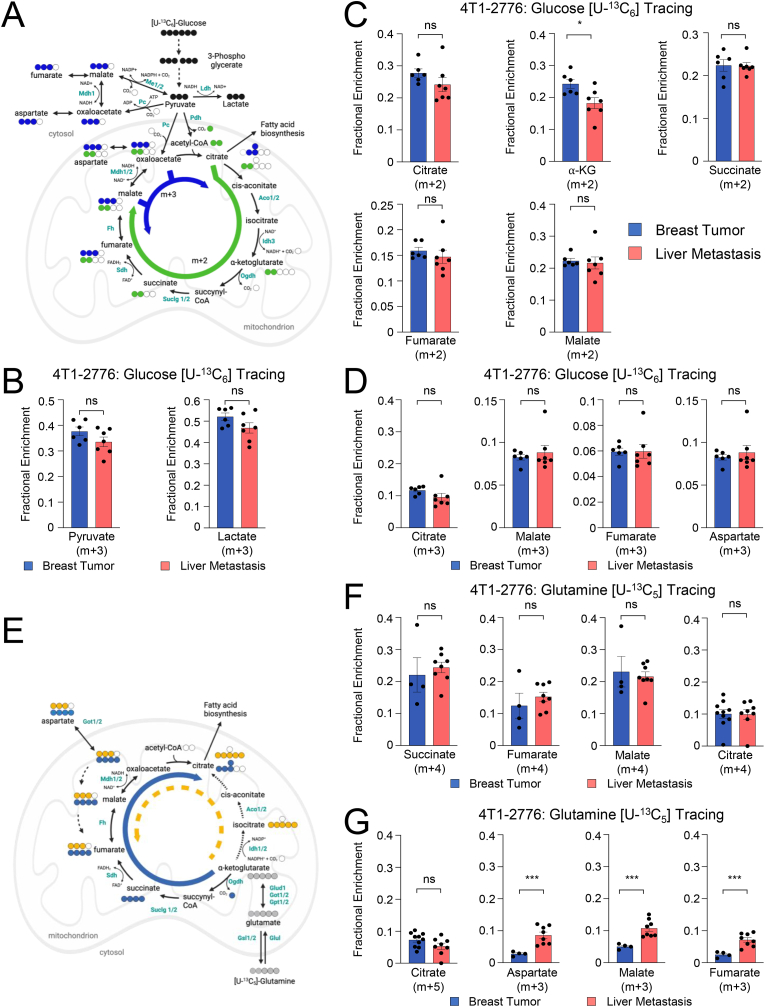
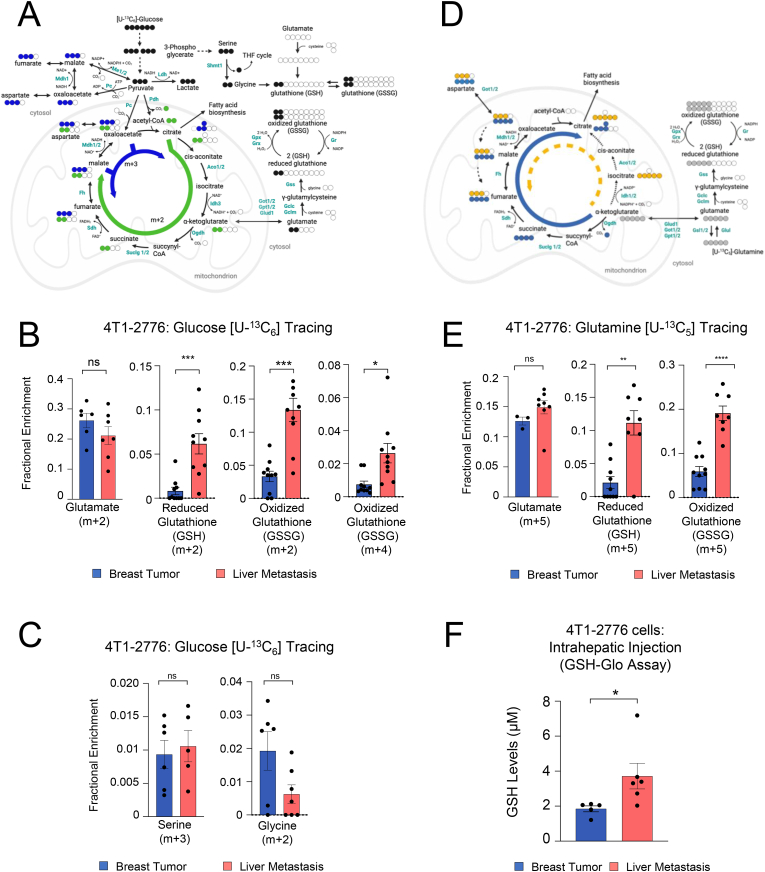
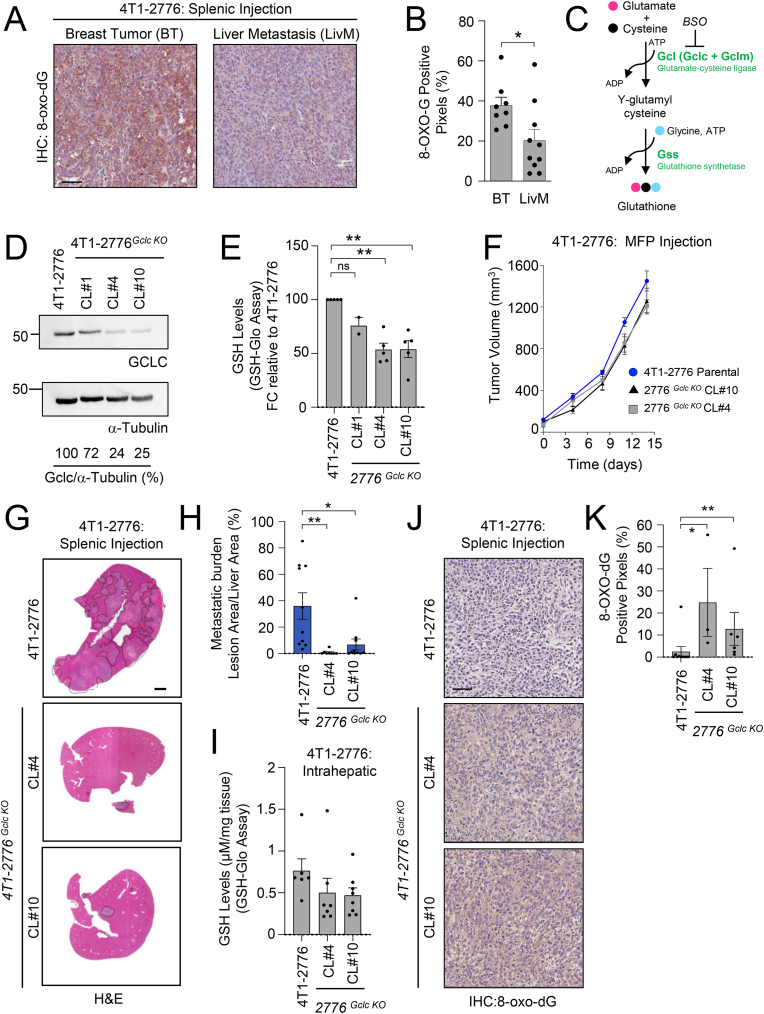
Metabolic rewiring is essential for tumor growth and progression to metastatic disease, yet little is known regarding how cancer cells modify their acquired metabolic programs in response to different metastatic microenvironments. We have previously shown that liver-metastatic breast cancer cells adopt an intrinsic metabolic program characterized by increased HIF-1α activity and dependence on glycolysis. Here, we confirm by in vivo stable isotope tracing analysis (SITA) that liver-metastatic breast cancer cells retain a glycolytic profile when grown as mammary tumors or liver metastases. However, hepatic metastases exhibit unique metabolic adaptations including elevated expression of genes involved in glutathione (GSH) biosynthesis and reactive oxygen species (ROS) detoxification when compared to mammary tumors. Accordingly, breast-cancer-liver-metastases exhibited enhanced de novo GSH synthesis. Confirming their increased capacity to mitigate ROS-mediated damage, liver metastases display reduced levels of 8-Oxo-2'-deoxyguanosine. Depletion of the catalytic subunit of the rate-limiting enzyme in glutathione biosynthesis, glutamate-cysteine ligase (GCLC), strongly reduced the capacity of breast cancer cells to form liver metastases, supporting the importance of these distinct metabolic adaptations. Loss of GCLC also affected the early steps of the metastatic cascade, leading to decreased numbers of circulating tumor cells (CTCs) and impaired metastasis to the liver and the lungs. Altogether, our results indicate that GSH metabolism could be targeted to prevent the dissemination of breast cancer cells.

Keywords: Breast cancer; GCLC; Glutathione; Glycolysis; HIF-1α; Liver metastasis; Metabolism; Oxidative stress.


Conflict of interest statement

Declaration of competing interest The authors declare that they have no known competing financial interests or personal relationships that could have appeared to influence the work reported in this paper.

Figures

Image 1
Graphical abstract
Fig. 1
Fig. 1
Transcriptomic and metabolomic analyses of primary mammary tumors and breast cancer liver metastases. (A) Hematoxylin/eosin staining of 4T1-2776 mammary tumors (BT) and liver metastases (LivMets) (splenic injections). The yellow dashed lines in the liver metastases images denote the tumor/liver border region isolated by laser capture microdissection. (B) Heatmap depicting unsupervised hierarchical clustering of differentially expressed genes in liver metastases (2 and 3 weeks) compared to mammary tumors (4T1-2776 and 4T1-2792). The color scale indicates log2 expression values. Gene expression profiling was performed on 3 tumor samples per each condition. (C) Principal component analysis of unfiltered gene expression data comparing liver metastases and mammary tumors. (D) Venn diagram indicating differentially expressed genes common to liver metastases (both at 2 and 3 week time points) relative to mammary tumors. The number of significant differentially expressed genes is indicated (E) KEGG analyses showing enriched pathways for commonly upregulated genes in 4T1-2776 and 4T1-2792-derived liver metastases. (F) Gene set variation analysis (GSVA) of the indicated gene expression signatures in liver metastases compared to mammary tumors. Gene signatures used were as follows: 1) Glycolysis/Gluconeogenesis pathway derived from KEGG, 2) a hand-curated list of HIF1-⍺ transcriptional targets* (SI Table 1), 3) a list of HIF1-⍺ transcriptional targets** was obtained from a publicly available dataset (GSEA: M12299 [50]), 4) Glutathione metabolism pathway from KEGG (hsa00480), 5) a previously published Oxidative stress*** signature [51] and 6) a second published Oxidative stress**** signature [52]. (G) Volcano plot of steady-state metabolites detected in 2 week liver metastases samples (4T1-2776) (intrahepatic injections) compared to mammary tumors. Metabolites belonging to major pathways that are differentially modulated between metastases and mammary tumors are represented with colored dots. (H) Integrated metabolic network analysis of 2 week liver metastases (4T1-2776). Metabolic enzyme gene expression is represented by lines and gene expression p-values are indicated by line thickness. Metabolites are depicted as circles and their p-values are represented by circle size. The magnitude of fold changes in metabolite abundance and gene expression is represented with a blue (low) to red (enriched) color scale. Differentially modulated major pathways in metastases versus primary mammary tumors are represented by colored areas. (For interpretation of the references to color in this figure legend, the reader is referred to the Web version of this article.)
Fig. 2
Fig. 2
Liver-metastatic breast cancer cells similarly utilize glucose and glutamine in the context of mammary tumors and liver metastases. (A) Stable isotope tracing schematic illustrating 13C labelling (black-filled circles) patterns from [U–13C6]-Glucose. The green arrow depicts the forward direction through the citric acid cycle initiated by pyruvate dehydrogenase (Pdh) and generates m+2 metabolites (green-filled circles). The blue arrow outlines metabolic pathways initiated by pyruvate carboxylase (Pc) and results in m+3 metabolites (blue-filled circles). (B) [U–13C6]-Glucose tracing into glycolytic intermediates (pyruvate and lactate m+3, 3 h tracer) in liver metastases (intrahepatic injections) and mammary tumors (4T1-2776), expressed as fractional enrichment. Error bars indicate the SEM. (C) [U–13C6]-Glucose tracing into the citric acid cycle via Pdh (citrate, α-KG, succinate, fumarate, malate m+2, 3 h tracer) in liver metastases and mammary tumors (4T1-2776), expressed as fractional enrichment. Error bars indicate the SEM. *P ≤ 0.05, by unpaired Student's t-test. (D) [U–13C6]-Glucose tracing into the citric acid cycle mediated by Pc or Me1/2 activity (citrate, malate, fumarate, and aspartate m + 3, 3 h tracer) in liver metastases and mammary tumors (4T1-2776), expressed as fractional enrichment. Error bars indicate the SEM. (E) Stable isotope tracing schematic illustrating the 13C labelling (blue-filled circles) of m+4 citric acid cycle metabolites from [U–13C5]-Glutamine. The blue arrow indicates the forward direction through the citric acid cycle. Reductive carboxylation (yellow dashed arrow) initiated by Idh1/2 generates m+3 and m+5 metabolites (yellow-filled circles). (F) [U–13C5]-Glutamine tracing to glutamate m+ 5 and into the citric acid cycle (succinate, fumarate, malate, citrate m+4, tracer 3 h) in liver metastases and mammary tumors (4T1-2776), expressed as fractional enrichment. Error bars indicate the SEM. (G) [U–13C5]-Glutamine tracing into glutamate and citric acid cycle intermediates via the reductive carboxylation pathway (aspartate, malate, fumarate m+3 and citrate m+5, 3 h tracer) in liver metastases and mammary tumors (4T1-2776), expressed as fractional enrichment. Error bars indicate the SEM. ***P ≤ 0.001 by unpaired Student's t-test. (For interpretation of the references to color in this figure legend, the reader is referred to the Web version of this article.)
Fig. 3
Fig. 3
Metastatic breast cancer cells in the liver microenvironment direct glucose- and glutamine-derived carbons into glutathione biosynthesis. (A) Stable isotope tracing schematic depicting the flow of 13C from uniformly labelled [U–13C6]-Glucose into glutathione. (B) [U–13C6]-Glucose tracing into glutamate m+2 via citric acid cycle intermediates, which is ultimately incorporated into reduced glutathione (GSH m+2) and oxidized glutathione (GSSG m+4). Data is expressed as fractional enrichment and shown for both liver metastases and mammary tumors (4T1-2776). Error bars indicate the SEM. *P ≤ 0.05, **P ≤ 0.01; ***P ≤ 0.001 by unpaired Student's t-test. (C) [U–13C6]-Glucose tracing to serine m+3 and glycine m+2 via shunt pathways in liver metastases (intrahepatic injections) and mammary tumors (4T1-2776), expressed as fractional enrichment. Error bars indicate the SEM. (D) Diagram depicting the flow of stable isotope labelled [U–13C5]-Glutamine to glutathione. (E) Stable isotope tracing schematic depicting [U–13C5]-Glutamine tracing to glutamate m+5 via glutamine synthetase (GLUL), which is ultimately incorporated into GSH m+5 and GSSG m+5. Data are expressed as fractional enrichment and shown for liver metastases and mammary tumors (4T1-2776). Error bars indicate the SEM. **P ≤ 0.01, ****P ≤ 0.0001, by unpaired Student's t-test. (F) Analysis of glutathione levels in primary breast tumors and liver metastases (intrahepatic injections) of 4T1-2776 cells, as assessed by GSH-Glo glutathione assay. Error bars indicate the SEM. *P ≤ 0.05 by unpaired Student's t-test.
Fig. 4
Fig. 4
Loss of GCLC decreases glutathione biosynthesis and modestly impairs mammary tumor growth. (A) Representative images of immunohistochemistry (IHC) staining for 8-Oxo-2′-deoxyguanosine (8-Oxo-dG) in liver metastases (splenic injection) and mammary tumors (mammary fat pad injection) (4T1-2776). Scale represents 50 μm and applies to all panels. (B) Quantification of 8-Oxo-dG IHC staining. Error bars indicate the SEM. *P ≤ 0.05, by unpaired Student's t-test. (C) Diagram illustrating the biosynthesis pathway of the glutathione tripeptide from glutamate, cysteine, and glycine. Glutamate–cysteine ligase (GCL) catalyzes the ATP-dependent condensation of glutamate and cysteine to generate the dipeptide gamma-glutamylcysteine. Glutathione synthetase (GSS) catalyzes the second step in the production of glutathione, which is the condensation of gamma-glutamylcysteine and glycine. Buthionine sulfoximine (BSO) depletes glutathione levels and thereby promotes oxidative stress by binding and irreversibly inhibiting glutamate–cysteine ligase. (D) Representative immunoblot analyses of GCLC expression in 4T1-2776 liver-metastatic breast cancer cells transduced with LentiCrisprV2 with sgRNA targeting Gclc. (E) Relative levels of GSH for breast cancer cells described in (D). Error bars indicate the SEM. *P ≤ 0.05; **P ≤ 0.01, by unpaired Student's t-test. (F) Tumor growth curves of 4T1-2776 parental and Gclc knock-out clones following injection into the mammary fat pads of Balb/c mice. (n = 9 mice for parental and GCLC knock-out clone 10, n = 5 mice for GCLC knock-out clone 4). Error bars indicate the SEM. (G) Representative hematoxylin-eosin (H&E) images of liver metastases in Balb/c mice injected (splenic injection) with 4T1-2776 parental or two independent Gclc knock-out clones. Scale bar represents 2 mm and applies to all panels. (H) Quantification of the liver-metastatic burden. Error bars indicate the SEM. *P ≤ 0.05; **P ≤ 0.01, by unpaired Student's t-test. (I) Analysis of glutathione levels in liver metastasis of 4T1-2776 parental or two independent Gclc knock-out clones (intrahepatic injection), as assessed by GSH-Glo glutathione assay. Error bars indicate the SEM. (J) Immunohistochemistry (IHC) analysis of 8-Oxo-dG staining in liver metastases of mice injected with parental 4T1-2776 or two independent Gclc knockout clones. Scale represents 50 μm and applies to all panels (K) Quantification of 8-Oxo-dG quantification. Error bars indicate the SEM. *P ≤ 0.05, by Mann–Whitney test.
Fig. 5
Fig. 5
Loss of GCLC significantly reduces the formation of liver metastases and diminishes breast cancer-derived circulating tumor cells. (A) Whole blood was collected by cardiac puncture from mice bearing mammary tumors following mammary fat pad injection of parental 4T1-2776 and two independent GCLC knock-out clones. Mammary tumors were allowed to reach an average volume (1100 mm3) and circulating tumor cells (CTCs) were isolated. Images represent formalin-fixed and crystal violet-stained CTC-derived adherent colonies, grown in vitro for one week post-isolation. Red arrowheads indicated crystal-violet stained CTC-derived colonies. Scale bar represents 2 mm and applies to all panels. (B) Quantification of the number of CTC-derived adherent colonies normalized to 0.5 mL of blood collected by cardiac puncture (n = 9 mice for parental and GCLC knock-out clone 10, n = 5 mice for GCLC knock-out clone 4). Error bars indicate the SEM. *P ≤ 0.05; by Mann–Whitney test. (C) Quantification of visible metastatic lesions within the lungs in mice bearing tumors from 4T1-2776 cells (spontaneous metastasis assay). **P ≤ 0.01; ***P ≤ 0.001; by Mann–Whitney test. (D) Quantification of the metastatic burden (lesion area/tissue area) within the lungs in mice bearing tumors from 4T1-2776 cells assessed by hematoxylin & eosin (H&E) staining (spontaneous metastasis assay). *P ≤ 0.05 by unpaired Student's t-test. (E) Representative hematoxylin-eosin (H&E) images of lung metastases in Balb/c mice from tail vein injection of 4T1-2776 parental or two independent Gclc knock-out clones. Scale bar represents 1 mm and applies to all panels. (F) Quantification of the lung-metastatic burden from the experimental metastasis assay. Error bars indicate the SEM. *P ≤ 0.05; ****P ≤ 0.0001, by unpaired Student's t-test. (For interpretation of the references to color in this figure legend, the reader is referred to the Web version of this article.)
Fig. 6
Fig. 6
GCLC promotes the metastasis of mammary tumors to the liver and the lungs in human cells. (A) RT-qPCR analysis from total mRNA for GCLC in MDA-MB-231shControl and MDA_MB-231shGclc4 clone #4 and MDA_MB-231shGclc5 clone #6 cell populations. The mRNA levels for the indicated genes were normalized to b2M mRNA expression. Error bars indicate the SEM. ****P ≤ 0.0001 by Student's t-test. (B) Representative immunoblot analyses of GCLC expression in MDA-MB-231 breast cancer cells transduced with shRNAs targeting Gclc. (C) Relative levels of GSH for breast cancer cells described in (A and B). Error bars indicate the SEM. **P ≤ 0.01, by unpaired Student's t-test (D) Tumor growth curves of MDA-MB-231shControl and MDA_MB-231shGclc4 clone #4 and MDA_MB-231shGclc5 clone #6 following injection into the mammary fat pads of NSG mice. Primary tumors were resected when they reached 500–600 mm3 volume (n = 5 mice for shControl and n = 7 for shGclc4 clone #4 and shGclc5 clone #6). Error bars indicate the SEM. ****P ≤ 0.0001 by Student's t-test performed on tumor growth curves at day 17 and 21. (E) Representative hematoxylin-eosin (H&E) images of spontaneous liver metastases in NSG mice following primary tumor resections described in (D). Scale bar represents 2 mm and applies to all panels. (F) Quantification of the liver-metastatic burden in samples described in (E). Error bars indicate the SEM. *P ≤ 0.05 by unpaired Student's t-test. (G) Representative hematoxylin-eosin (H&E) images of spontaneous lung metastases in NSG mice following primary tumor resections described in (D). Scale bar represents 2 mm and applies to all panels. (H) Quantification of the lung-metastatic burden in samples described in (G). Error bars indicate the SEM. *P ≤ 0.05 by unpaired Student's t-test.

References

    1. Chen W., Hoffmann A.D., Liu H., Liu X. Organotropism: new insights into molecular mechanisms of breast cancer metastasis. npj Precis. Oncol. 2018;2(1) doi: 10.1038/s41698-018-0047-0. - DOI - PMC - PubMed
    1. Riggio A.I., Varley K.E., Welm A.L. The lingering mysteries of metastatic recurrence in breast cancer. Br. J. Cancer. 2021;124(1):13–26. doi: 10.1038/s41416-020-01161-4. - DOI - PMC - PubMed
    1. Lehuédé C., Dupuy F., Rabinovitch R., Jones R.G., Siegel P.M. Metabolic plasticity as a determinant of tumor growth and metastasis. Cancer Res. 2016;76(18):5201–5208. doi: 10.1158/0008-5472.Can-16-0266. - DOI - PubMed
    1. Fukano M., Park M., Deblois G. Metabolic flexibility is a determinant of breast cancer heterogeneity and progression. Cancers. 2021;13(18) doi: 10.3390/cancers13184699. - DOI - PMC - PubMed
    1. McGuirk S., Audet-Delage Y., St-Pierre J. Metabolic fitness and plasticity in cancer progression. Trends Cancer. 2020;6(1):49–61. doi: 10.1016/j.trecan.2019.11.009. - DOI - PubMed

MeSH terms

LinkOut - more resources